
Crop Condition Assessment Program during the 2020 growing season

Archived Content
Information identified as archived is provided for reference, research or recordkeeping purposes. It is not subject to the Government of Canada Web Standards and has not been altered or updated since it was archived. Please "contact us" to request a format other than those available.
Description: Crop Condition Assessment Program during the 2020 growing season
Crop Condition Assessment Program during the 2020 growing season
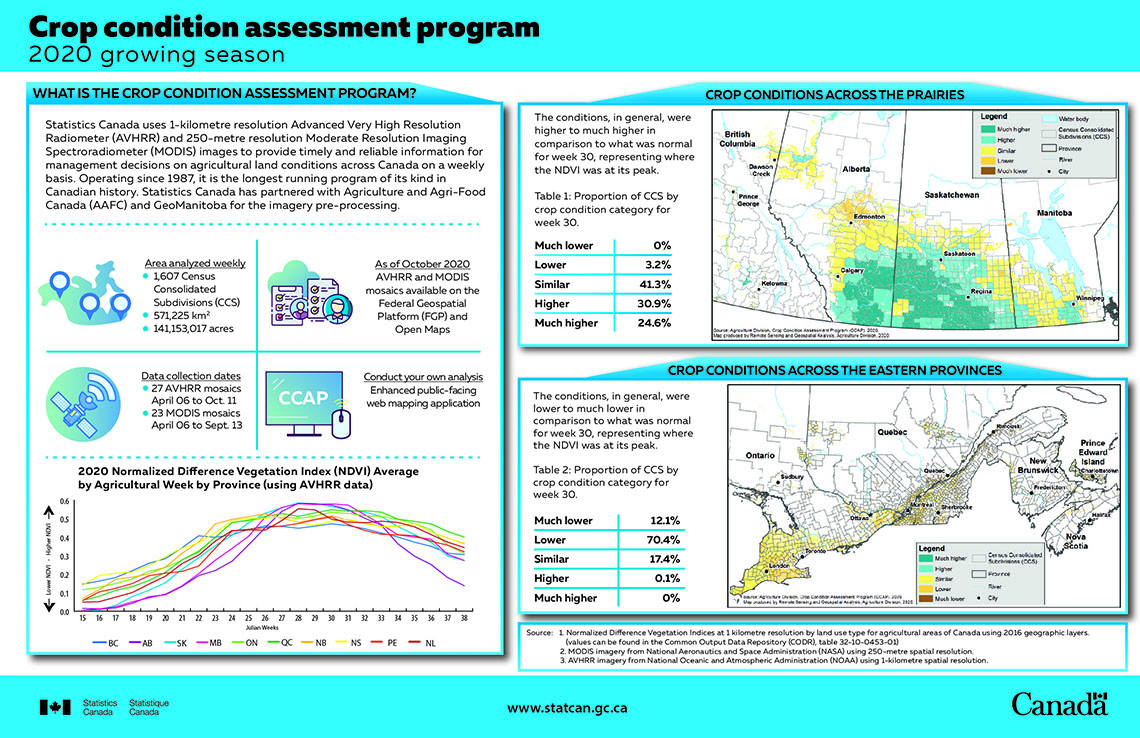
What is the Crop Condition Assessment Program?
Statistics Canada uses 1-kilometre resolution Advanced Very High Resolution Radiometer (AVHRR) and 250-metre resolution Moderate Resolution Imaging Spectroradiometer (MODIS) images to provide timely and reliable information for management decisions on agricultural land conditions across Canada on a weekly basis. Operating since 1987, it is the longest running program of its kind in Canadian history. Statistics Canada has partnered with Agriculture and Agri-Food Canada (AAFC) and GeoManitoba for the imagery preprocessing.
Area analyzed weekly
- 1,607 Census Consolidated Subdivisions (CCS)
- 571,225 km2
- 141,153,017 acres
As of October 2020
AVHRR and MODIS mosaics available on the Federal Geospatial Platform (FGP) and Open Maps
Data collection dates
- 27 AVHRR mosaics
- April 06 to Oct. 11
- 23 MODIS mosaics
- April 06 to Sept. 13
Conduct your own analysis
Enhanced public-facing web mapping application
2020 Normalized Difference Vegetation Index (NDVI) Average by Agricultural Week by Province (using AVHRR data)
The graph illustrates the 2020 Normalized Difference Vegetation Index (NDVI) average by agricultural week by province using AVHRR data. Starting at week 15, the graph shows the NDVI values increase in progression with the growing season during the spring and the beginning of summer. After reaching their peak, around week 30, the NDVI values steadily decrease from week 31 to week 38 with the transition from summer to fall. Each of the Canadian provinces are visible and distinguished by a unique color.
Crop conditions across the Prairies
The conditions, in general, were higher to much higher in comparison to what was normal for week 30, representing where the NDVI was at its peak.
Map of the Prairies: Crop condition across the Prairies according to the intensity of the normalized difference vegetation index compared to the historical normal at the census consolidated subdivisions (CCS) level for week 30, 2020.
On this map, the intensity of the normalized difference vegetation index compared to the historical normal is demonstrated by a color gradient going from dark blue green to dark brown divided in 5 categories of intensity. The growing week 30 was used since representing the week where the NDVI was at its peak. Category 1, much higher, is coloured dark blue green and represents a positive change greater than or equal to 0.095 compared to the historical normal. This category includes 24.6% of the CCS in the Prairies. Category 2, higher, is coloured light blue green and represents a positive change from 0.032 to 0.095 compared to the historical normal. This category includes 30.9% of the CCS in the Prairies. Category 3, similar, is coloured yellow and represents a change from -0.032 to 0.032 compared to the historical normal. This category includes 41.3% of the CCS in the Prairies. Category 4, lower, is coloured orange and represents a change from -0.088 to -0.032 compared to the historical normal. This category includes 3.2% of the CCS in the Prairies. Category 5, much lower, is coloured dark brown and represents a change less than -0.088 compared to the historical normal. This category includes 0% of the CCS in the Prairies.
Source: Agriculture Division, Crop Condition Assessment Program (CCAP), 2020.
Map produced by Remote Sensing and Geospatial Analysis, Agriculture Division, 2020.
Crop conditions across the eastern provinces
The conditions, in general, were lower to much lower in comparison to what was normal for week 30, representing where the NDVI was at its peak.
Map of the eastern provinces: Crop condition across the eastern provinces according to the intensity of the normalized difference vegetation index compared to the historical normal at the census consolidated subdivisions (CCS) level for week 30, 2020.
On this map, the intensity of the normalized difference vegetation index compared to the historical normal is demonstrated by a color gradient going from dark blue green to dark brown divided in 5 categories of intensity. The growing week 30 was used since representing the week where the NDVI was at its peak. Category 1, much higher, is coloured dark blue green and represents a positive change greater than or equal to 0.095 compared to the historical normal. This category includes 0% of the CCS in the eastern provinces. Category 2, higher, is coloured light blue green and represents a positive change from 0.032 to 0.095 compared to the historical normal. This category includes 0.1% of the CCS in the eastern provinces. Category 3, similar, is coloured yellow and represents a change from -0.032 to 0.032 compared to the historical normal. This category includes 17.4% of the CCS in the eastern provinces. Category 4, lower, is coloured orange and represents a change from -0.088 to -0.032 compared to the historical normal. This category includes 70.4% of the CCS in the eastern provinces. Category 5, much lower, is coloured dark brown and represents a change less than -0.088 compared to the historical normal. This category includes 12.1% of the CCS in the eastern provinces.
Source: Agriculture Division, Crop Condition Assessment Program (CCAP), 2020.
Map produced by Remote Sensing and Geospatial Analysis, Agriculture Division, 2020.
Sources:
- Normalized Difference Vegetation Indices at 1 kilometre resolution by land use type for agricultural areas of Canada using 2016 geographic layers.
(values can be found in the Common Output Data Repository (CODR), table 32-10-0453-01) - MODIS imagery from National Aeronautics and Space Administration (NASA) using 250-metre spatial resolution.
- AVHRR imagery from National Oceanic and Atmospheric Administration (NOAA) using 1-kilometre spatial resolution.
- Date modified: