
The Visible Minority Population with a Disability in Canada: Employment and Education

Archived Content
Information identified as archived is provided for reference, research or recordkeeping purposes. It is not subject to the Government of Canada Web Standards and has not been altered or updated since it was archived. Please "contact us" to request a format other than those available.
Description: The Visible Minority Population with a Disability in Canada: Employment and Education
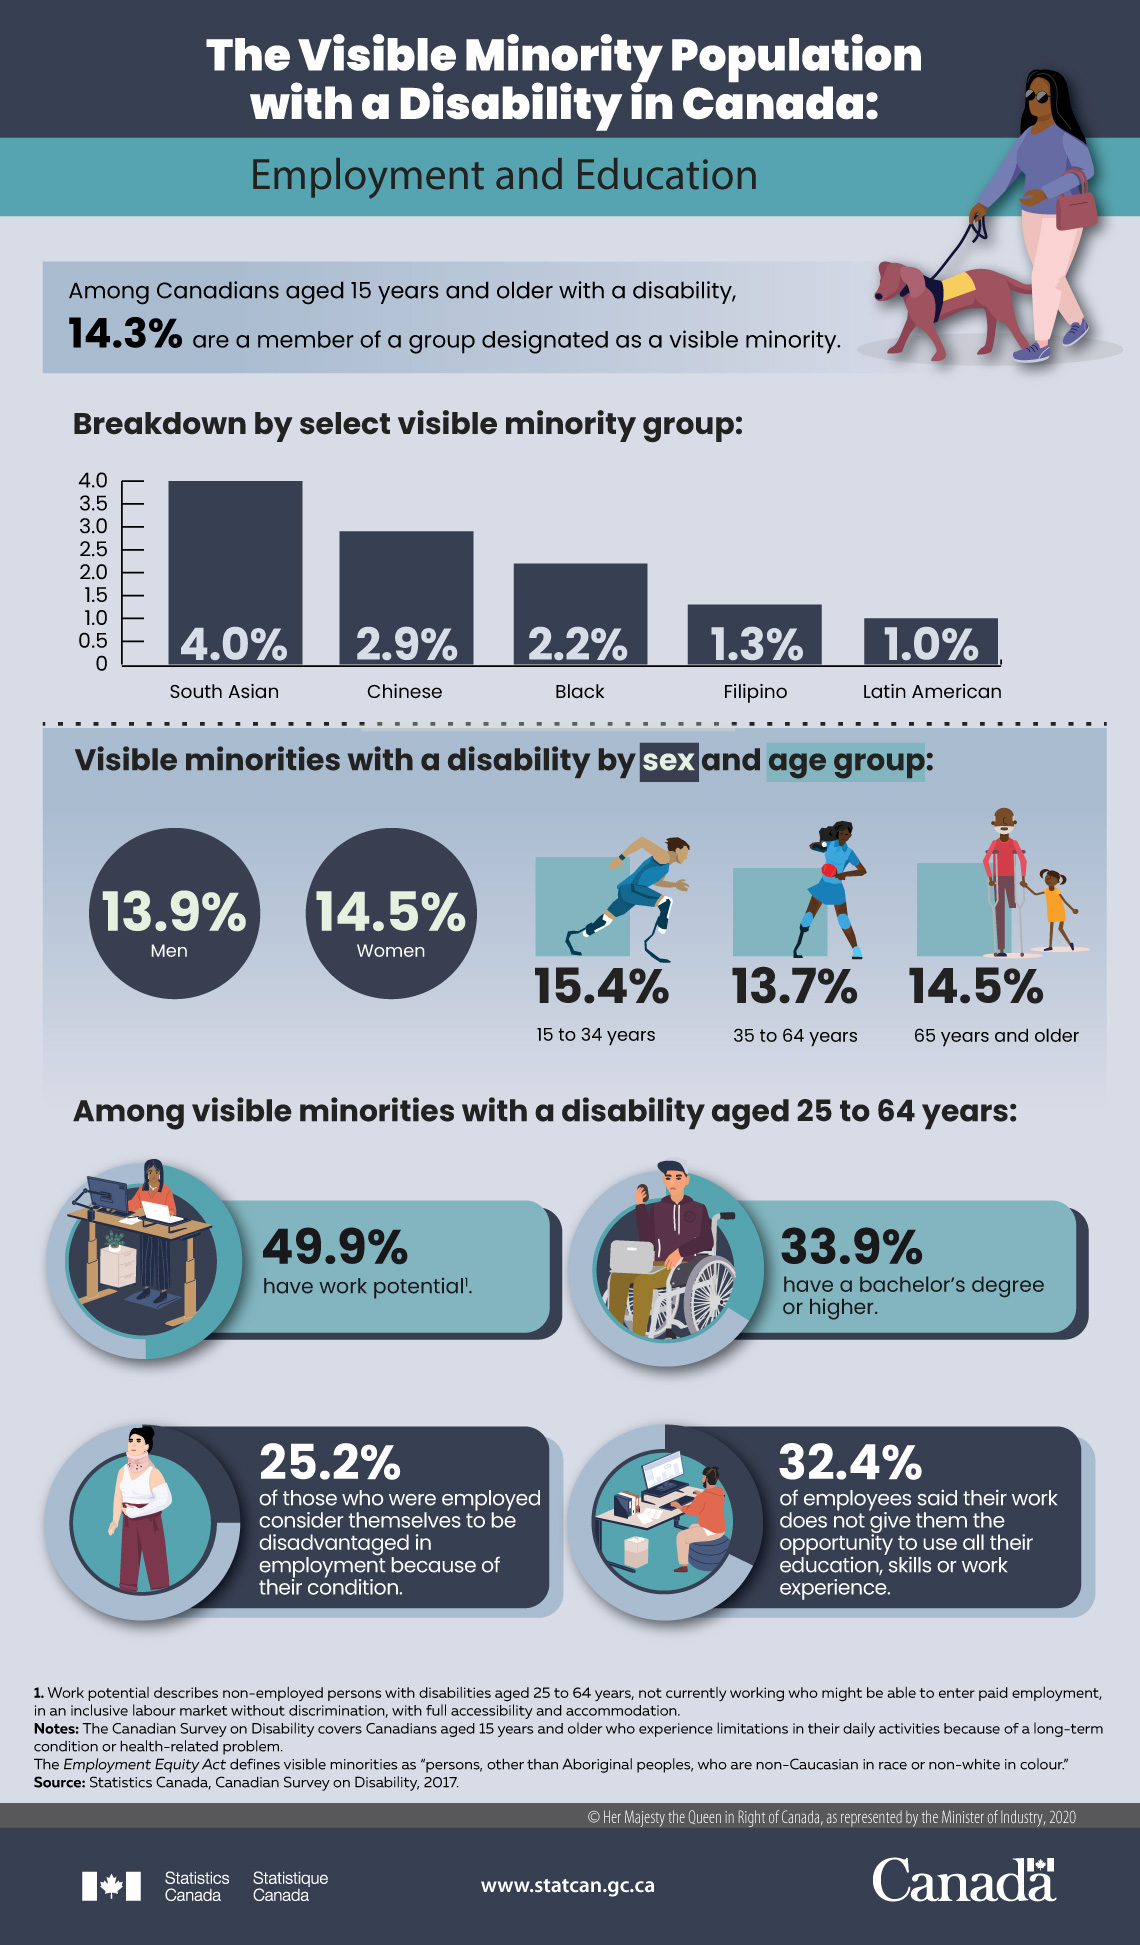
Among Canadians aged 15 years and older with a disability, 14.3% are a member of a group designated as a visible minority.
Breakdown by select visible minority group:
- South Asian = 4.0%
- Chinese = 2.9%
- Black = 2.2%
- Filipino = 1.3%
- Latin American = 1.0%
Visible minorities with a disability by sex and age group:
- Sex
- Men = 13.9%
- Women = 14.5%
- Age group
- 15 to 34 years = 15.4%
- 35 to 64 years = 13.7%
- 65 years and older = 14.5%
Among visible minorities with a disability aged 25 to 64 years:
- 49.9% have work potentialNote 1.
- 33.9% have a bachelor’s degree or higher.
- 25.2% of those who were employed consider themselves to be disadvantaged in employment because of their condition.
- 32.4% of employees said their work does not give them the opportunity to use all their education, skills or work experience.
Notes: The Canadian Survey on Disability covers Canadians aged 15 years and older who experience limitations in their daily activities because of a long-term condition or health-related problem.
The Employment Equity Act defines visible minorities as “persons, other than Aboriginal peoples, who are non-Caucasian in race or non-white in colour.”
Source: Statistics Canada, Canadian Survey on Disability, 2017.
- Date modified: