
A glance at robots in the Canadian economy, 1996 to 2017

Archived Content
Information identified as archived is provided for reference, research or recordkeeping purposes. It is not subject to the Government of Canada Web Standards and has not been altered or updated since it was archived. Please "contact us" to request a format other than those available.
Description: A glance at robots in the Canadian economy, 1996 to 2017
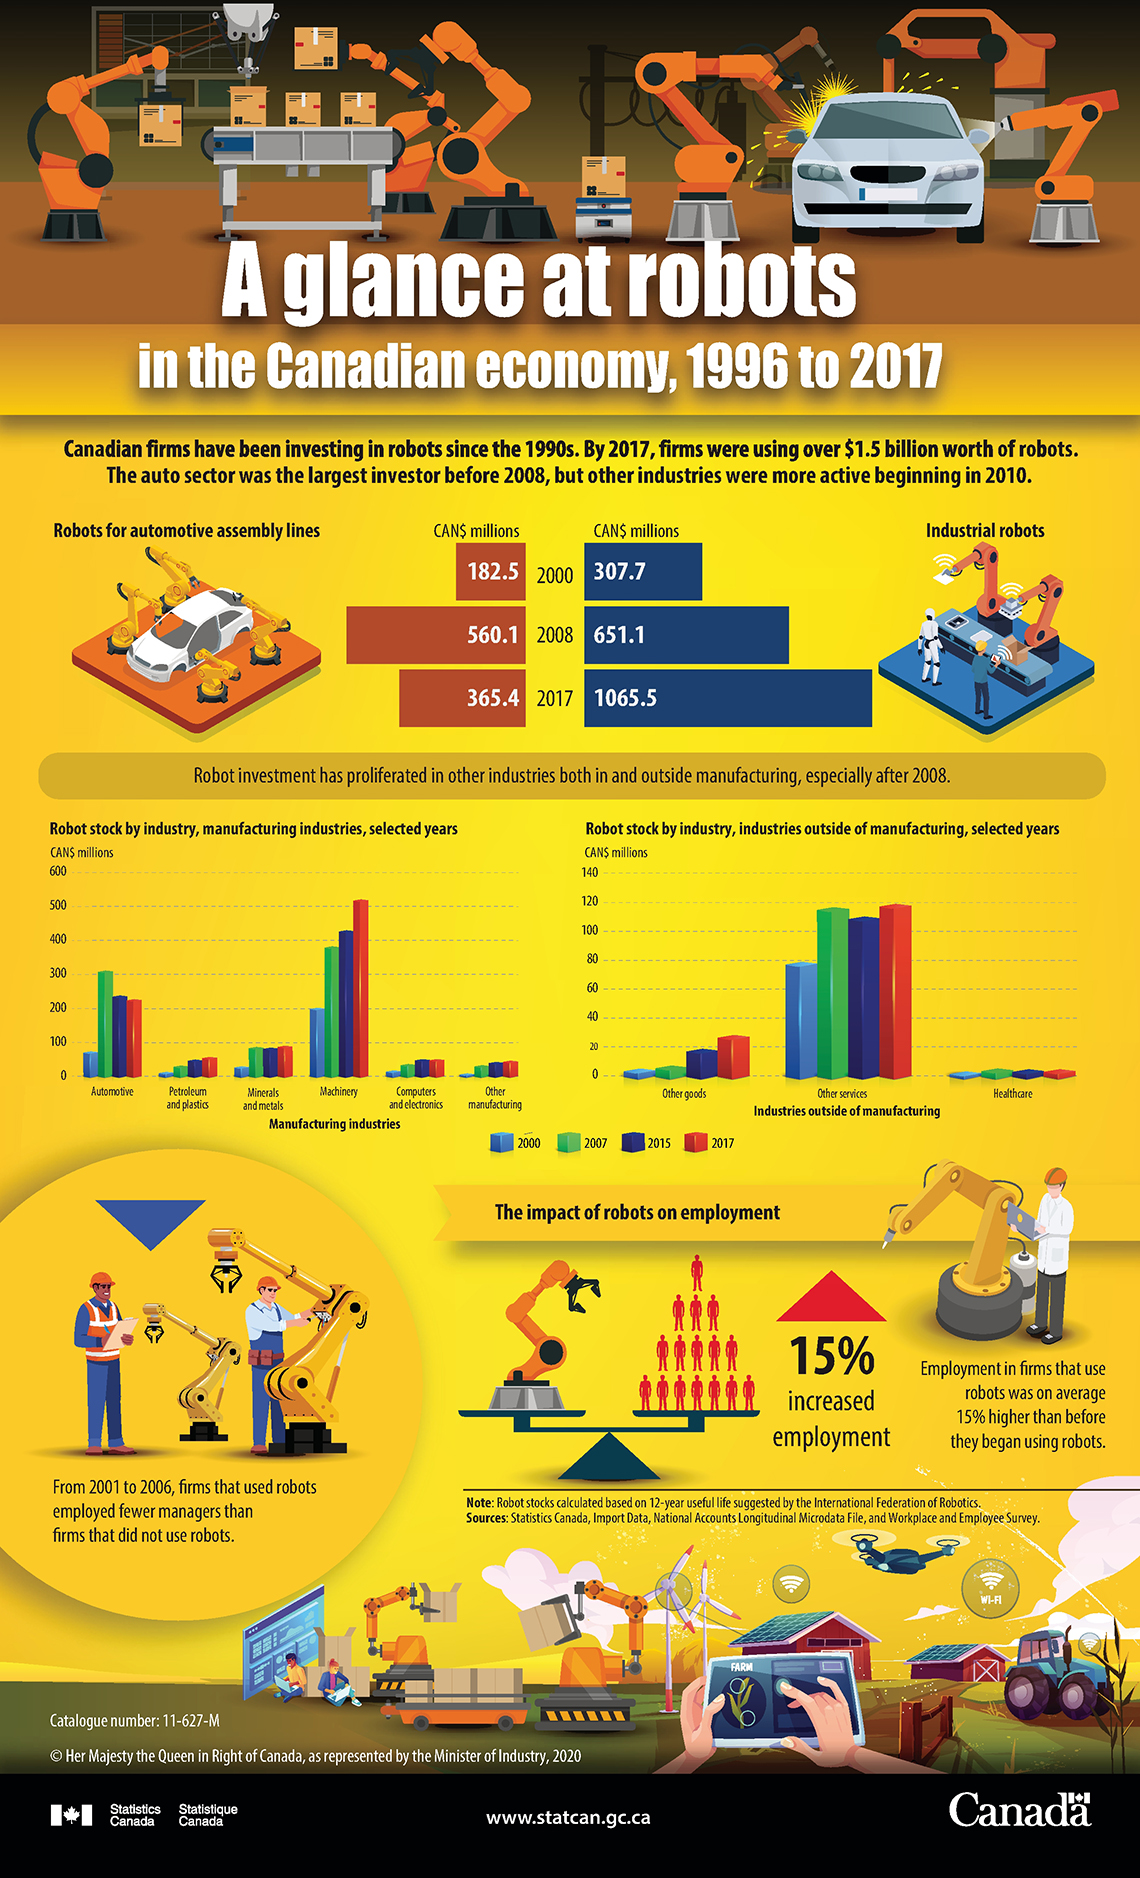
Canadian firms have been investing in robots since the 1990s. By 2017, firms were using over $1.5 billion worth of robots. The auto sector was the largest investor before 2008, but other industries were more active beginning in 2010.
| Robots for automotive assembly lines | Industrial robots | |
|---|---|---|
| CAN$ millions | ||
| 2000 | 182.5 | 307.7 |
| 2008 | 560.1 | 651.1 |
| 2017 | 365.4 | 1065.5 |
Robot investment has proliferated in other industries both in and outside manufacturing, especially after 2008.
| Automotive | Petroleum and plastics | Minerals and metals | Machinery | Computers and electronics | Other manufacturing | |
|---|---|---|---|---|---|---|
| CAN$ millions | ||||||
| 2000 | 70.8 | 11.4 | 25.5 | 197.7 | 13.9 | 6 |
| 2007 | 307.8 | 30.1 | 85 | 379.5 | 33 | 30 |
| 2015 | 235.4 | 46.6 | 81.8 | 426.7 | 47.3 | 39.4 |
| 2017 | 225.3 | 55.2 | 88 | 516.4 | 47.3 | 43.2 |
| Other goods | Other services | Healthcare | |
|---|---|---|---|
| CAN$ millions | |||
| 2000 | 2.7 | 77 | 0.9 |
| 2007 | 5.3 | 115.3 | 3.1 |
| 2015 | 16.5 | 108.4 | 2.6 |
| 2017 | 26.3 | 117.5 | 2.5 |
The impact of robots on employment
From 2001 to 2006, firms that used robots employed fewer managers than firms that did not use robots.
Employment in firms that use robots was on average 15% higher than before they began using robots.
Note: Robot stocks calculated based on 12-year useful life suggested by the International Federation of Robotics.
Sources: Statistics Canada, Import Data, National Accounts Longitudinal Microdata File, and Workplace and Employee Survey.
- Date modified: