
Homicide in Canada, 2019

Archived Content
Information identified as archived is provided for reference, research or recordkeeping purposes. It is not subject to the Government of Canada Web Standards and has not been altered or updated since it was archived. Please "contact us" to request a format other than those available.
Description: Homicide in Canada, 2019
Homicide in Canada, 2019
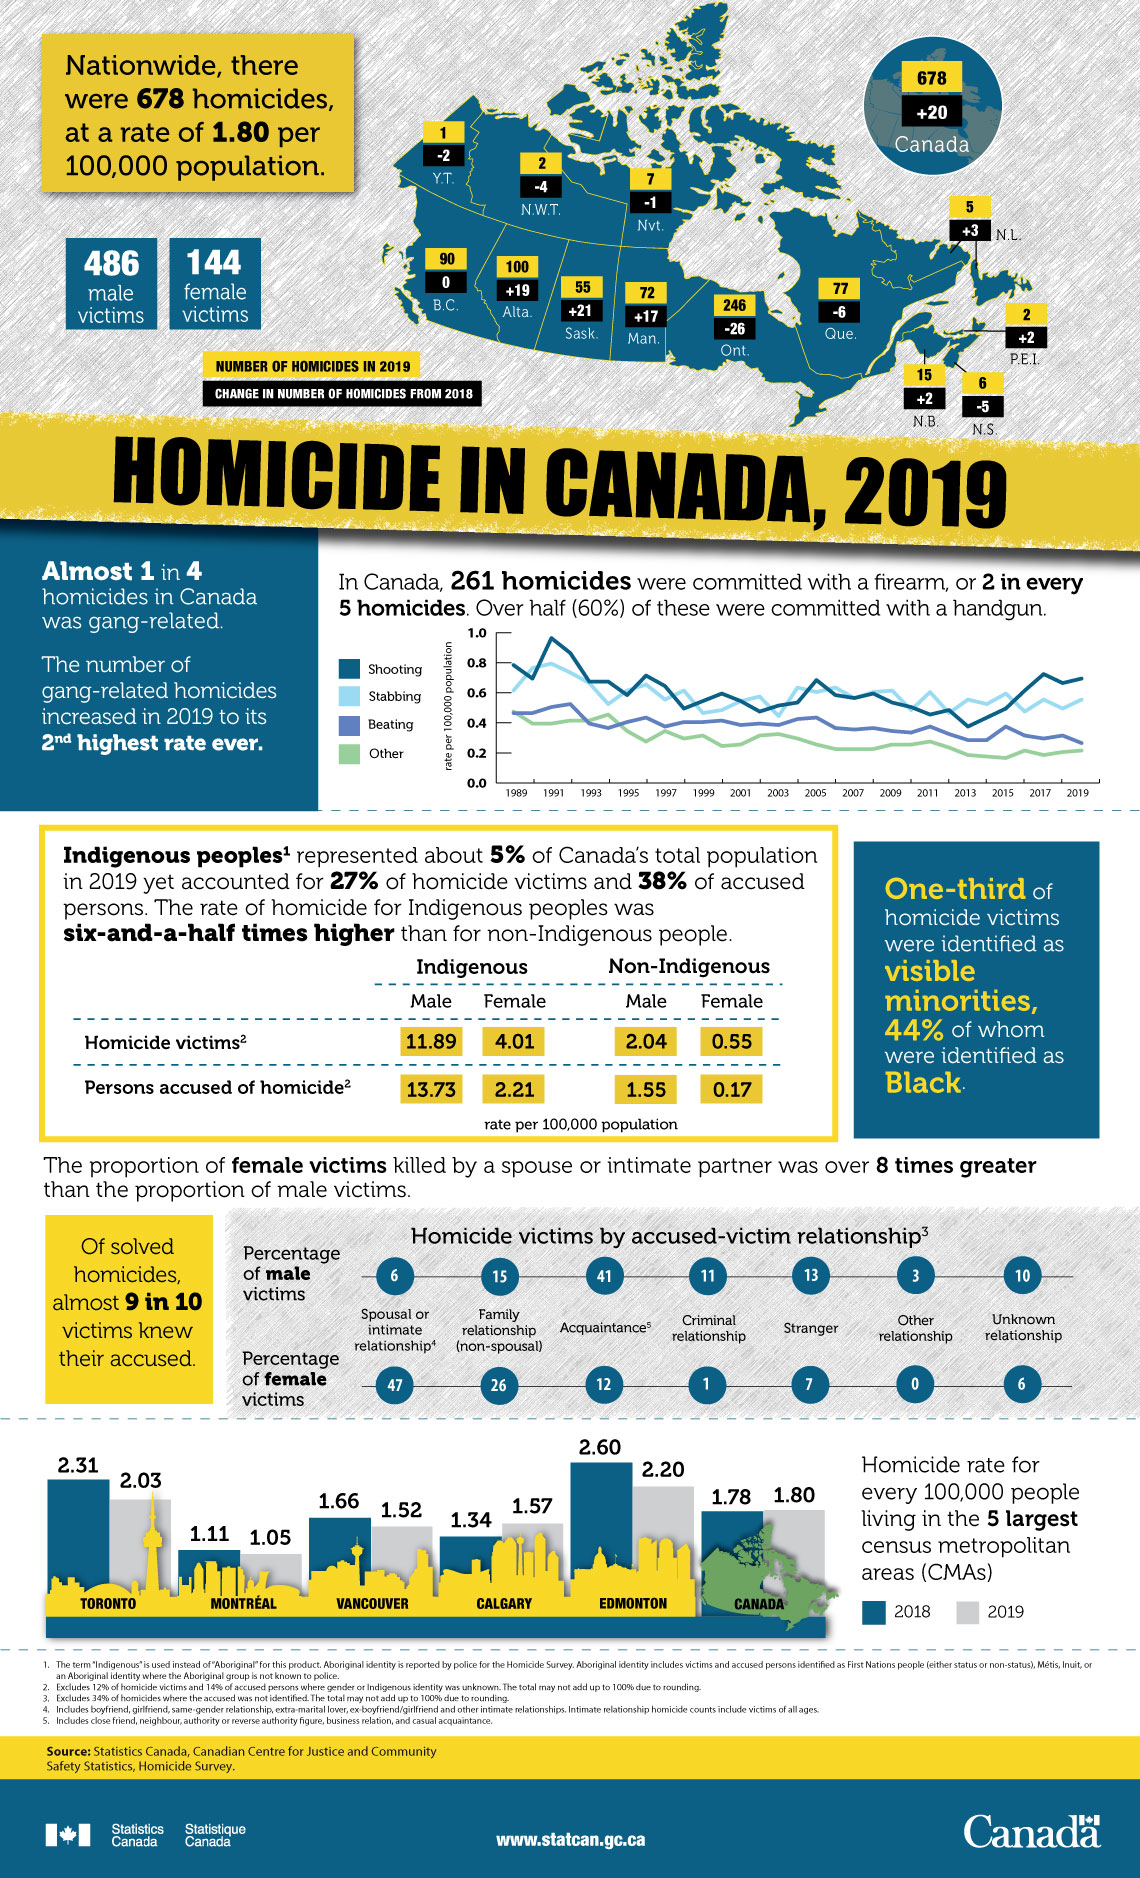
Nationwide, there were 678 homicides, at a rate of 1.80 per 100,000 population.
486 male victims
144 female victims
| Province or territory | Number of homicides in 2019 | Change in number of homicides from 2018 |
|---|---|---|
| Canada | 678 | +20 |
| Newfoundland and Labrador | 5 | +3 |
| Prince Edward Island | 2 | +2 |
| Nova Scotia | 6 | -5 |
| New Brunswick | 15 | +2 |
| Quebec | 77 | -6 |
| Ontario | 246 | -26 |
| Manitoba | 72 | +17 |
| Saskatchewan | 55 | +21 |
| Alberta | 100 | +19 |
| British Columbia | 90 | 0 |
| Yukon | 1 | -2 |
| Northwest Territories | 2 | -4 |
| Nunavut | 7 | -1 |
Almost 1 in 4 homicides in Canada was gang-related.
The number of gang-related homicides increased in 2019 to its 2nd highest rate ever.
In Canada, 261 homicides were committed with a firearm, or 2 in every 5 homicides. Over half (60%) of these were committed with a handgun.
| Year | Method of death | |||
|---|---|---|---|---|
| Shooting | Stabbing | Beating | Other | |
| rate per 100, 000 population | ||||
| 1989 | 0.79 | 0.62 | 0.47 | 0.48 |
| 1990 | 0.70 | 0.77 | 0.47 | 0.40 |
| 1991 | 0.97 | 0.80 | 0.51 | 0.40 |
| 1992 | 0.87 | 0.74 | 0.53 | 0.42 |
| 1993 | 0.68 | 0.67 | 0.40 | 0.42 |
| 1994 | 0.68 | 0.53 | 0.37 | 0.46 |
| 1995 | 0.59 | 0.62 | 0.41 | 0.35 |
| 1996 | 0.72 | 0.66 | 0.44 | 0.28 |
| 1997 | 0.65 | 0.56 | 0.38 | 0.35 |
| 1998 | 0.50 | 0.62 | 0.41 | 0.30 |
| 1999 | 0.55 | 0.47 | 0.41 | 0.32 |
| 2000 | 0.60 | 0.49 | 0.42 | 0.25 |
| 2001 | 0.55 | 0.55 | 0.39 | 0.26 |
| 2002 | 0.48 | 0.58 | 0.40 | 0.32 |
| 2003 | 0.52 | 0.45 | 0.39 | 0.33 |
| 2004 | 0.54 | 0.64 | 0.43 | 0.30 |
| 2005 | 0.69 | 0.61 | 0.44 | 0.26 |
| 2006 | 0.59 | 0.64 | 0.37 | 0.23 |
| 2007 | 0.57 | 0.57 | 0.36 | 0.23 |
| 2008 | 0.60 | 0.61 | 0.37 | 0.23 |
| 2009 | 0.54 | 0.62 | 0.35 | 0.26 |
| 2010 | 0.51 | 0.49 | 0.34 | 0.26 |
| 2011 | 0.46 | 0.61 | 0.38 | 0.28 |
| 2012 | 0.49 | 0.47 | 0.33 | 0.24 |
| 2013 | 0.38 | 0.56 | 0.29 | 0.19 |
| 2014 | 0.44 | 0.53 | 0.29 | 0.18 |
| 2015 | 0.50 | 0.60 | 0.38 | 0.17 |
| 2016 | 0.62 | 0.48 | 0.32 | 0.22 |
| 2017 | 0.73 | 0.56 | 0.30 | 0.19 |
| 2018 | 0.68 | 0.50 | 0.32 | 0.21 |
| 2019 | 0.70 | 0.57 | 0.27 | 0.22 |
Indigenous peoplesNote 1 represented about 5% of Canada’s total population in 2019 yet accounted for 27% of homicide victims and 38% of accused persons. The rate of homicide for Indigenous peoples was six-and-a-half times higher than for non-Indigenous people.
| Indigenous | Non-Indigenous | |||
|---|---|---|---|---|
| Male | Female | Male | Female | |
| rate per 100,000 population | ||||
| Homicide victimsTable 3 Note 2 | 11.89 | 4.01 | 2.04 | 0.55 |
| Persons accused of homicideTable 3 Note 2 | 13.73 | 2.21 | 1.55 | 0.17 |
|
||||
One-third of homicide victims were identified as visible minorities, 44% of whom were identified as Black.
Of solved homicides, almost 9 in 10 victims knew their accused.
The proportion of female victims killed by a spouse or intimate partner was 8 times greater than the proportion of male victims.
| Accused-victim relationship | Percentage of male victims | Percentage of female victims |
|---|---|---|
| Spousal or intimate relationshipHomicide victims Note 4 | 6 | 47 |
| Family relationship (non-spousal) | 15 | 26 |
| AcquaintanceHomicide victims Note 5 | 41 | 12 |
| Criminal relationship | 11 | 1 |
| Stranger | 13 | 7 |
| Other relationship | 3 | 0 |
| Unknown relationship | 10 | 6 |
|
||
Homicide rate for every 100,000 people living in the 5 largest census metropolitan areas (CMAs)
| Census metropolitan area | Rate per 100,000 population – 2018 | Rate per 100,000 population – 2019 |
|---|---|---|
| Toronto | 2.31 | 2.03 |
| Montréal | 1.11 | 1.05 |
| Vancouver | 1.66 | 1.52 |
| Calgary | 1.34 | 1.57 |
| Edmonton | 2.60 | 2.20 |
| Canada | 1.78 | 1.80 |
Source: Statistics Canada, Canadian Centre for Justice and Community Safety Statistics, Homicide Survey.
- Date modified: