
Agricultural employees, 2016 to 2018

Archived Content
Information identified as archived is provided for reference, research or recordkeeping purposes. It is not subject to the Government of Canada Web Standards and has not been altered or updated since it was archived. Please "contact us" to request a format other than those available.
Description: Agricultural employees, 2016 to 2018
Agricultural employees, 2016 to 2018
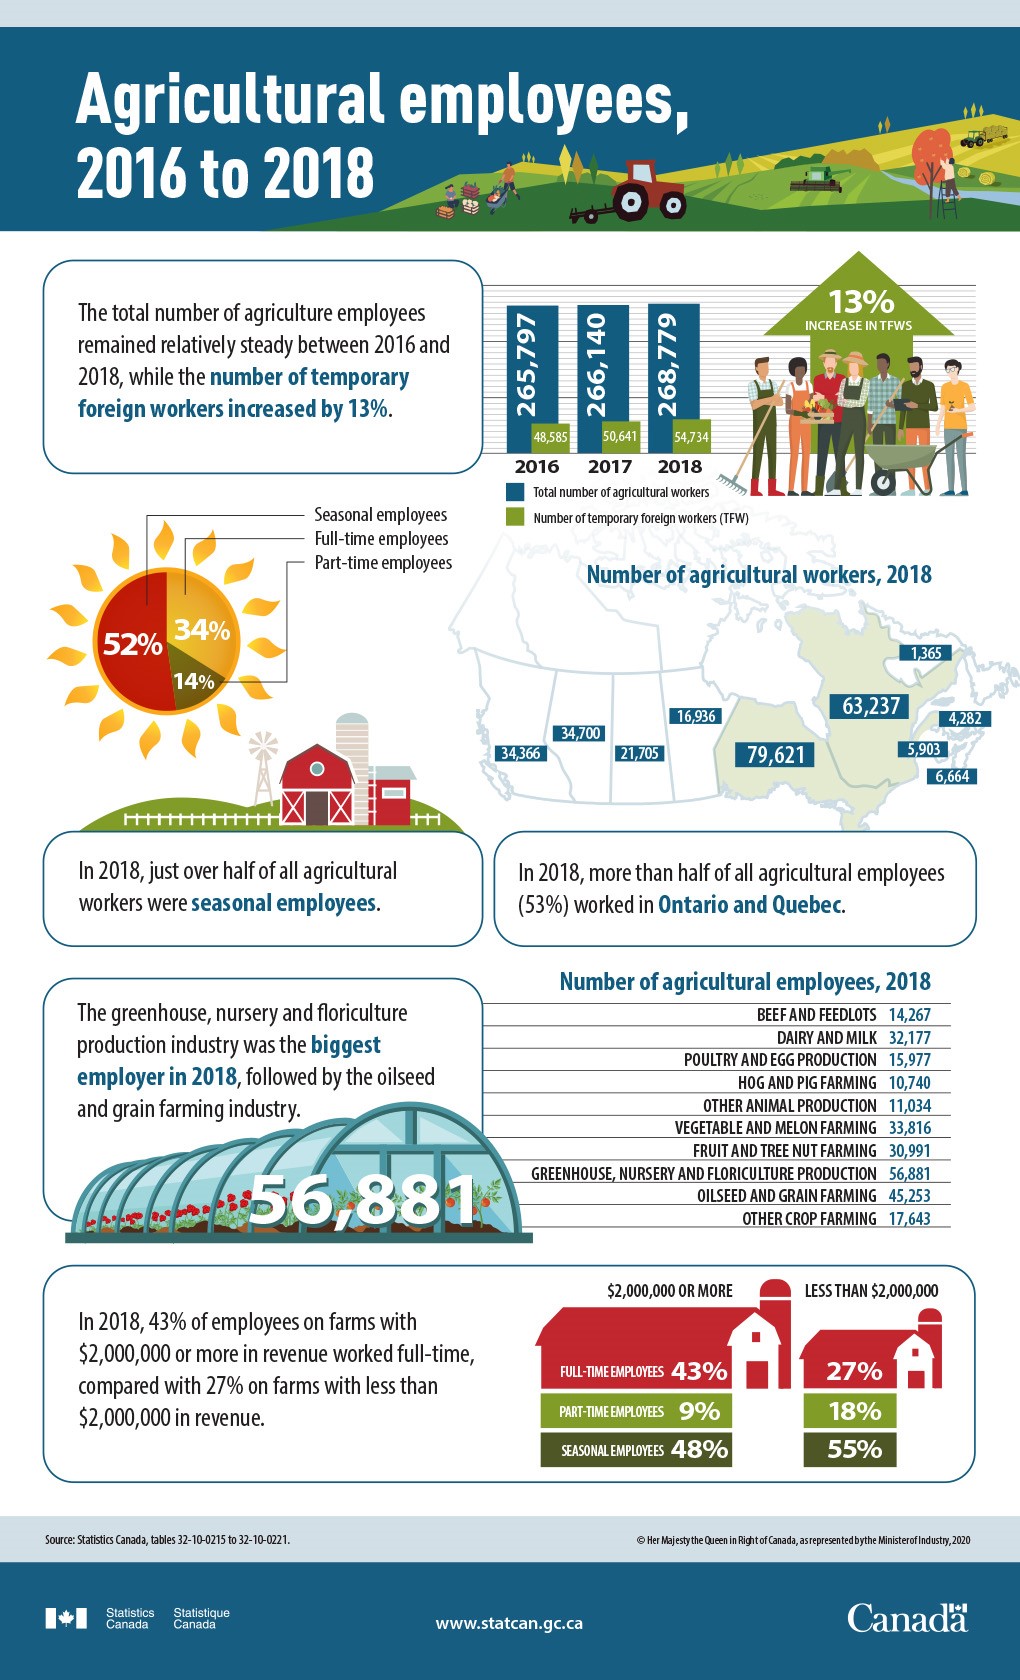
The total number of agriculture employees remained relatively steady between 2016 and 2018, while the number of temporary foreign workers increased by 13%.
| 2016 | 2017 | 2018 | |
|---|---|---|---|
| Total number of agricultural workers | 265,797 | 266,140 | 268,779 |
| Number of temporary foreign workers (TFW) | 48,585 | 50,641 | 54,734 |
In 2018, just over half of all agricultural workers were seasonal employees.
| Percent of total employees | |
|---|---|
| Full-time employees | 34% |
| Part-time employees | 14% |
| Seasonal employees | 52% |
In 2018, more than half of all agricultural employees (53%) worked in Ontario and Quebec.
| Number of agricultural workers, 2018 | |
|---|---|
| Newfoundland and Labrador | 1,365 |
| Prince Edward Island | 4,282 |
| Nova Scotia | 6,664 |
| New Brunswick | 5,903 |
| Quebec | 63,237 |
| Ontario | 79,621 |
| Manitoba | 16,936 |
| Saskatchewan | 21,705 |
| Alberta | 34,700 |
| British Columbia | 34,366 |
The greenhouse, nursery and floriculture production industry was the biggest employer in 2018, followed by the oilseed and grain farming industry.
| Number of agricultural employees, 2018 | |
|---|---|
| Beef and feedlots | 14,267 |
| Dairy and milk | 32,177 |
| Poultry and egg production | 15,977 |
| Hog and pig farming | 10,740 |
| Other animal production | 11,034 |
| Vegetable and melon farming | 33,816 |
| Fruit and tree nut farming | 30,991 |
| Greenhouse, nursery and floriculture production | 56,881 |
| Oilseed and grain farming | 45,253 |
| Other crop farming | 17,643 |
In 2018, 43% of employees on farms with $2,000,000 or more in revenue worked full-time, compared with 27% on farms with less than $2,000,000 in revenue.
| Full-time employees | Part-time employees | Seasonal employees | |
|---|---|---|---|
| Less than $2,000,000 | 27% | 18% | 55% |
| $2,000,000 or more | 43% | 9% | 48% |
Source: Statistics Canada, tables 32-10-0215 to 32-10-0221.
- Date modified: