
Then and now: Participation rates in college and university studies of 18- to 24-year-olds

Archived Content
Information identified as archived is provided for reference, research or recordkeeping purposes. It is not subject to the Government of Canada Web Standards and has not been altered or updated since it was archived. Please "contact us" to request a format other than those available.
Description: Then and now: Participation rates in college and university studies of 18- to 24-year-olds
Then and now: Participation rates in college and university studies of 18- to 24-year-olds
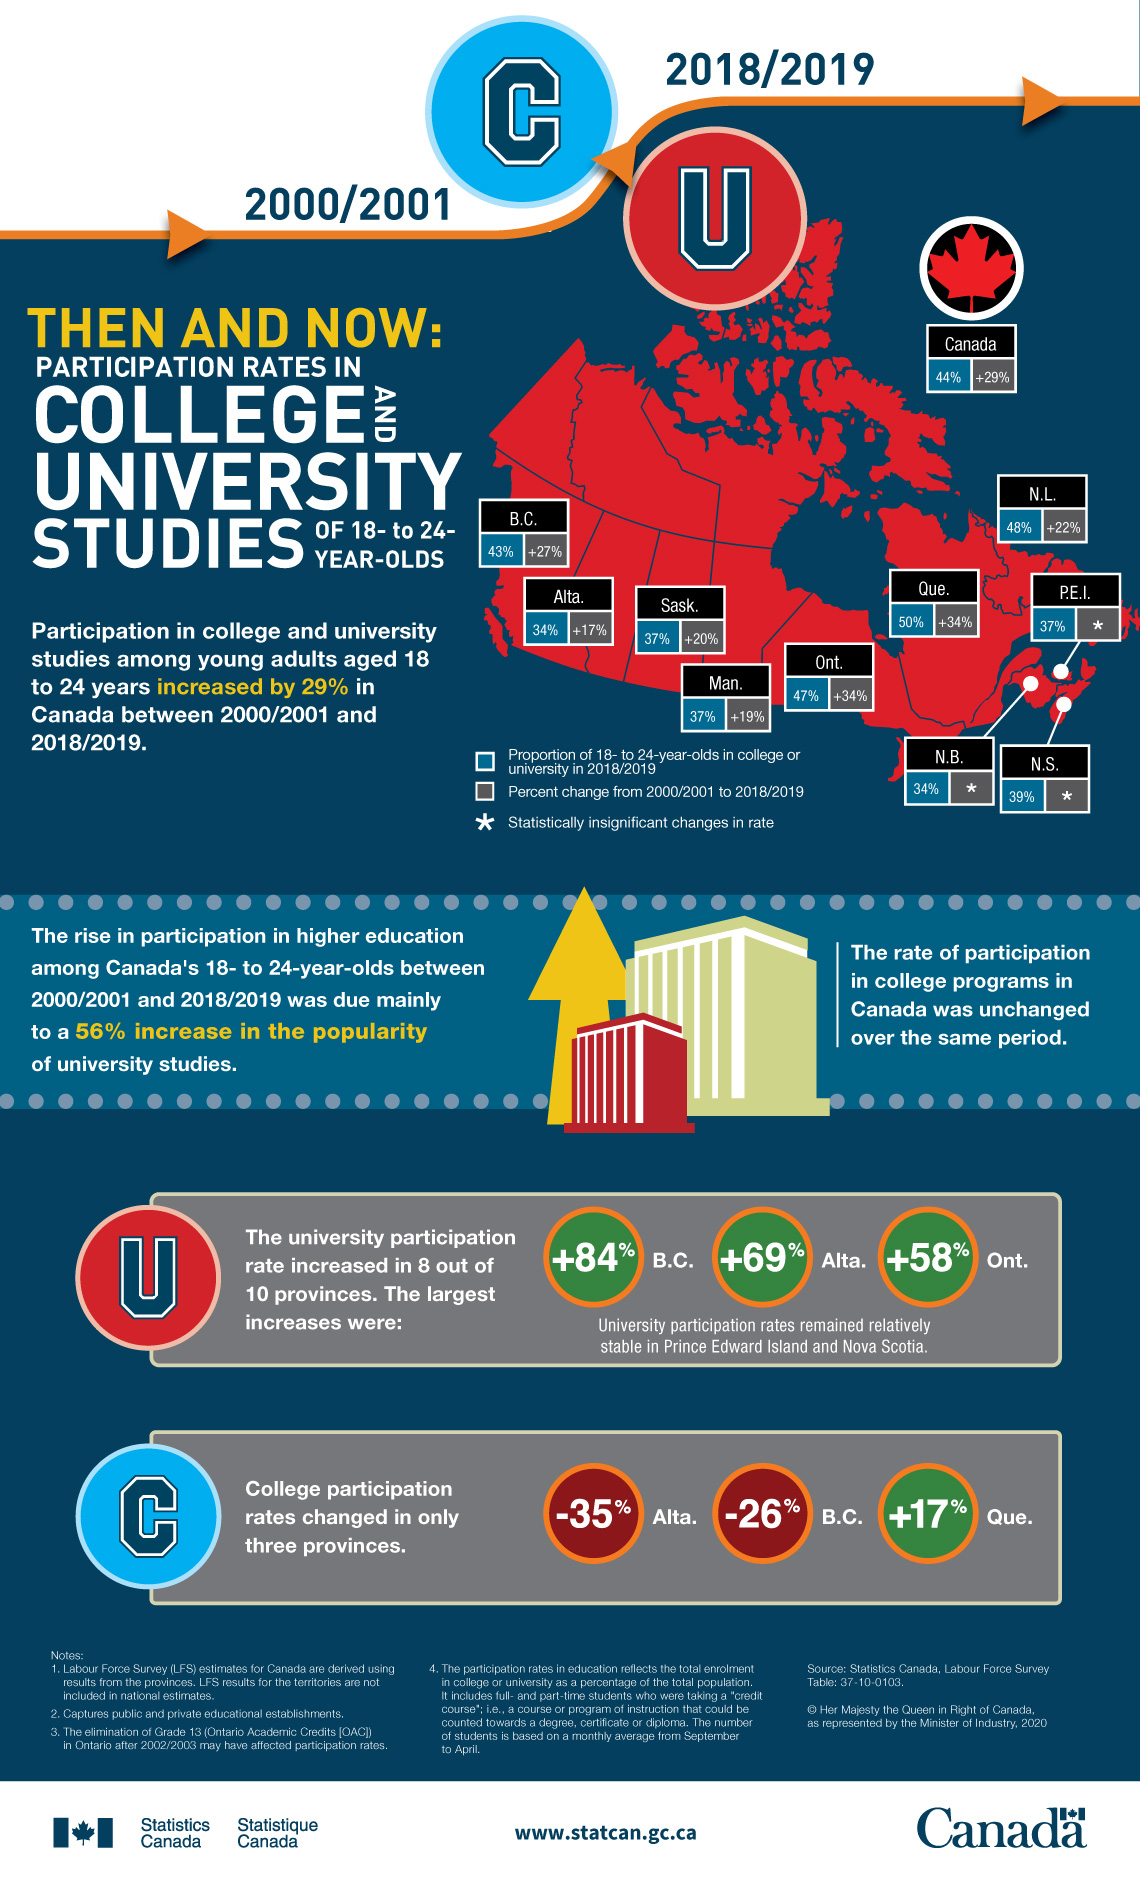
Participation in college and university studies among young adults aged 18 to 24 years increased by 29% in Canada between 2000/2001 and 2018/2019.
| Geography | Proportion of 18- to 24-years-olds in college or university in 2018/2019 | Percent change from 2000/2001 to 2018/2019 |
|---|---|---|
| Canada | 44% | +29% |
| Newfoundland and Labrador | 48% | +22% |
| Prince Edward Island | 37% | Table 1 Note † |
| Nova Scotia | 39% | Table 1 Note † |
| New Brunswick | 34% | Table 1 Note † |
| Quebec | 50% | +34% |
| Ontario | 47% | +34% |
| Manitoba | 37% | +19% |
| Saskatchewan | 37% | +20% |
| Alberta | 34% | +17% |
| British Columbia | 43% | +27% |
|
||
The rise in participation in higher education among Canada’s 18- to 24-year-olds between 2000/2001 and 2018/2019 was due mainly to a 56 % increase in the popularity of university studies.
The rate of participation in college programs in Canada was unchanged over the same period.
The university participation rate increased in 8 out of 10 provinces. The largest increases were:
- British Columbia (+84%)
- Alberta (+69%)
- Ontario (+58%)
University participation rates remained relatively stable in Prince Edward Island and Nova Scotia
College participation rates changed in only three provinces.
- Alberta (-35%)
- British Columbia (-26%)
- Quebec (+17%)
Notes:
- Labour Force Survey (LFS) estimates for Canada are derived using results from the provinces. LFS results for the territories are not included in national estimates.
- Captures public and private educational establishments.
- The elimination of Grade 13 (Ontario Academic Credits [OAC]) in Ontario after 2002/2003 may have affected participation rates.
- The participation rates in education reflect the total enrolment in college or university as a percentage of the total population. It includes full- and part-time students who were taking a "credit course"; i.e., a course or program of instruction that could be counted towards a degree, certificate or diploma. The number of students is based on a monthly average from September to April.
Source: Statistics Canada, Labour Force Survey
Table 37-10-0103
- Date modified: