
How Far Have We Come? Representation of women among full-time university faculty

Archived Content
Information identified as archived is provided for reference, research or recordkeeping purposes. It is not subject to the Government of Canada Web Standards and has not been altered or updated since it was archived. Please "contact us" to request a format other than those available.
Description: How Far Have We Come? Representation of women among full-time university faculty
How Far Have We Come? Representation of women among full-time university faculty
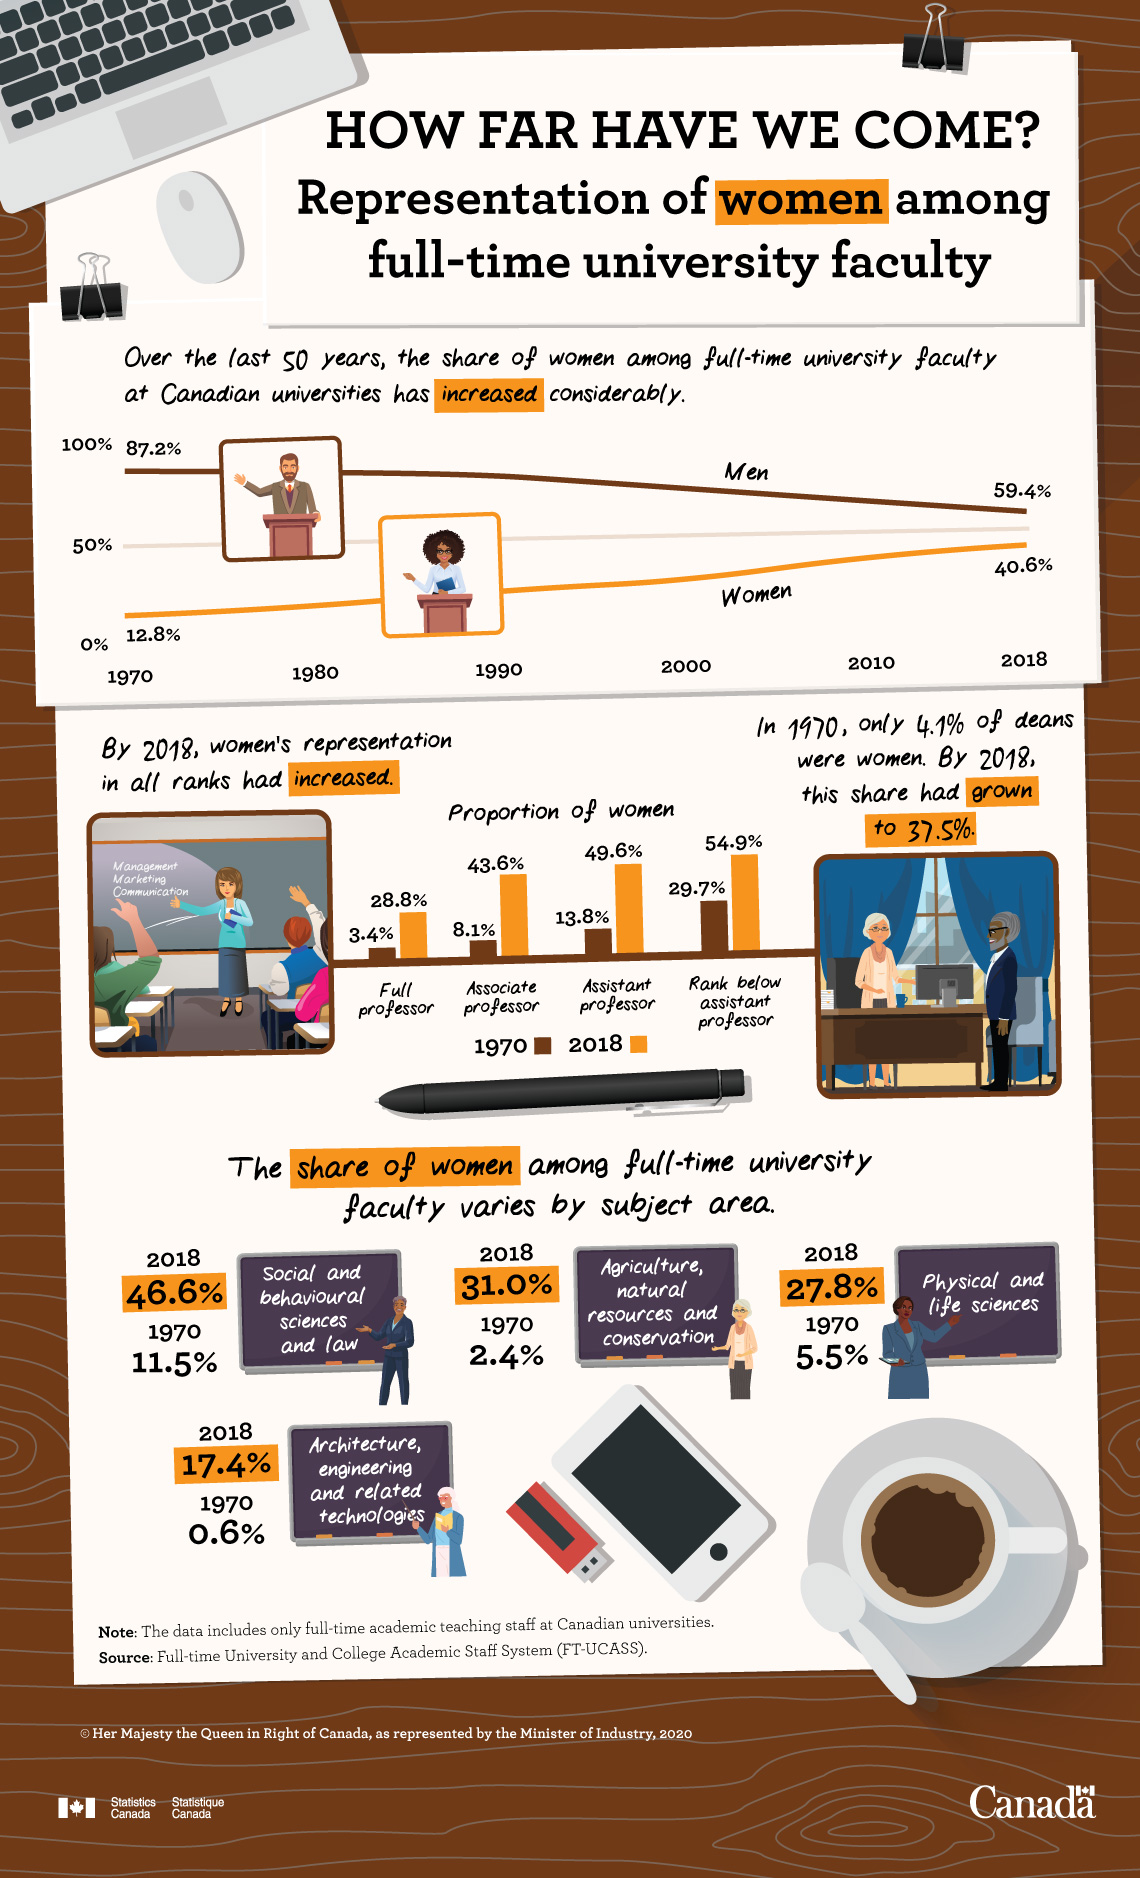
Over the last 50 years, the share of women among full-time university faculty at Canadian universities has increased considerably.
This line graph depicts the increased proportion of women compared to men among full-time university faculty at Canadian universities from 1970 to 2018. The data line is shown in 10 year increments and includes 1970, 1980, 1990, 2000, 2010, and 2018 with percentage points shown for 1970 and 2018 only.
This table displays the results of the line graph depicting percentage points by Gender for 1970 and 2018.
| Gender | 1970 | 2018 |
|---|---|---|
| Men | 87.2% | 59.4% |
| Women | 12.8% | 40.6% |
By 2018, women’s representation in all ranks had increased.
This table displays the results of the bar graph of the proportion of women in percentage points by Rank for 1970 and 2018.
| Rank | 1970 | 2018 |
|---|---|---|
| Full professor | 3.4% | 28.8% |
| Associate professor | 8.1% | 43.6% |
| Assistant professor | 13.8% | 49.6% |
| Rank below assistant professor | 29.7% | 54.9% |
In 1970, only 4.1% of deans were women. By 2018, this share had grown to 37.5%.
The share of women among full-time university faculty varies by subject area.
This table displays the percentage of women among university faculty by subject area grouping for 1970 and 2018.
| Subject Area | 1970 | 2018 |
|---|---|---|
| Social and behavioural sciences and law | 11.5% | 46.6% |
| Agriculture, natural resources and conservation | 2.4% | 31.0% |
| Physical and life sciences | 5.5% | 27.8% |
| Architecture, engineering and related technologies | 0.6% | 17.4% |
Note: The data includes only full-time academic teaching staff at Canadian universities.
Source: Full-time University and College Academic Staff System (FT-UCASS).
- Date modified: