
Police-reported hate crime in Canada, 2018

Archived Content
Information identified as archived is provided for reference, research or recordkeeping purposes. It is not subject to the Government of Canada Web Standards and has not been altered or updated since it was archived. Please "contact us" to request a format other than those available.
Description: Police-reported hate crime in Canada, 2018
Police-reported hate crime in Canada, 2018
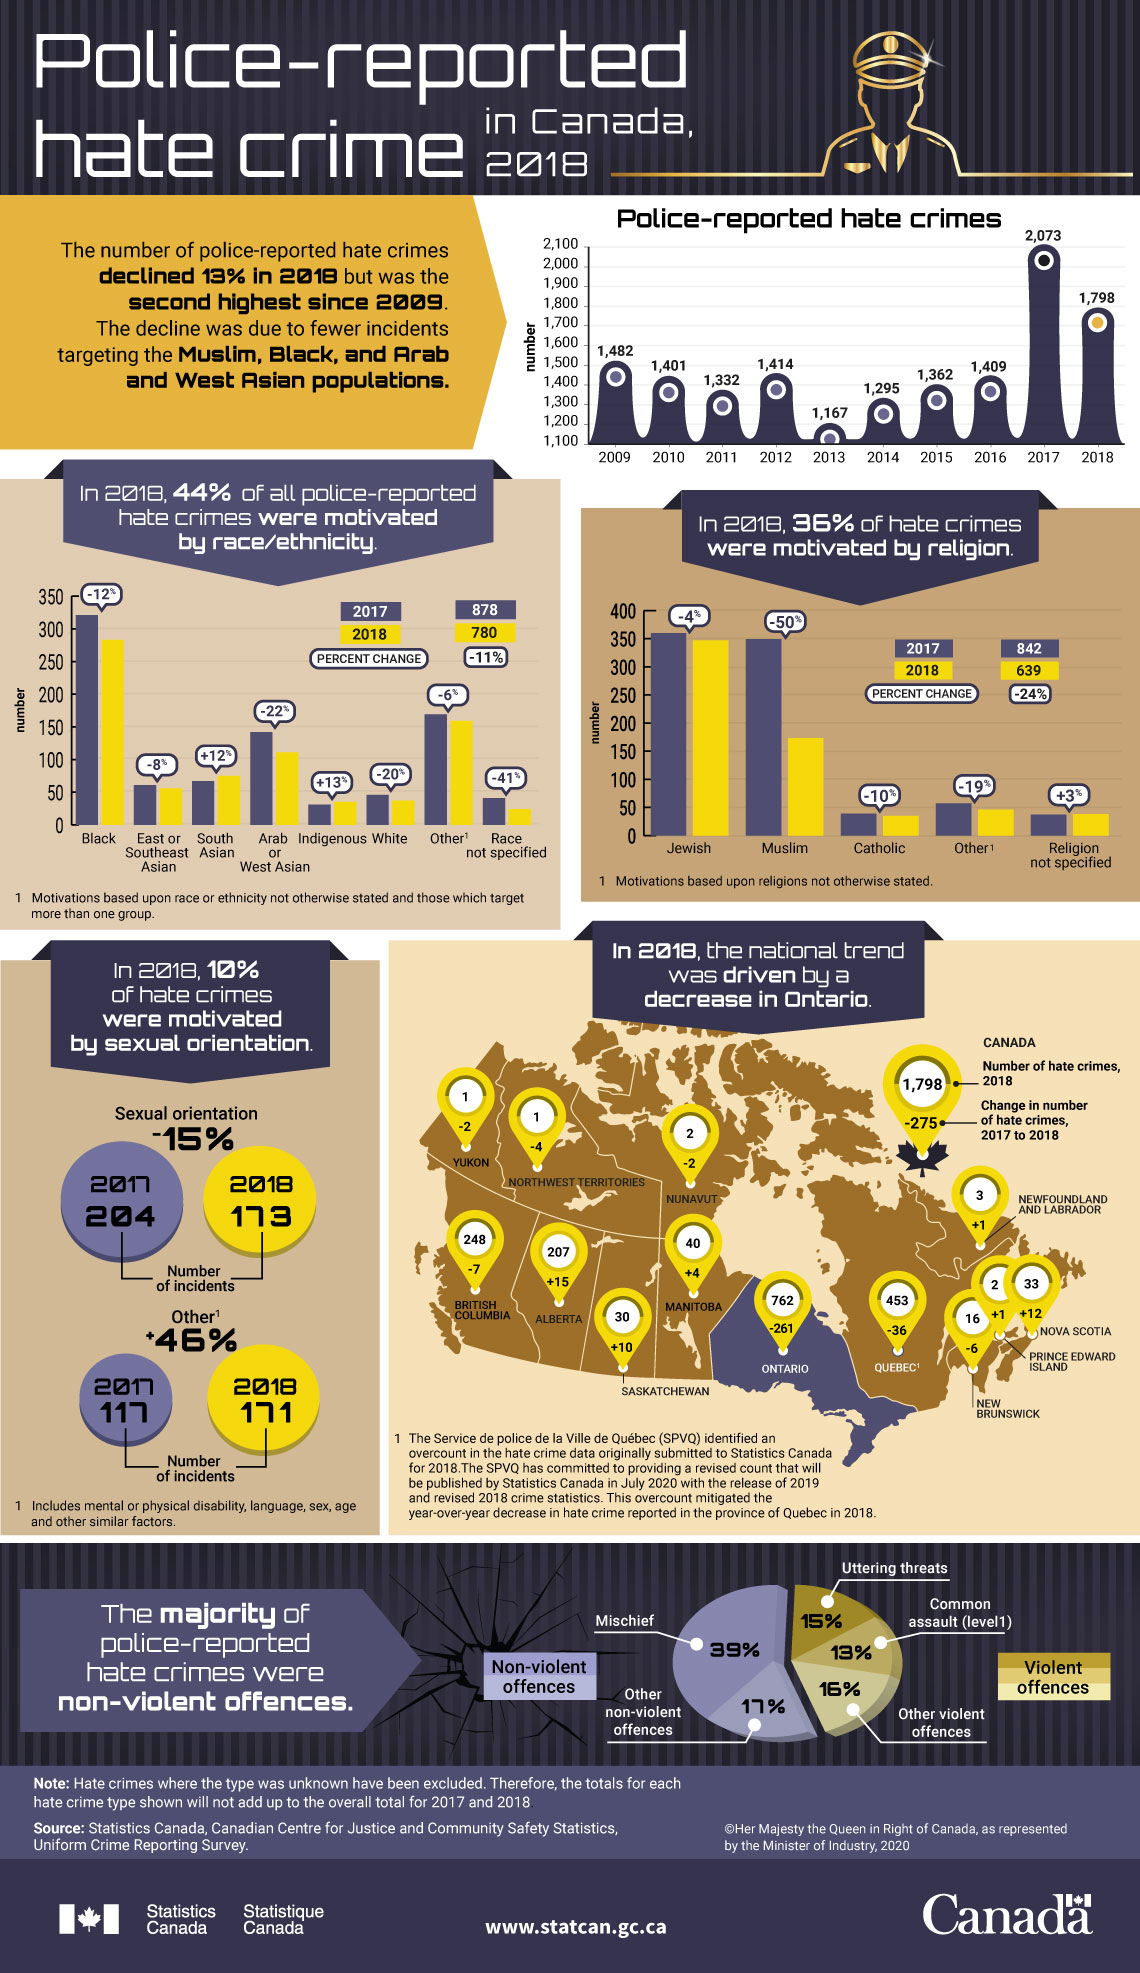
The number of police-reported hate crimes declined 13% in 2018 but was the second highest since 2009. The decline was due to fewer incidents targeting the Muslim, Black, and Arab and West Asian populations.
| Police-reported hate crimes | |
|---|---|
| Year | Number |
| 2009 | 1,482 |
| 2010 | 1,401 |
| 2011 | 1,332 |
| 2012 | 1,414 |
| 2013 | 1,167 |
| 2014 | 1,295 |
| 2015 | 1,362 |
| 2016 | 1,409 |
| 2017 | 2,073 |
| 2018 | 1,798 |
In 2018, 44% of all police-reported hate crimes were motivated by race/ethnicity.
| Race/ethnicity | 2017 | 2018 | Percent change |
|---|---|---|---|
| number | |||
| Black | 321 | 283 | -12 |
| East or Southeast Asian | 61 | 56 | -8 |
| South Asian | 67 | 75 | 12 |
| Arab or West Asian | 142 | 111 | -22 |
| Indigenous | 31 | 35 | 13 |
| White | 46 | 37 | -20 |
| OtherPolice-reported hate Note 1 | 169 | 159 | -6 |
| Race not specified | 41 | 24 | -41 |
| Total | 878 | 780 | -11 |
|
|||
In 2018, 36% of hate crimes were motivated by religion.
| Religion | 2017 | 2018 | Percent change |
|---|---|---|---|
| number | |||
| Jewish | 360 | 347 | -4 |
| Muslim | 349 | 173 | -50 |
| Catholic | 39 | 35 | -10 |
| OtherPolice-reported hate Note 1 | 57 | 46 | -19 |
| Religion not specified | 37 | 38 | 3 |
| Total | 842 | 639 | -24 |
|
|||
In 2018, 10% of hate crimes were motivated by sexual orientation.
| Motivation | 2017 | 2018 | Percent change |
|---|---|---|---|
| number | |||
| Sexual orientation | 204 | 173 | -15 |
| OtherPolice-reported hate Note 1 | 117 | 171 | 46 |
|
|||
In 2018, the national trend was driven by a decrease in Ontario.
| Province or territory | Number of hate crimes, 2018 | Change in number of hate crimes, 2017 to 2018 |
|---|---|---|
| Canada | 1,798 | -275 |
| Newfoundland and Labrador | 3 | +1 |
| Prince Edward Island | 2 | +1 |
| Nova Scotia | 33 | +12 |
| New Brunswick | 16 | -6 |
| QuebecNumber of Note 1 | 453 | -36 |
| Ontario | 762 | -261 |
| Manitoba | 40 | +4 |
| Saskatchewan | 30 | +10 |
| Alberta | 207 | +15 |
| British Columbia | 248 | -7 |
| Yukon | 1 | -2 |
| Northwest Territories | 1 | -4 |
| Nunavut | 2 | -2 |
|
||
The majority of police-reported hate crimes were non-violent offences.
| Type of crime | Percent |
|---|---|
| Non-violent | 57 |
| Mischief | 39 |
| Other non-violent offences | 17 |
| Violent | 43 |
| Uttering threats | 15 |
| Common assault (level 1) | 13 |
| Other violent offences | 16 |
Note: Hate crimes where the type was unknown have been excluded. Therefore, the totals for each hate crime type shown will not add up to the overall total for 2017 and 2018.
Source: Statistics Canada, Canadian Centre for Justice and Community Safety Statistics, Uniform Crime Reporting Survey.
- Date modified: