
National Cannabis Survey 2nd quarter, 2019

Archived Content
Information identified as archived is provided for reference, research or recordkeeping purposes. It is not subject to the Government of Canada Web Standards and has not been altered or updated since it was archived. Please "contact us" to request a format other than those available.
Description: National Cannabis Survey 2nd quarter, 2019
National Cannabis Survey 2nd quarter, 2019
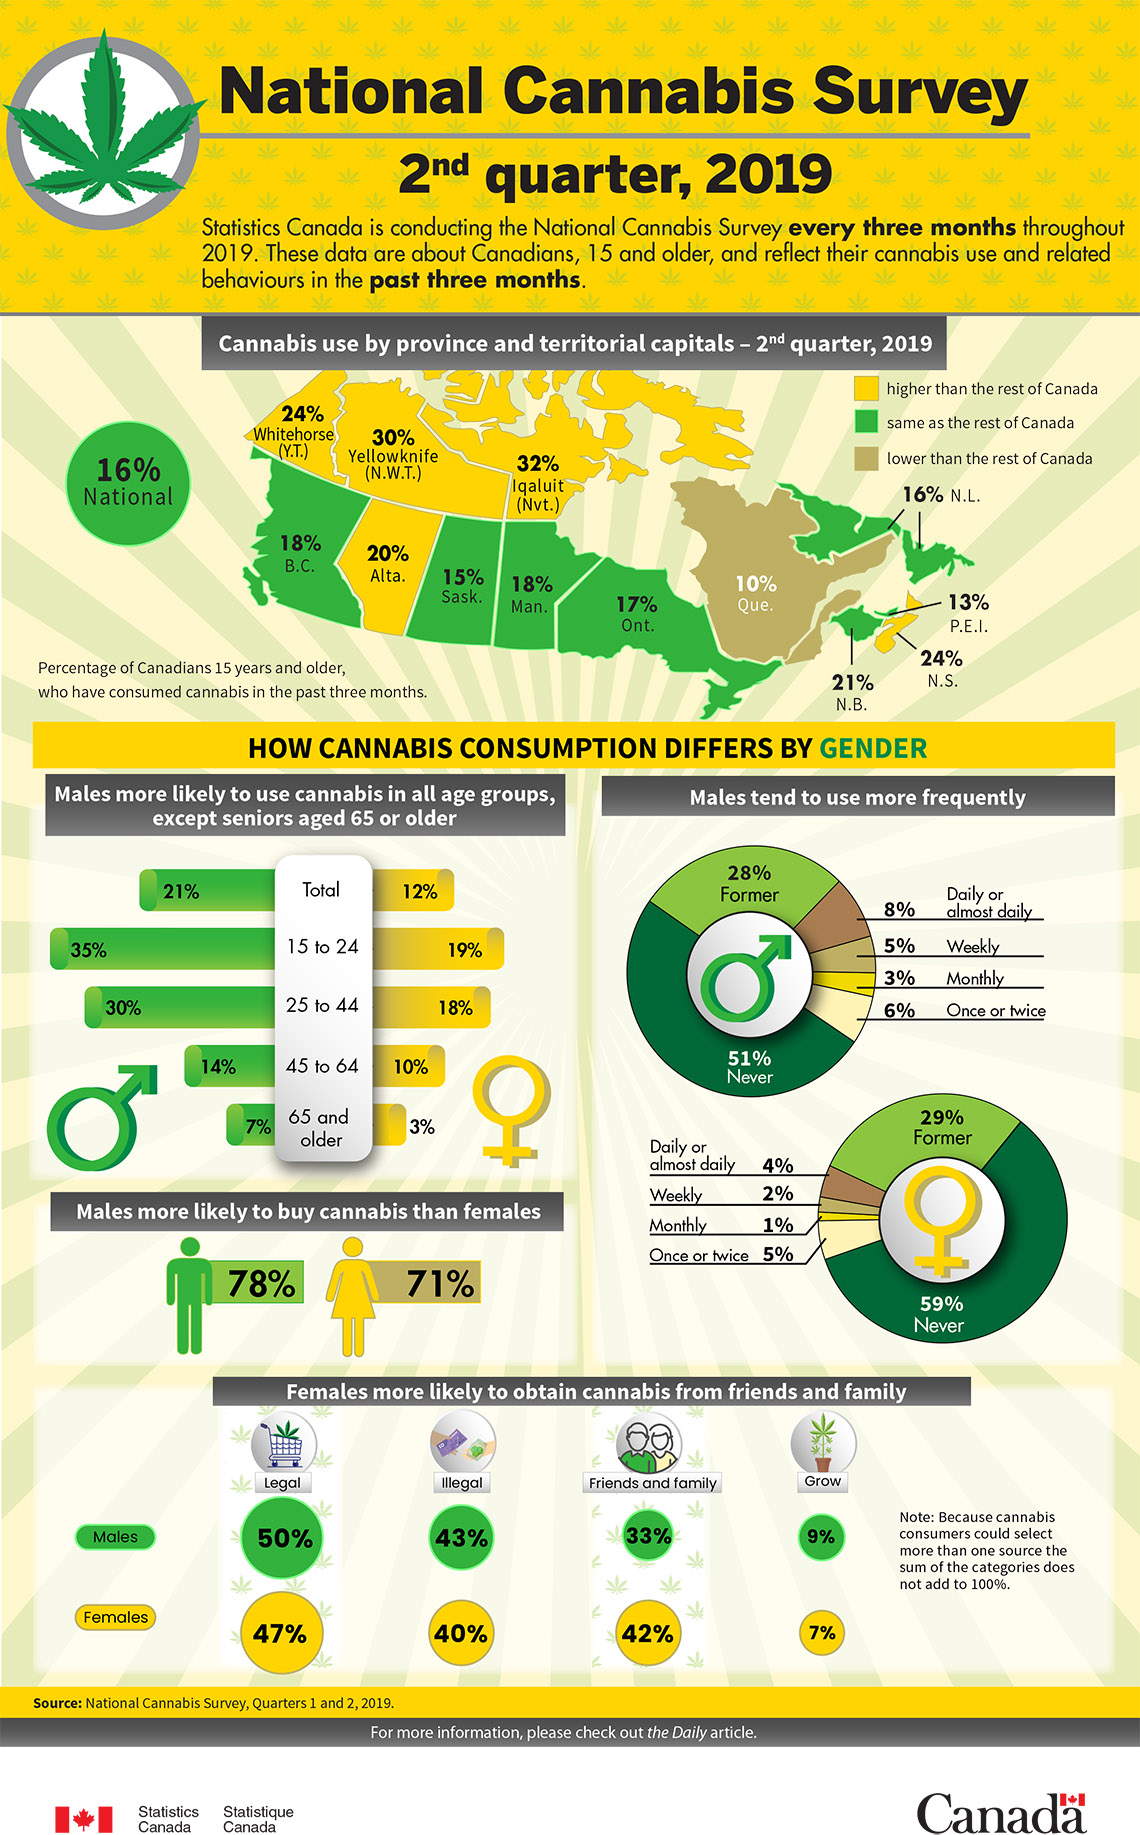
Statistics Canada is conducting the National Cannabis Survey every three months throughout 2019. These data are about Canadians, 15 and older, and reflect their cannabis use and related behaviours in the past three months.
| Geographic region | Percentage of CanadiansFootnote 1 |
|---|---|
| National | 16 |
| Newfoundland and Labrador | 16 |
| Prince Edward Island | 13 |
| Nova Scotia | 24 |
| New Brunswick | 21 |
| Quebec | 10 |
| Ontario | 17 |
| Manitoba | 18 |
| Saskatchewan | 15 |
| Alberta | 20 |
| British Colombia | 18 |
| Whitehorse (Yukon) | 24 |
| Yellowknife (Northwest Territories) | 30 |
| Iqaluit (Nunavut) | 32 |
|
|
How cannabis consumption differs by gender
| Age | Percentage of males | Percentage of females |
|---|---|---|
| Total | 21 | 12 |
| 15 to 24 | 35 | 19 |
| 25 to 44 | 30 | 18 |
| 45 to 64 | 14 | 10 |
| 65 and older | 7 | 3 |
| Frequency | Percentage of males | Percentage of females |
|---|---|---|
| Never | 51 | 59 |
| Former | 28 | 29 |
| Once or twice | 6 | 5 |
| Monthly | 3 | 1 |
| Weekly | 5 | 2 |
| Daily or almost daily | 8 | 4 |
Males more likely to buy cannabis than females
78% of male cannabis users spent money on cannabis.
71% of female cannabis users spent money on cannabis.
| Source | Percentage of male users | Percentage of female users |
|---|---|---|
| Legal | 50 | 47 |
| Illegal | 43 | 40 |
| Friends and family | 33 | 42 |
| Grow | 9 | 7 |
Note: Because cannabis consumers could select more than one source the sum of the categories do not add to 100%.
Source: National Cannabis Survey, Quarters 1 and 2, 2019.
For more information, please check out The Daily article.
- Date modified: