
Family matters: Being separated or divorced and aged 55 or older

Archived Content
Information identified as archived is provided for reference, research or recordkeeping purposes. It is not subject to the Government of Canada Web Standards and has not been altered or updated since it was archived. Please "contact us" to request a format other than those available.
Release date: June 12, 2019
Description: Family matters: Being separated or divorced and aged 55 or older
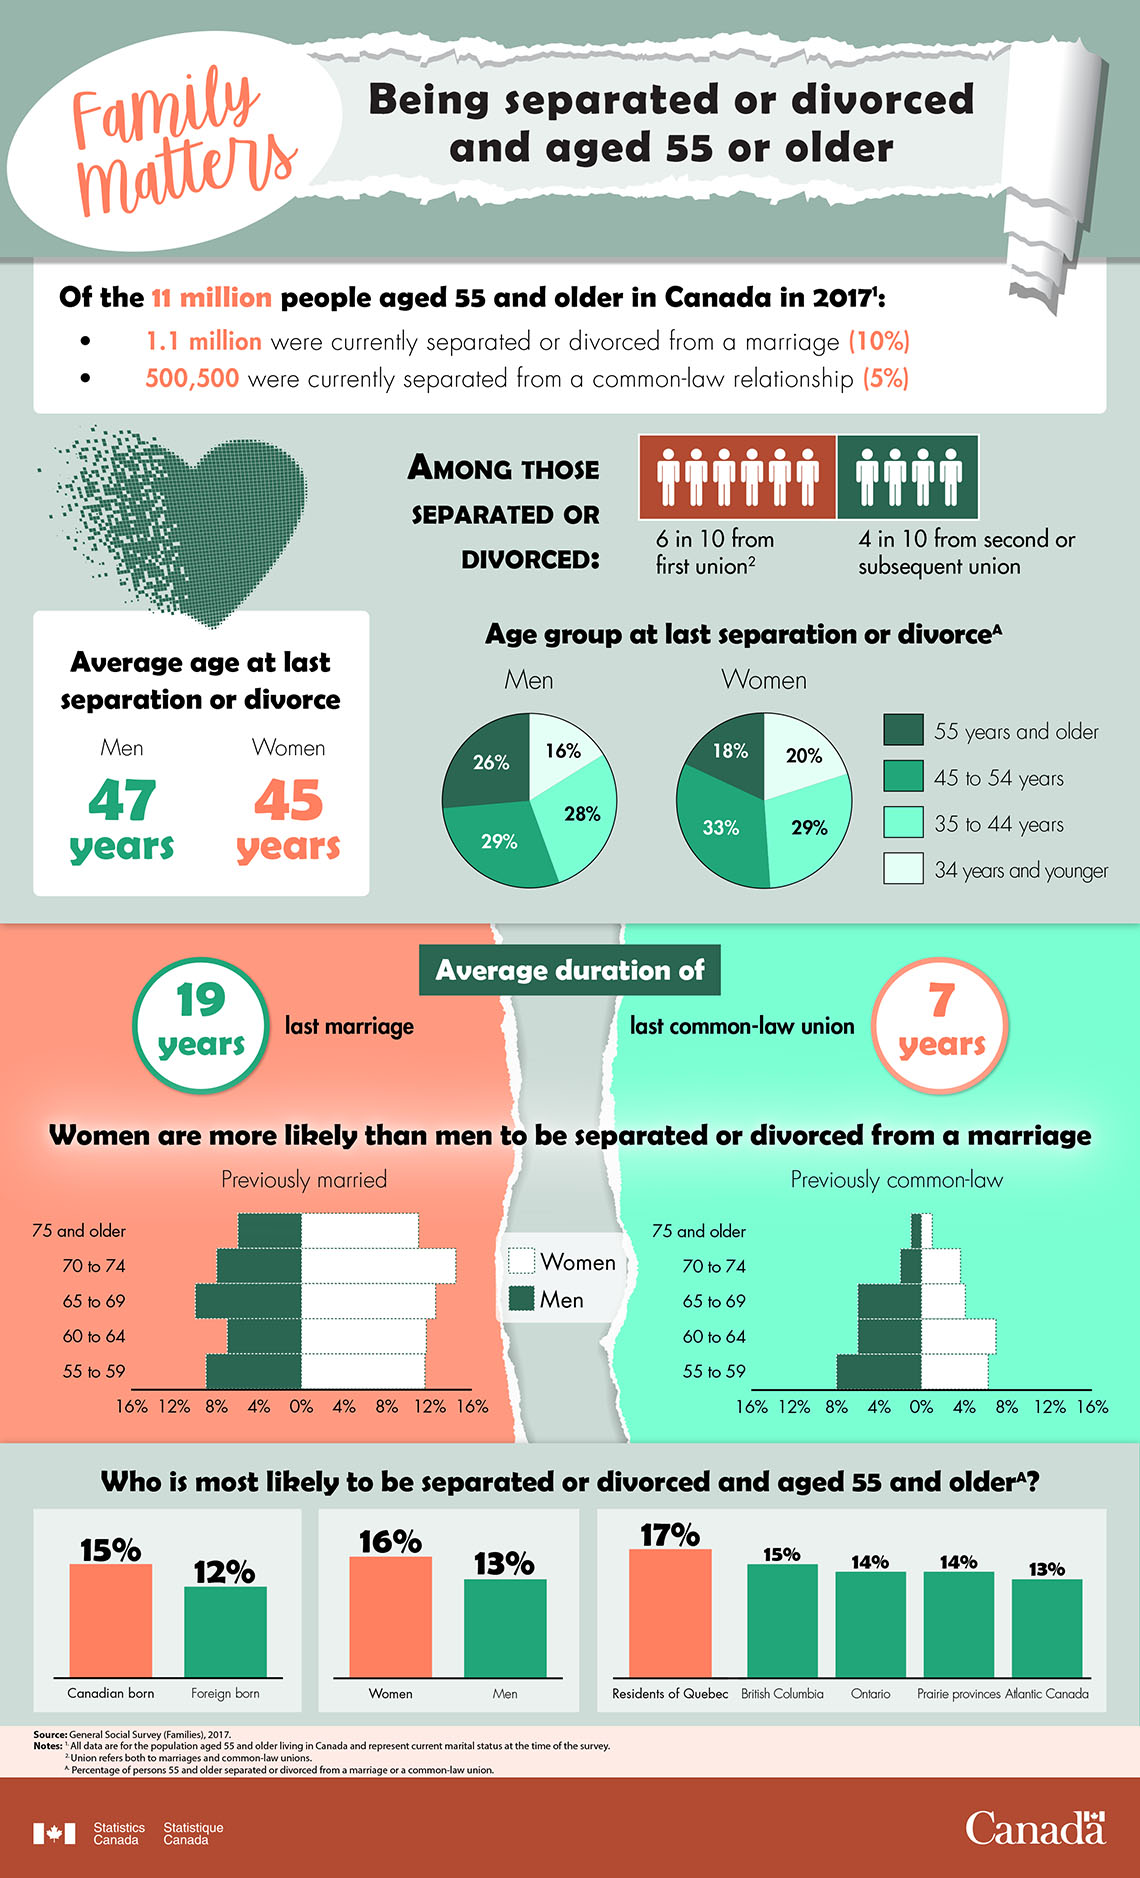
Family matters: Being separated or divorced and aged 55 or older
Of the 11 million people aged 55 and older in Canada in 2017Footnote 1:
- 1.1 million were currently separated or divorced from a marriage (10%)
- 500,500 were currently separated from a common-law relationship (5%)
Among those separated or divorced:
- 6 in 10 from first unionFootnote 2
- 4 in 10 from second or subsequent union
Average age at last separation or divorce
- Men: 47 years
- Women: 45 years
| Men | Women | |
|---|---|---|
| 34 and younger | 16% | 20% |
| 35 to 44 years | 28% | 29% |
| 45 to 54 years | 29% | 33% |
| 55 years and older | 26% | 18% |
| Total | 100% | 100% |
Average duration of:
- last marriage: 19 years
- last common-law union: 7 years
Women are more likely than men to be separated or divorced from a marriage
Previously married
| Men | Women | |
|---|---|---|
| 55 to 59 years | 9% | 12% |
| 60 to 64 years | 7% | 12% |
| 65 to 69 years | 10% | 13% |
| 70 to74 years | 8% | 15% |
| 75 years and older | 6% | 11% |
Previously common-law
| Men | Women | |
|---|---|---|
| 55 to 59 years | 8% | 6% |
| 60 to 64 years | 6% | 7% |
| 65 to 69 years | 6% | 4% |
| 70 to74 years | 2% | 4% |
| 75 years and older | 1% | 1% |
Who is most likely to be separated or divorced and aged 55 and olderFootnote 3?
| Percentage | |
|---|---|
| Canadian born | 15% |
| Foreign born | 12% |
| Percentage | |
|---|---|
| Women | 16% |
| Men | 13% |
| Percentage | |
|---|---|
| Residents of Quebec | 17% |
| British Columbia | 15% |
| Ontario | 14% |
| Prairie provinces | 14% |
| Atlantic Canada | 13% |
Source: General Social Survey (Families), 2017.
- Date modified: