
Temporary employment in Canada, 2018

Archived Content
Information identified as archived is provided for reference, research or recordkeeping purposes. It is not subject to the Government of Canada Web Standards and has not been altered or updated since it was archived. Please "contact us" to request a format other than those available.
Release date: May 14, 2019
Description: Temporary employment in Canada, 2018
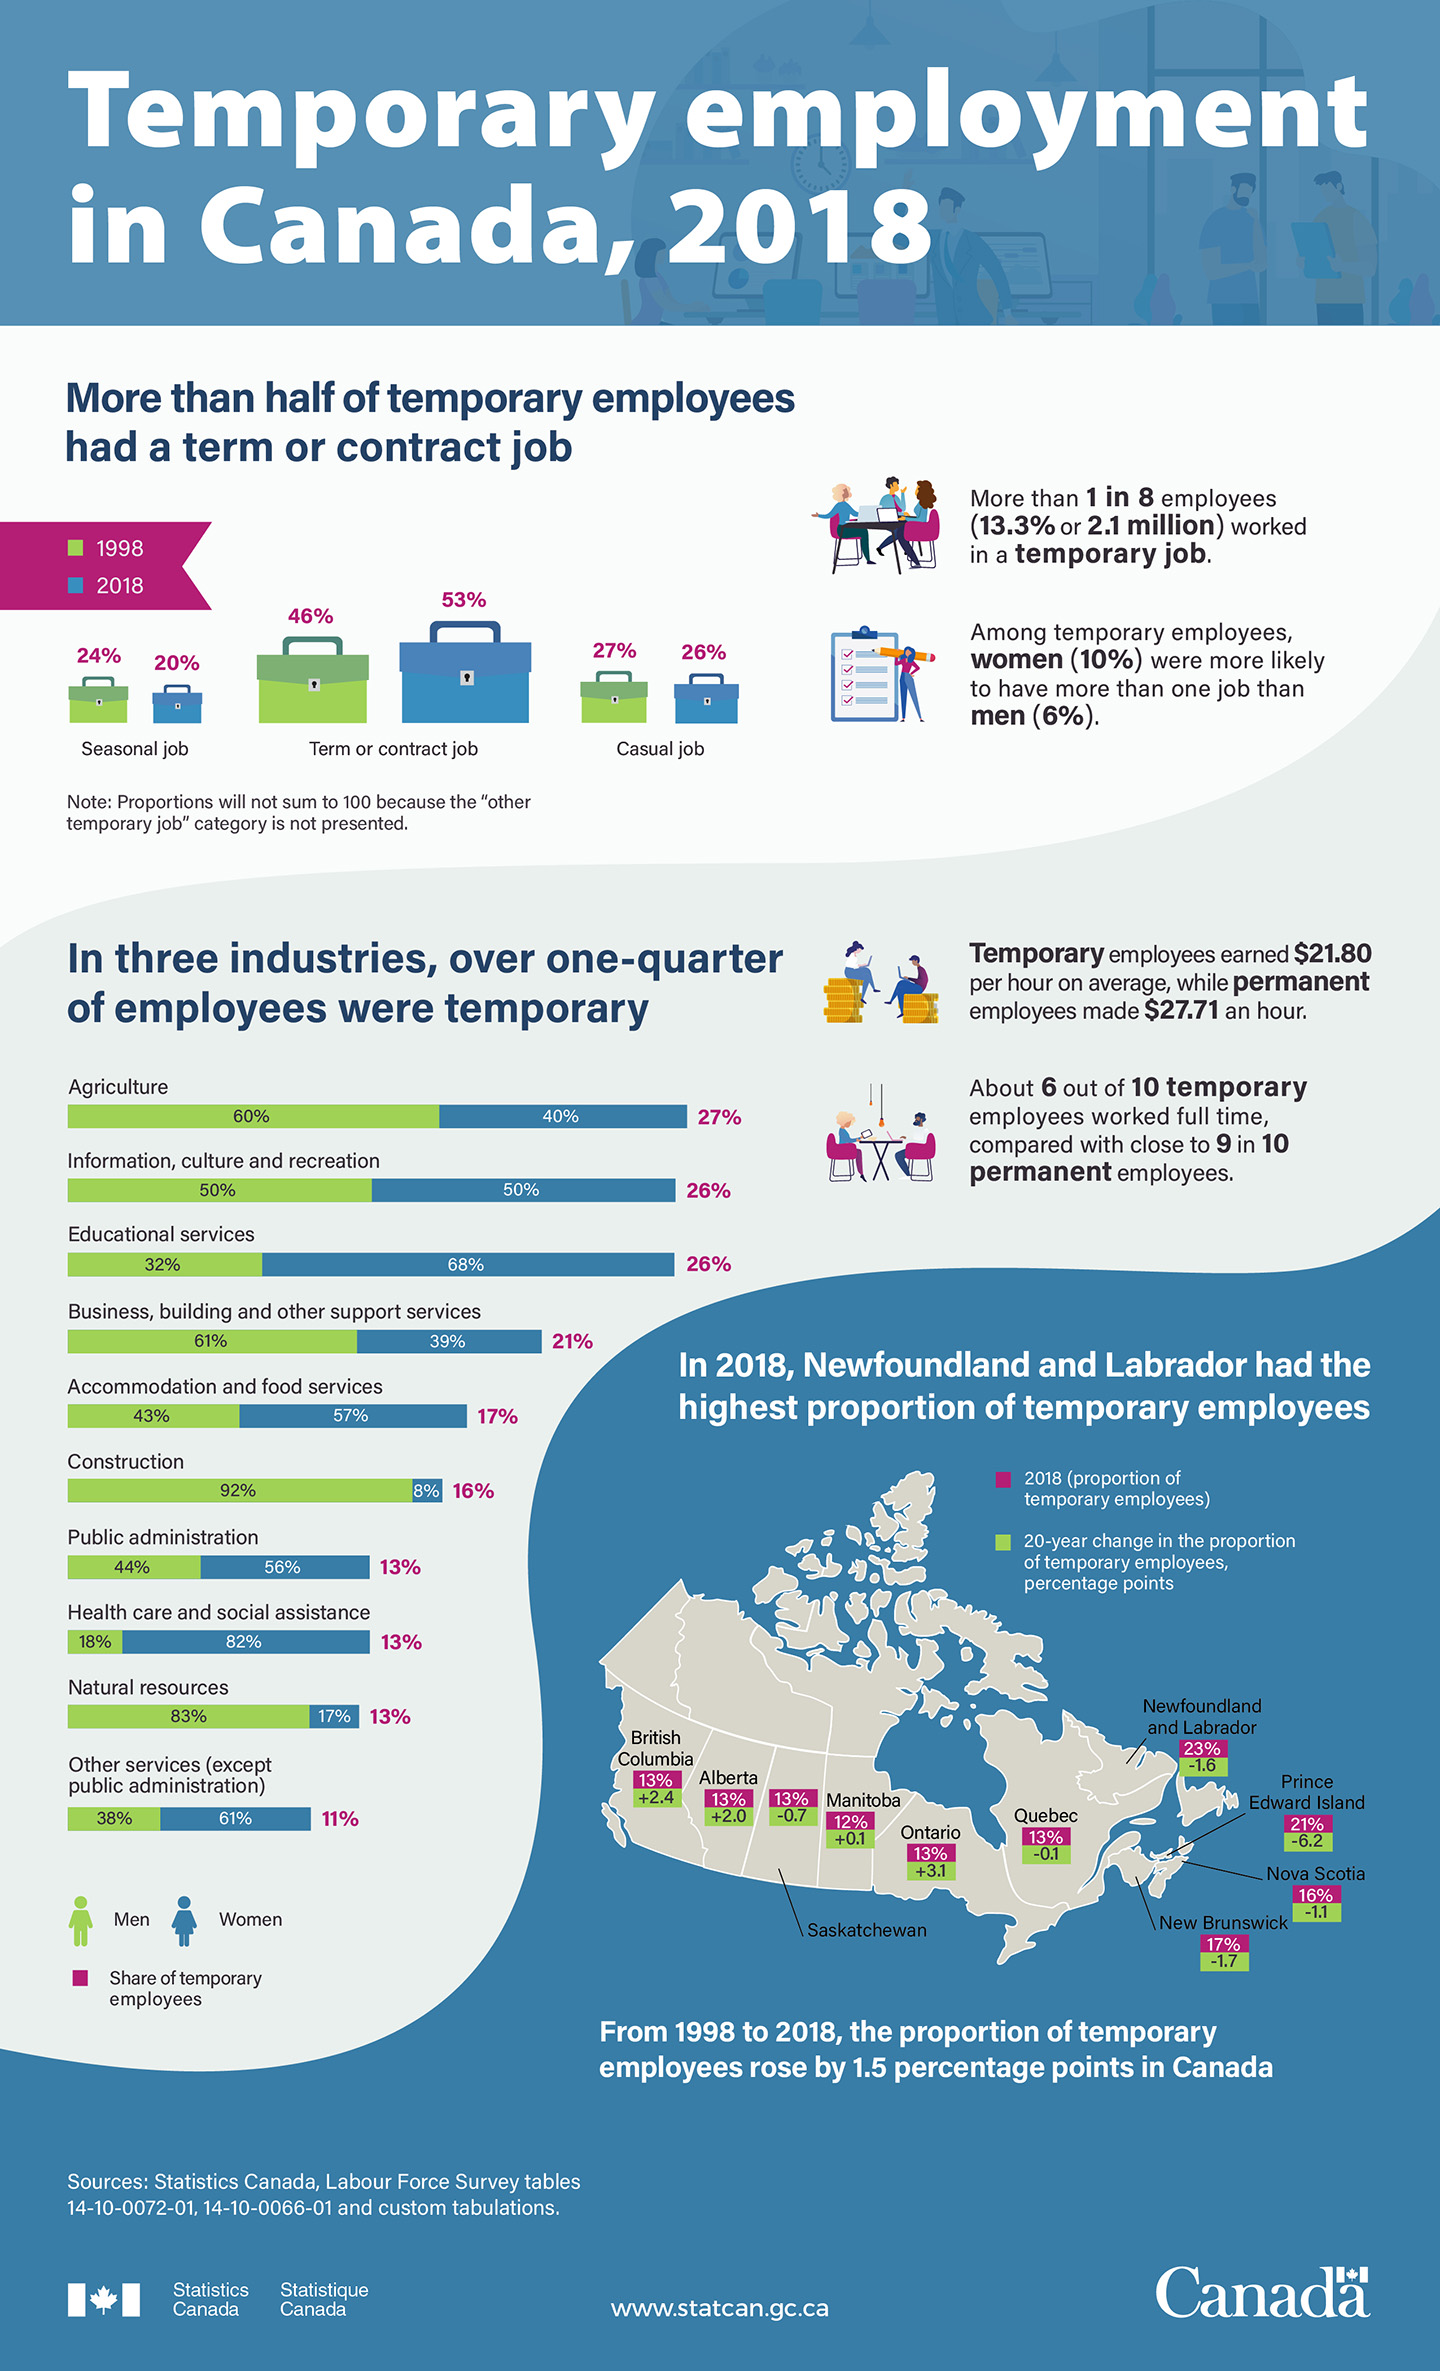
Temporary employment in Canada, 2018
More than half of temporary employees had a term or contract job
| 1998 | 2018 | |
|---|---|---|
| Seasonal job | 24% | 20% |
| Term or contract job | 46% | 53% |
| Casual job | 27% | 26% |
| Note: Proportions will not sum to 100 because the "other temporary job" category is not presented. | ||
In three industries, over one-quarter of employees were temporary
| Proportion of temporary employees | Men | Women | |
|---|---|---|---|
| Agriculture | 27% | 60% | 40% |
| Information, culture and recreation | 26% | 50% | 50% |
| Educational services | 26% | 32% | 68% |
| Business, building and other support services | 21% | 61% | 39% |
| Accommodation and food services | 17% | 43% | 57% |
| Construction | 16% | 92% | 8% |
| Public administration | 13% | 44% | 56% |
| Health care and social assistance | 13% | 18% | 82% |
| Natural resources | 13% | 83% | 17% |
| Other services (except public administration) | 11% | 38% | 61% |
- More than 1 in 8 employees (13.3% or 2.1 million) worked in a temporary job.
- Among temporary employees, women (10%) were more likely to have more than one job than men (6%).
- Temporary employees earned $21.80 per hour on average, while permanent employees made $27.71 an hour.
- About 6 out of 10 temporary employees worked full time, compared with close to 9 in 10 permanent employees.
In 2018, Newfoundland and Labrador had the highest proportion of temporary employees
| 2018 (proportion of temporary employees) | 20-year change in the proportion of temporary employees, percentage points | |
|---|---|---|
| Newfoundland and Labrador | 23% | -1.6 |
| Prince Edward Island | 21% | -6.2 |
| Nova Scotia | 16% | -1.1 |
| New Brunswick | 17% | -1.7 |
| Quebec | 13% | -0.1 |
| Ontario | 13% | 3.1 |
| Manitoba | 12% | 0.1 |
| Saskatchewan | 13% | -0.7 |
| Alberta | 13% | 2.0 |
| British Columbia | 13% | 2.4 |
From 1998 to 2018, the proportion of temporary employees rose by 1.5 percentage points in Canada.
Sources: Statistics Canada, Labour Force Survey, tables 14-10-0072-01, 14-10-0066-01 and custom tabulations.
- Date modified: