Potable water use in Canada
Archived Content
Information identified as archived is provided for reference, research or recordkeeping purposes. It is not subject to the Government of Canada Web Standards and has not been altered or updated since it was archived. Please "contact us" to request a format other than those available.

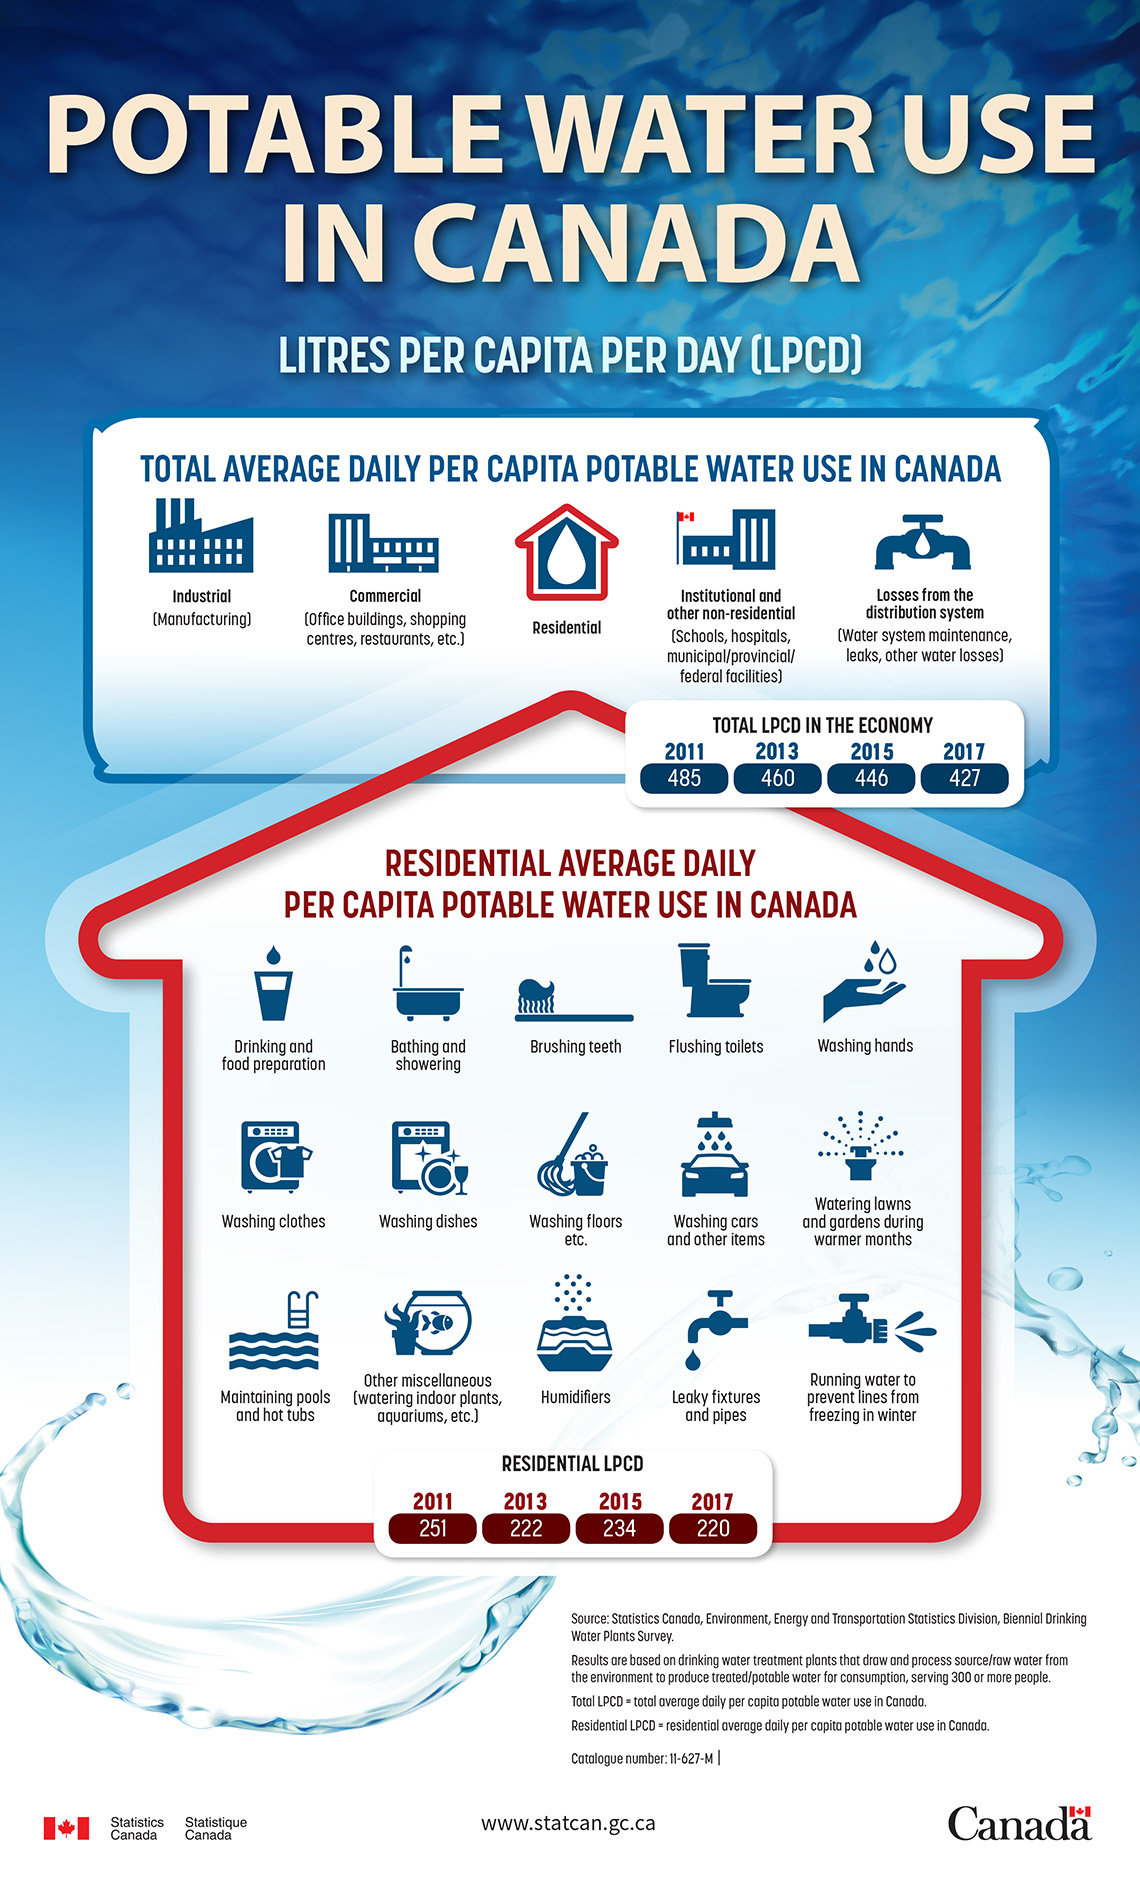
Description: Potable water use in Canada
Potable water use in Canada
Litres per capita per day (LPCD)
Total average daily per capita potable water use in Canada
- Industrial (manufacturing)
- Commercial (office buildings, shopping centres, restaurants, etc.)
- Residential
- Institutional and other non-residential (Schools, hospitals, municipal/provincial/federal facilities)
- Losses from the distribution system (water system maintenance, leaks, other water losses)
| Year | Litres per capita per day |
|---|---|
| 2011 | 485 |
| 2013 | 460 |
| 2015 | 446 |
| 2017 | 427 |
Residential average daily per capita potable water use in Canada
- Drinking and food preparation
- Bathing and showering
- Brushing teeth
- Flushing toilets
- Washing hands
- Washing clothes
- Washing dishes
- Washing floors etc.
- Washing cars and other items
- Watering lawns and gardens during warmer months
- Maintaining pools and hot tubs
- Other miscellaneous (watering indoor plants, aquariums, etc.)
- Humidifiers
- Leaky fixtures and pipes
- Running water to prevent lines from freezing in winter
| Year | Litres per capita per day |
|---|---|
| 2011 | 251 |
| 2013 | 222 |
| 2015 | 234 |
| 2017 | 220 |
Source: Statistics Canada, Environment, Energy and Transportation Statistics Division, Biennial Drinking Water Plants Survey.
Results are based on drinking water treatment plants that draw and process source/raw water from the environment to produce treated/potable water for consumption, serving 300 or more people.
Total LPCD = total average daily per capita potable water use in Canada.
Residential LPCD = residential average daily per capita potable water use in Canada
- Date modified:
