
Working women in Canada's top 1%: Who are they?

Archived Content
Information identified as archived is provided for reference, research or recordkeeping purposes. It is not subject to the Government of Canada Web Standards and has not been altered or updated since it was archived. Please "contact us" to request a format other than those available.
Description: Working women in Canada's top 1%: Who are they?
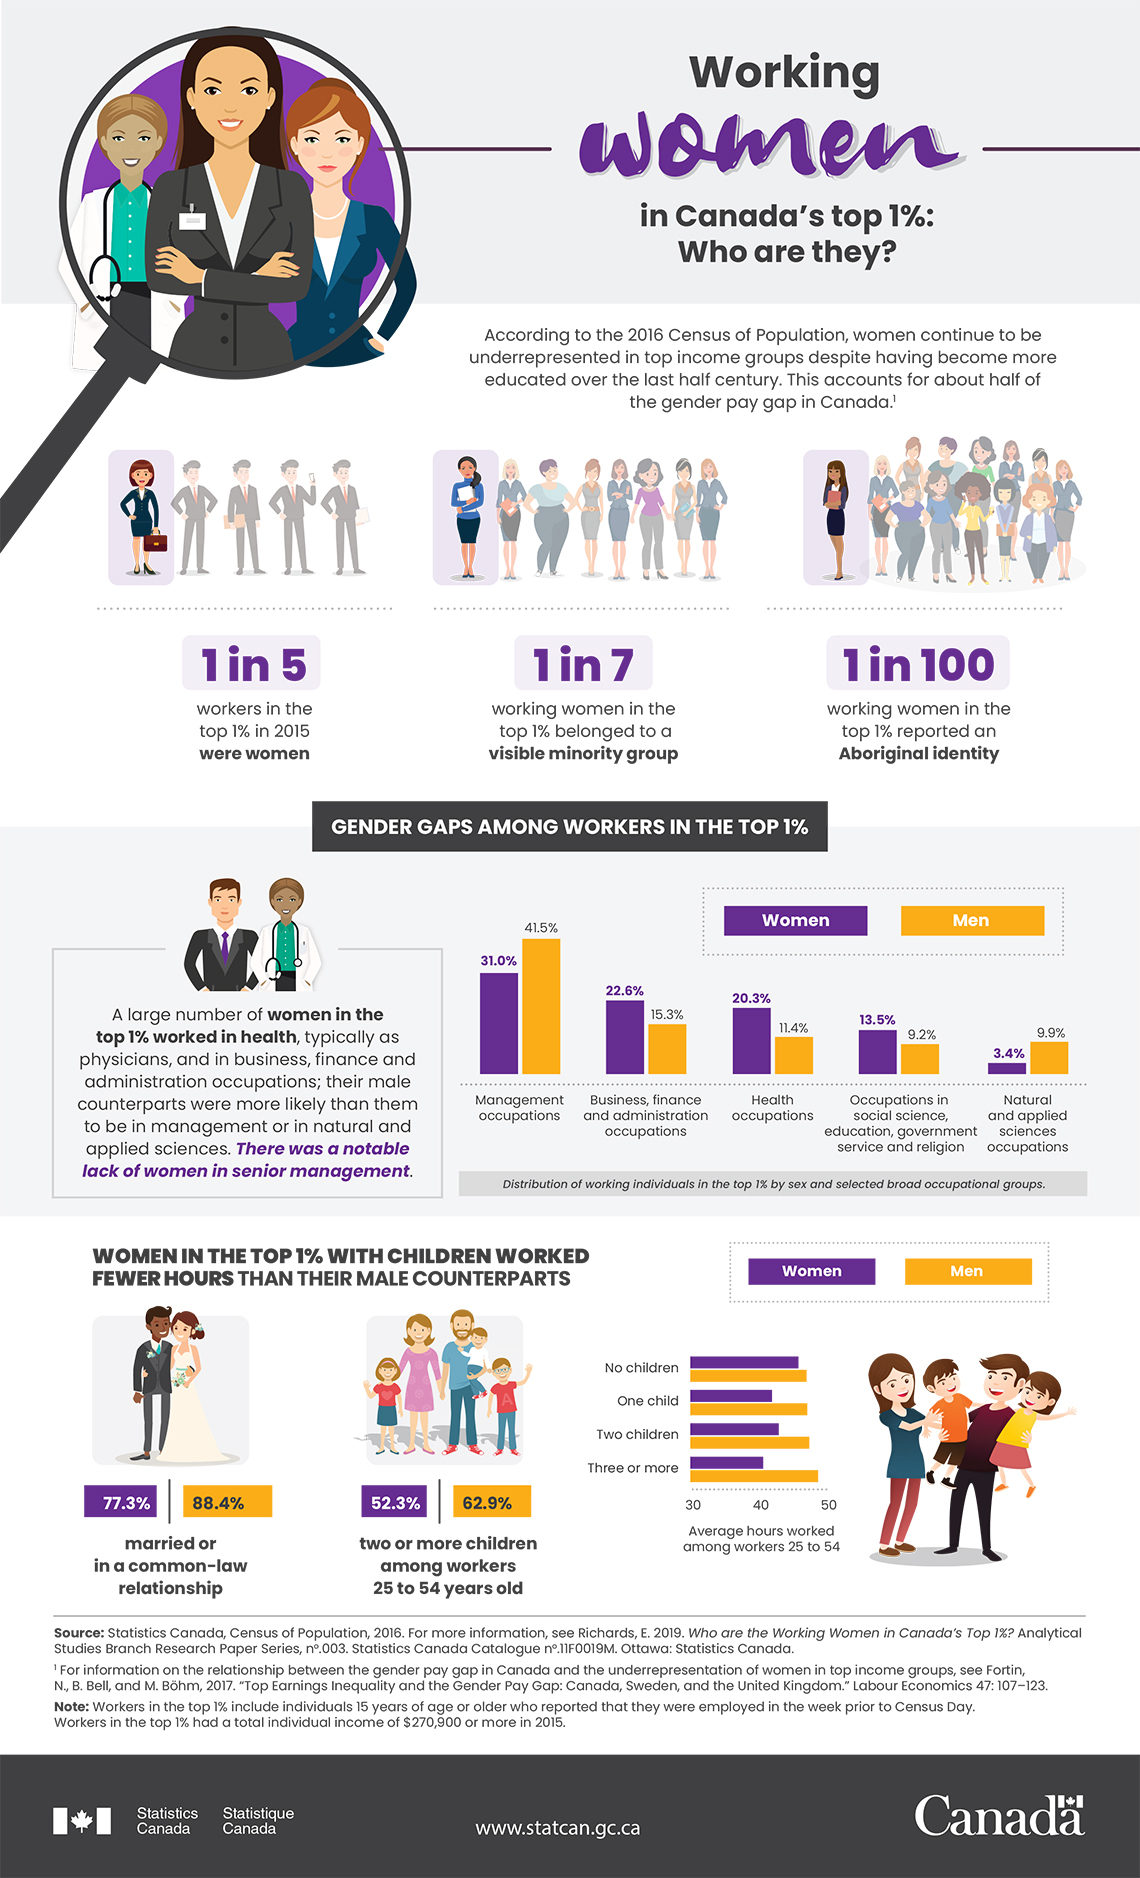
Working women in Canada's top 1%: Who are they?
According to the 2016 Census of Population, women continue to be underrepresented in top income groups despite having become more educated over the last half century. This accounts for about half of the gender pay gap in Canada.Footnote 1
- 1 in 5 workers in the top 1% in 2015 were women
- 1 in 7 working women in the top 1% belonged to a visible minority group
- 1 in 100 working women in the top 1% reported on Aboriginal identity
Gender gaps among workers in the top 1%
A large number of women in the top 1% worked in health, typically as physicians, and in business, finance and administration occupations; their male counterparts were more likely than not to be in management or in natural and applied sciences. There was a notable lack of women in senior management.
| Selected occupational groups | Women (percent) | Men (percent) |
|---|---|---|
| Management occupations | 31.0 | 41.5 |
| Business, finance and administration occupations | 22.6 | 15.3 |
| Health occupations | 20.3 | 11.4 |
| Occupations in social science, education, government service and religion | 13.5 | 9.2 |
| Natural and applied sciences occupations | 3.4 | 9.9 |
Women in the top 1% with children worked fewer hours than their male counterparts.
- married or in a common-law relationship: 77.3% women; 88.4% men
- two or more children among workers 25 to 54 years old: 52.3% women; 62.9% men
| Number of children | Women | Men |
|---|---|---|
| No children | 45.5 | 46.7 |
| One child | 41.6 | 46.8 |
| Two children | 42.6 | 47.1 |
| Three or more | 40.3 | 48.4 |
Source: Statistics Canada, Census of Population, 2016. For more information, see Richards, E. 2019. Who are the Working Women in Canada's Top 1%? Analytical Studies Branch Research Paper Series, no.003. Statistics Canada Catalogue no.11F0019M. Ottawa: Statistics Canada.
Note: Workers in the top 1% include individuals 15 years of age or older who reported that they were employed in the week prior to Census Day. Workers in the top 1% had a total individual income of $270,900 or more in 2015.
- Date modified: