The socioeconomic portrait of Canada's evolving farm population
Archived Content
Information identified as archived is provided for reference, research or recordkeeping purposes. It is not subject to the Government of Canada Web Standards and has not been altered or updated since it was archived. Please "contact us" to request a format other than those available.
Release date: November 27, 2018

Description: The socioeconomic portrait of Canada's evolving farm population
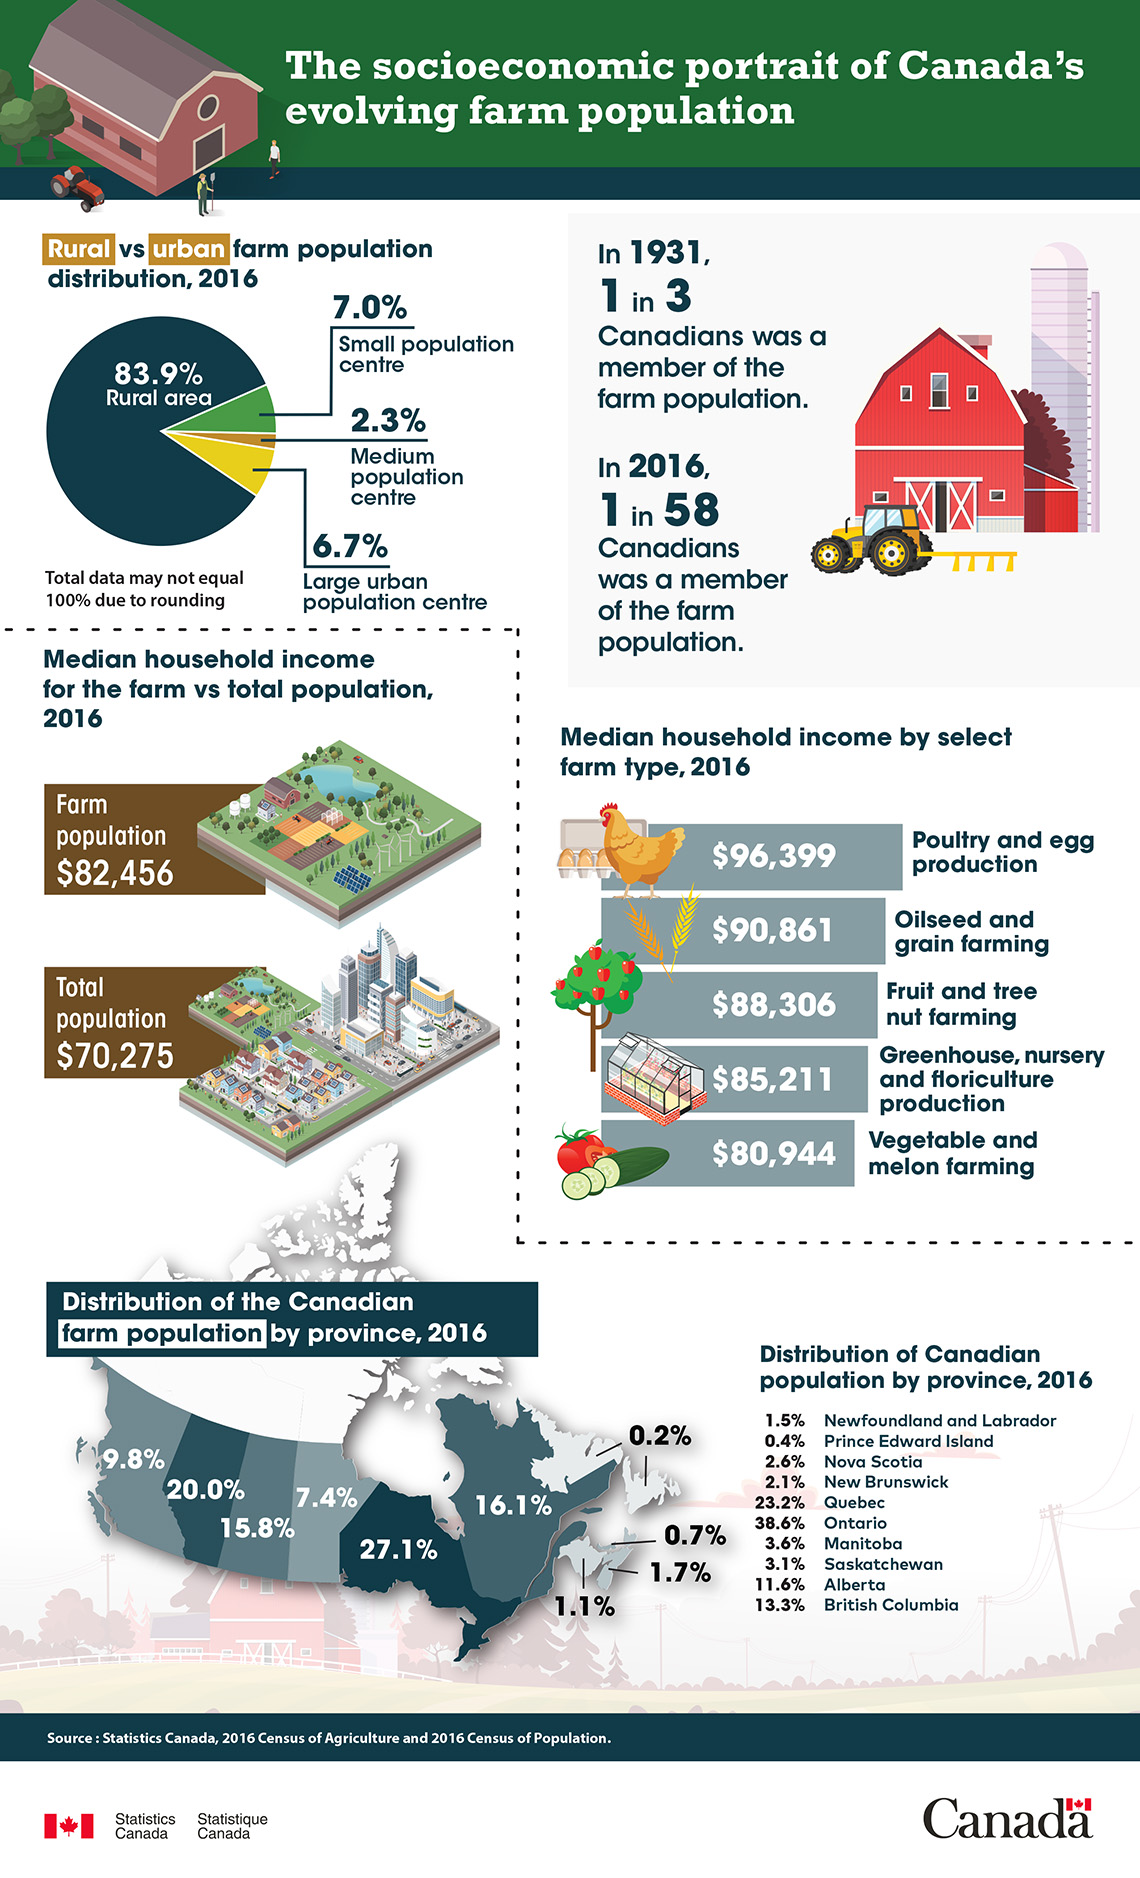
The socioeconomic portrait of Canada's evolving farm population
| Percentage of farm population | |
|---|---|
| Rural area | 83.9% |
| Small population centre | 7.0% |
| Medium population centre | 2.3% |
| Large urban population centre | 6.7% |
| Total data may not equal 100% due to rounding | |
In 1931, 1 in 3 Canadians was a member of the farm population.
In 2016, 1 in 58 Canadians was a member of the farm population.
Median household income for the farm vs total population, 2016
- Farm population $82,456
- Total population $70,275
| Farm type | Median household income |
|---|---|
| Poultry and egg production | $96,399 |
| Oilseed and grain farming | $90,861 |
| Fruit and tree nut farming | $88,306 |
| Greenhouse, nursery and floriculture production | $85,211 |
| Vegetable and melon farming | $80,944 |
| Province | Percentage of farm population |
|---|---|
| British Columbia | 9.8% |
| Alberta | 20.0% |
| Saskatchewan | 15.8% |
| Manitoba | 7.4% |
| Ontario | 27.1% |
| Quebec | 16.1% |
| New Brunswick | 1.1% |
| Nova Scotia | 1.7% |
| Prince Edward Island | 0.7% |
| Newfoundland and Labrador | 0.2% |
| Province | Percentage of the Canadian poulation |
|---|---|
| British Columbia | 13.3% |
| Alberta | 11.6% |
| Saskatchewan | 3.1% |
| Manitoba | 3.6% |
| Ontario | 38.6% |
| Quebec | 23.2% |
| New Brunswick | 2.1% |
| Nova Scotia | 2.6% |
| Prince Edward Island | 0.4% |
| Newfoundland and Labrador | 1.5% |
Source: Statistics Canada, 2016 Census of Agriculture and 2016 Census of Population.
- Date modified:
