
150 years of Canadian Agriculture

Archived Content
Information identified as archived is provided for reference, research or recordkeeping purposes. It is not subject to the Government of Canada Web Standards and has not been altered or updated since it was archived. Please "contact us" to request a format other than those available.
Description: 150 years of Canadian Agriculture
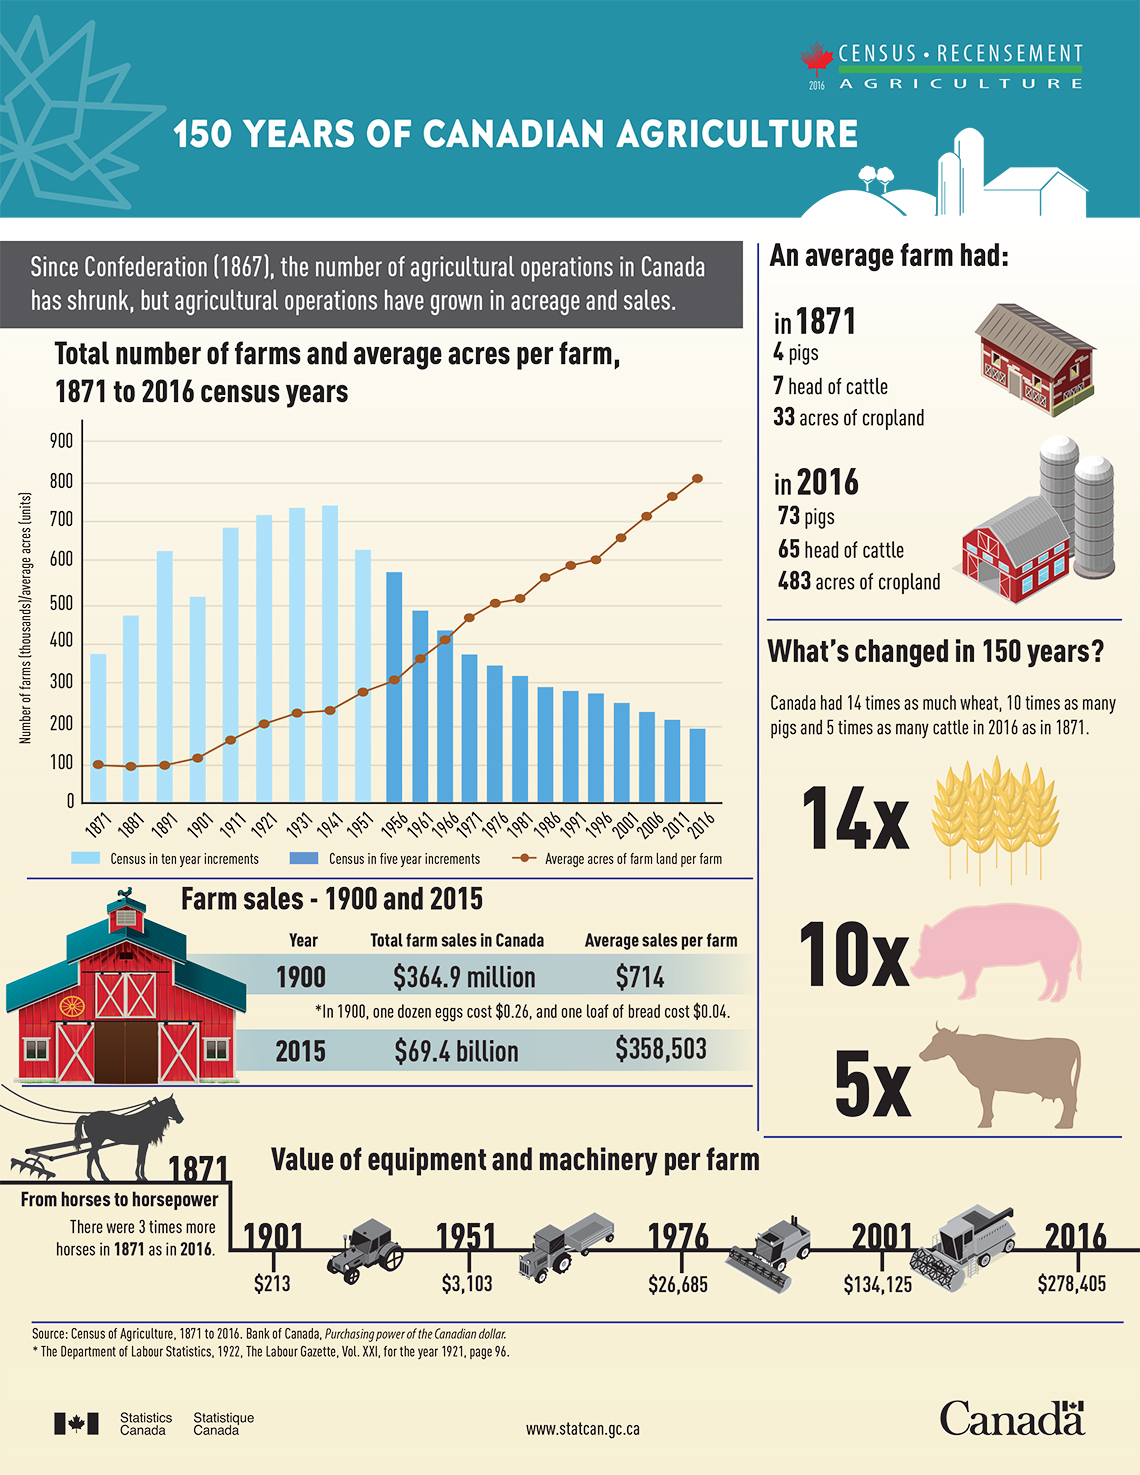
Since Confederation (1867), the number of agricultural operations in Canada has shrunk, but agricultural operations have grown in acreage and sales.
| Year | Total number of farms | Average acres per farm |
|---|---|---|
| Note: 1871 to 1951 Census done every 10 years. 1956 to 2016 Census done every 5 years. | ||
| 1871 | 367,862 | 98 |
| 1881 | 464,025 | 98 |
| 1891 | 620,486 | 97 |
| 1901 | 511,073 | 124 |
| 1911 | 682,329 | 160 |
| 1921 | 711,090 | 198 |
| 1931 | 728,623 | 224 |
| 1941 | 732,832 | 237 |
| 1951 | 623,087 | 279 |
| 1956 | 574,993 | 302 |
| 1961 | 480,877 | 359 |
| 1966 | 430,503 | 404 |
| 1971 | 366,110 | 463 |
| 1976 | 338,552 | 499 |
| 1981 | 318,361 | 511 |
| 1986 | 293,089 | 572 |
| 1991 | 280,043 | 598 |
| 1996 | 276,548 | 608 |
| 2001 | 246,923 | 676 |
| 2006 | 229,373 | 728 |
| 2011 | 205,730 | 778 |
| 2016 | 193,492 | 820 |
An average farm had:
- In 1871 4 pigs, 7 head of cattle, and 33 acres of cropland.
- In 2016 73 pigs, 65 head of cattle, and 483 acres of cropland.
What's changed in 150 years?
Canada had 14 times as much wheat, 10 times as many pigs and 5 times as many cattle in 2016 as in 1871.
| Year | Total farm sales in Canada | Average sales per farm |
|---|---|---|
| Note: In 1900, one dozen eggs cost $0.26, and one loaf of bread cost $0.04.Footnote 1 | ||
| 1900 | $364.9 million | $714 |
| 2015 | $69.4 billion | $358,503 |
From horses to horsepower - There were 3 times more horses in 1871 as in 2016.
| Year | Average value of equipment and machinery per farm |
|---|---|
| 1901 | $213 |
| 1951 | $3,103 |
| 1976 | $26,685 |
| 2001 | $134,125 |
| 2016 | $278,405 |
Source: Census of Agriculture, 1871 to 2016. Bank of Canada-Purchasing power of the Canadian dollar.
- Date modified: