
Infographic: Population Projections, Immigration and Diversity, Canada and regions, 2011 to 2036

Archived Content
Information identified as archived is provided for reference, research or recordkeeping purposes. It is not subject to the Government of Canada Web Standards and has not been altered or updated since it was archived. Please "contact us" to request a format other than those available.
Release date: January 25, 2017
Description for Infographic: Population Projections, Immigration and Diversity, Canada and regions, 2011 to 2036
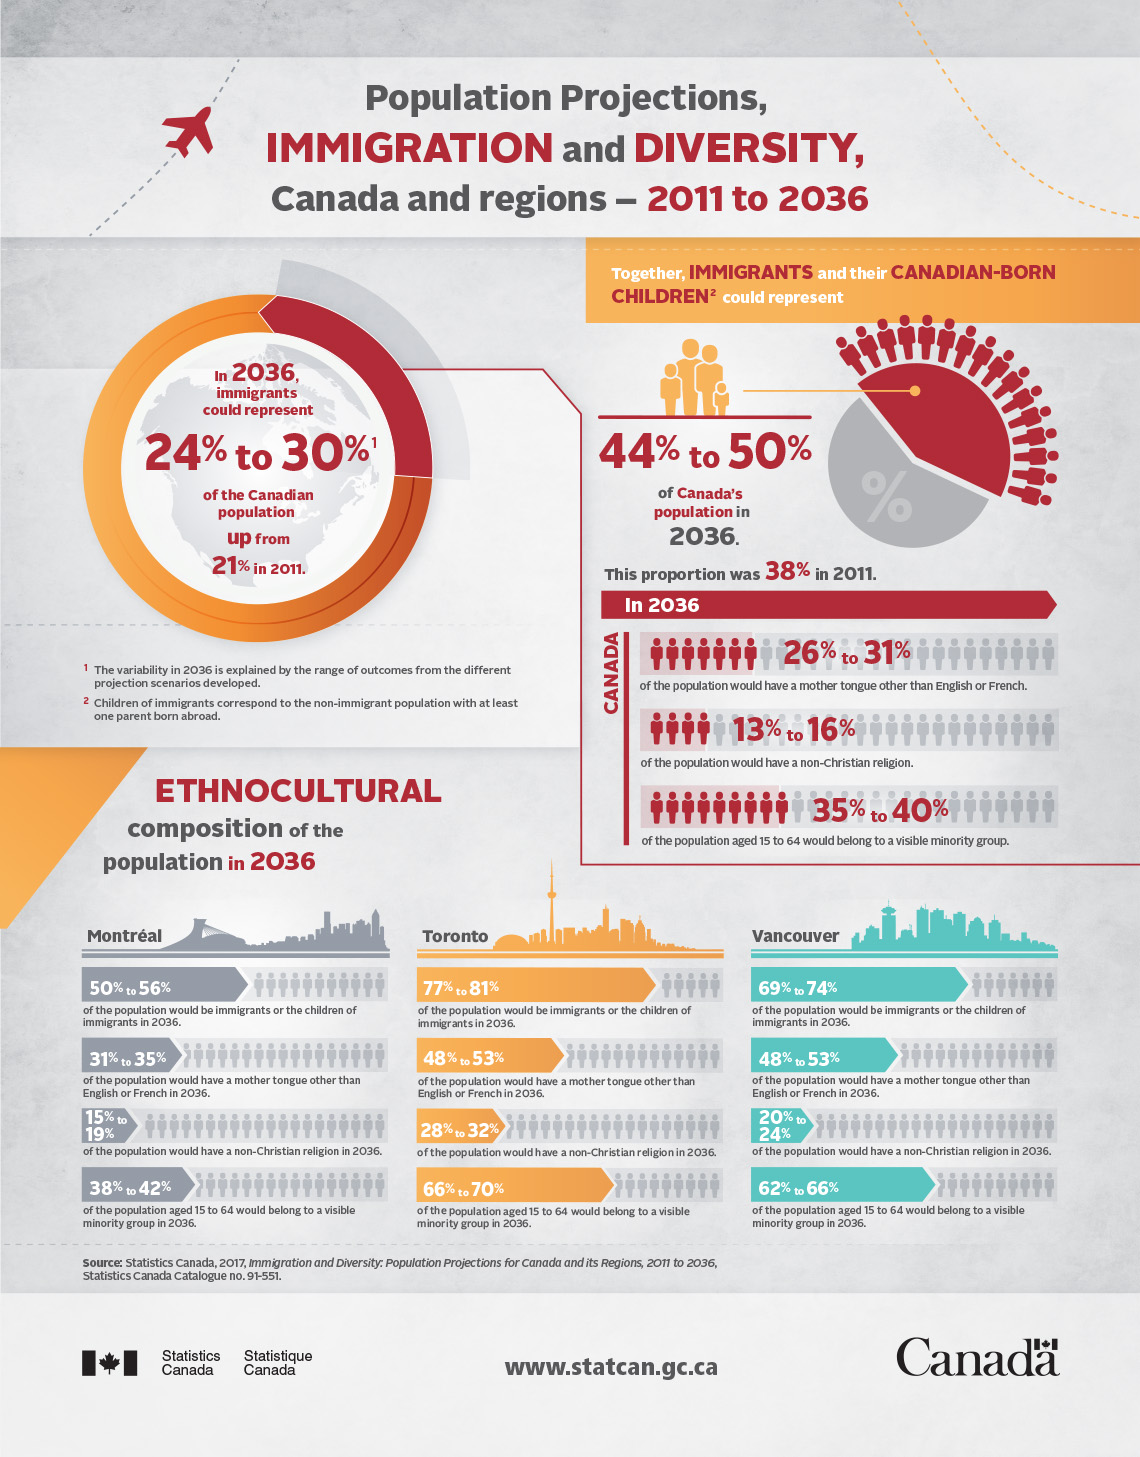
In 2036, immigrants could represent 24% to 30%Footnote 1 of the Canadian population, up from 21% in 2011.
Together, immigrants and their Canadian-born childrenFootnote 2 could represent 44% to 50% of Canada’s population in 2036.
This proportion was 38% in 2011.
Canada - In 2036:
- 26% to 31% of the population would have a mother tongue other than English or French.
- 13% to 16% of the population would have a non-Christian religion.
- 35% to 40% of the population aged 15 to 64 would belong to a visible minority group.
Ethnocultural composition of the population in 2036
Montréal
- 50% to 56% of the population would be immigrants or the children of immigrants in 2036.
- 31% to 35% of the population would have a mother tongue other than English or French in 2036.
- 15% to 19% of the population would have a non-Christian religion in 2036.
- 38% to 42% of the population aged 15 to 64 would belong to a visible minority group in 2036.
Toronto
- 77% to 81% of the population would be immigrants or the children of immigrants in 2036.
- 48% to 53% of the population would have a mother tongue other than English or French in 2036.
- 28% to 32% of the population would have a non-Christian religion in 2036.
- 66% to 70% of the population aged 15 to 64 would belong to a visible minority group in 2036.
Vancouver
- 69% to 74% of the population would be immigrants or the children of immigrants in 2036.
- 48% to 53% of the population would have a mother tongue other than English or French in 2036.
- 20% to 24% of the population would have a non-Christian religion in 2036.
- 62% to 66% of the population aged 15 to 64 would belong to a visible minority group in 2036.
Source: Statistics Canada, 2017, Immigration and Diversity: Population Projections for Canada and its Regions, 2011 to 2036, Statistics Canada Catalogue no. 91-551.
- Date modified: