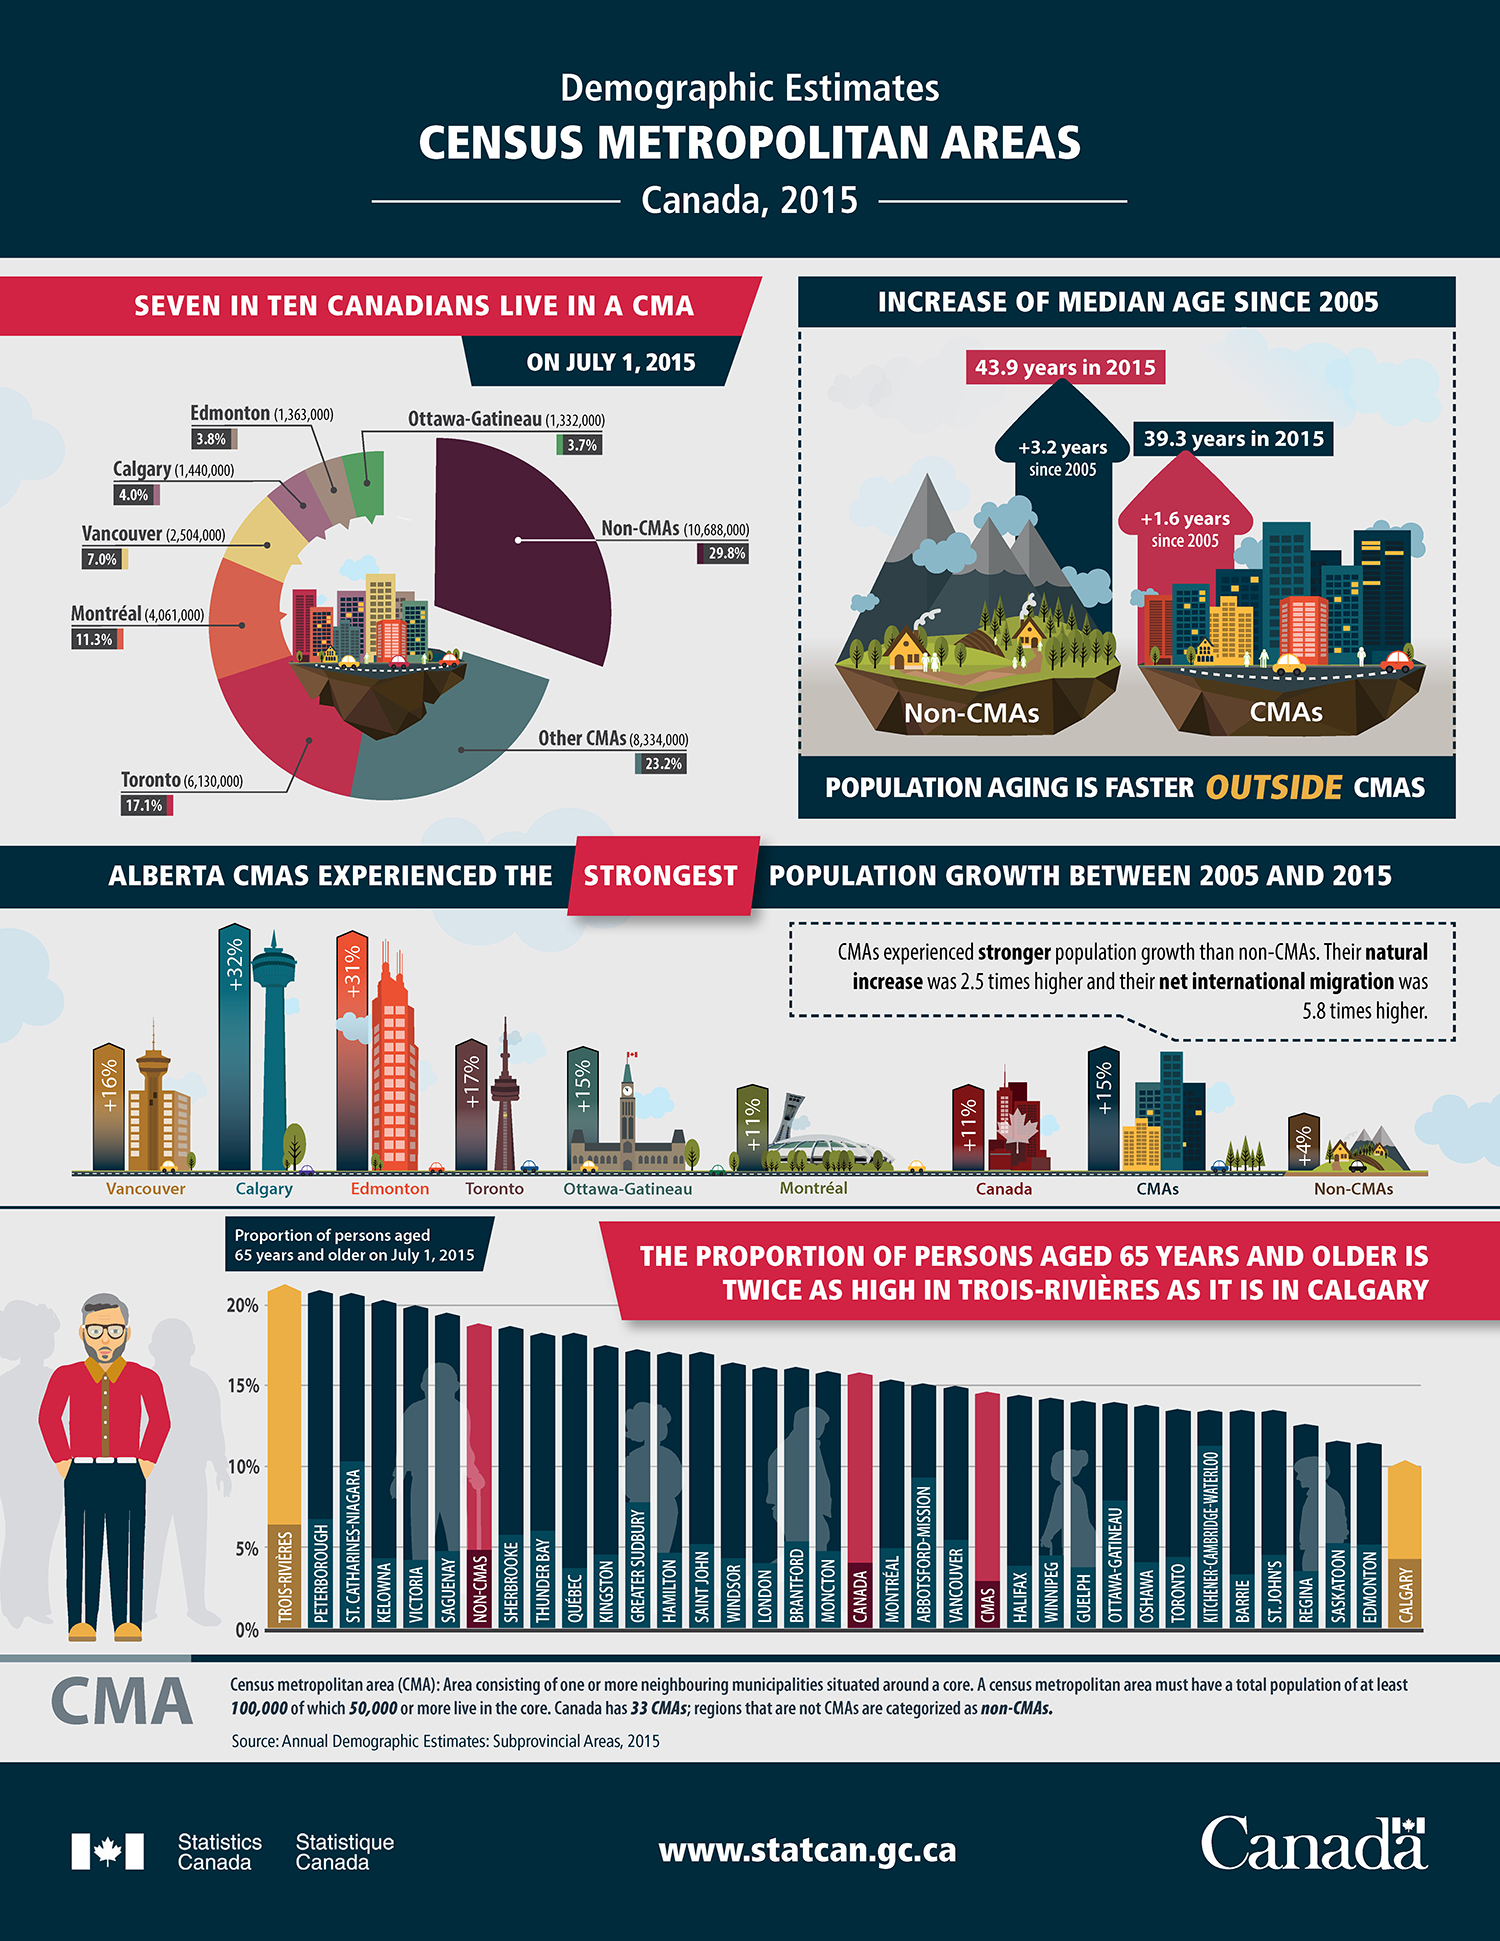
Infographic: Demographic Estimates, Census Metropolitan Areas – Canada, 2015
Archived Content
Information identified as archived is provided for reference, research or recordkeeping purposes. It is not subject to the Government of Canada Web Standards and has not been altered or updated since it was archived. Please "contact us" to request a format other than those available.

Description for Infographic: Demographic Estimates, Census Metropolitan Areas – Canada, 2015
A census metropolitan area (CMA) is an area consisting of one or more neighbouring municipalities situated around a core. A census metropolitan area must have a total population of at least 100,000 of which 50,000 or more live in the core. Canada has 33 CMAs; regions that are not CMAs are categorized as non-CMAs.
Seven in ten Canadians live in a CMA on July 1, 2015.
| CMAs | Population | Percentage of population |
|---|---|---|
| Toronto | 6,130,000 | 17.1% |
| Montreal | 4,061,000 | 11.3% |
| Vancouver | 2,504,000 | 7.0% |
| Calgary | 1,440,000 | 4.0% |
| Edmonton | 1,363,000 | 3.8% |
| Ottawa-Gatineau | 1,332,000 | 3.7% |
| Other CMAs | 8,334,000 | 23.2% |
| Non-CMAs | 10,688,000 | 29.8% |
Increase of median age since 2005
In non-CMAs, the median age was 43.9 years in 2015, up +3.2 years since 2005.
In CMAs, the median age was 39.3 years in 2015, up +1.6 years since 2005.
Population aging is faster outside CMAs.
Alberta CMAs experienced the strongest population growth between 2005 and 2015.
CMAs experienced stronger population growth than non-CMAs. Their natural increase was 2.5 times higher and their net international migration was 5.8 times higher than in non-CMAs.
| CMAs and Non-CMAs | Population growth in percentage |
|---|---|
| Vancouver | +16% |
| Calgary | +32% |
| Edmonton | +31% |
| Toronto | +17% |
| Ottawa-Gatineau | +15% |
| Montréal | +11% |
| Canada | +11% |
| CMAs | +15% |
| Non-CMAs | +4% |
The proportion of persons aged 65 years and older is twice as high in Trois-Rivières as it is in Calgary.
| CMAs | Proportion of persons aged 65 years and older on July 1, 2015 |
|---|---|
| Trois-Rivières | 21.6% |
| Peterborough | 21.2% |
| St. Catharines-Niagara | 21.0% |
| Kelowna | 20.6% |
| Victoria | 20.0% |
| Saguenay | 19.8% |
| Non-CMAs | 18.9% |
| Sherbrooke | 18.6% |
| Thunder Bay | 18.6% |
| Québec | 18.5% |
| Kingston | 17.8% |
| Greater Sudbury | 17.6% |
| Hamilton | 17.2% |
| Saint John | 17.2% |
| Windsor | 16.7% |
| London | 16.5% |
| Brantford | 16.5% |
| Moncton | 16.2% |
| Canada | 16.1% |
| Montréal | 15.7% |
| Vancouver | 15.0% |
| CMAs | 14.9% |
| Halifax | 14.7% |
| Winnipeg | 14.6% |
| Guelph | 14.5% |
| Ottawa-Gatineau | 14.3% |
| Oshawa | 14.1% |
| Toronto | 13.9% |
| Kitchener-Cambridge-Waterloo | 13.8% |
| Barrie | 13.8% |
| St. John's | 13.8% |
| Regina | 12.9% |
| Saskatoon | 11.9% |
| Edmonton | 11.8% |
| Calgary | 10.4% |
Source: Annual Demographic Estimates: Subprovincial Areas, 2015
- Date modified:
