
Infographic: Charitable Giving in Canada

Archived Content
Information identified as archived is provided for reference, research or recordkeeping purposes. It is not subject to the Government of Canada Web Standards and has not been altered or updated since it was archived. Please "contact us" to request a format other than those available.
Release date: December 16, 2015
Description for Infographic: Charitable Giving in Canada
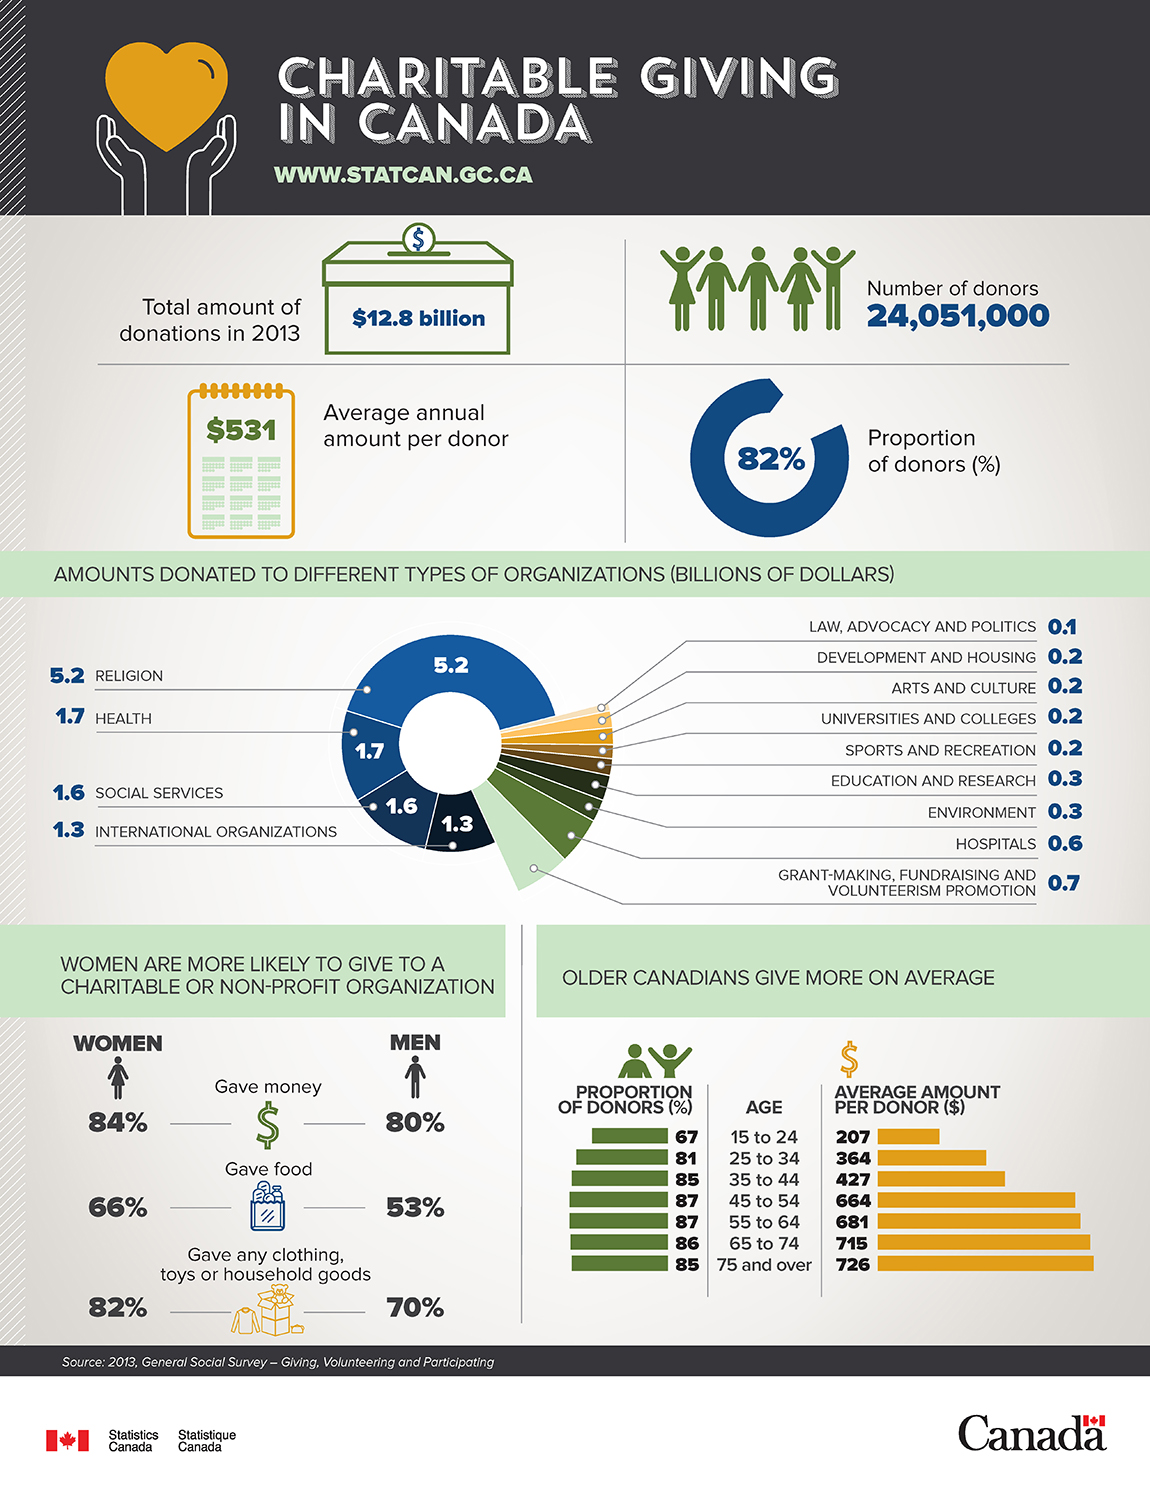
- Total amount of donations in 2013 were 12.8 billions of dollars.
- Numbers of donors were 24,051,000.
- Proportion of donors - 82%.
- Average annual amount per donor is $531.
| Organizations | Billions of dollars |
|---|---|
| Religion | 5.2 |
| Health | 1.7 |
| Social Services | 1.6 |
| International organizations | 1.3 |
| Grant-making, fundraising and volunteerism promotion | 0.7 |
| Hospitals | 0.6 |
| Education and research | 0.3 |
| Environment | 0.3 |
| Development and housing | 0.2 |
| Arts and culture | 0.2 |
| University and colleges | 0.2 |
| Sports and recreation | 0.2 |
| Law, advocacy and politics | 0.1 |
| Types of donations | Women | Men |
|---|---|---|
| Gave money | 84% | 80% |
| Gave food | 66% | 53% |
| Gave any clothing, toys or household goods | 82% | 70% |
| Proportion of donors (%) | Age | Average annual amount per donor (in dollars) |
|---|---|---|
| 67 | 15 to 24 | 207 |
| 81 | 25 to 34 | 364 |
| 85 | 35 to 44 | 427 |
| 87 | 45 to 54 | 664 |
| 87 | 55 to 64 | 681 |
| 86 | 65 to 74 | 715 |
| 85 | 75 and over | 726 |
Source: 2013, General Social Survey – Giving, Volunteering and Participating
- Date modified: