
Infographic: Population estimates, Canada, 2015

Archived Content
Information identified as archived is provided for reference, research or recordkeeping purposes. It is not subject to the Government of Canada Web Standards and has not been altered or updated since it was archived. Please "contact us" to request a format other than those available.
Description for Infographic: Population estimates, Canada, 2015
Source: Annual Demographic Estimates: Canada, Provinces and Territories, 2015
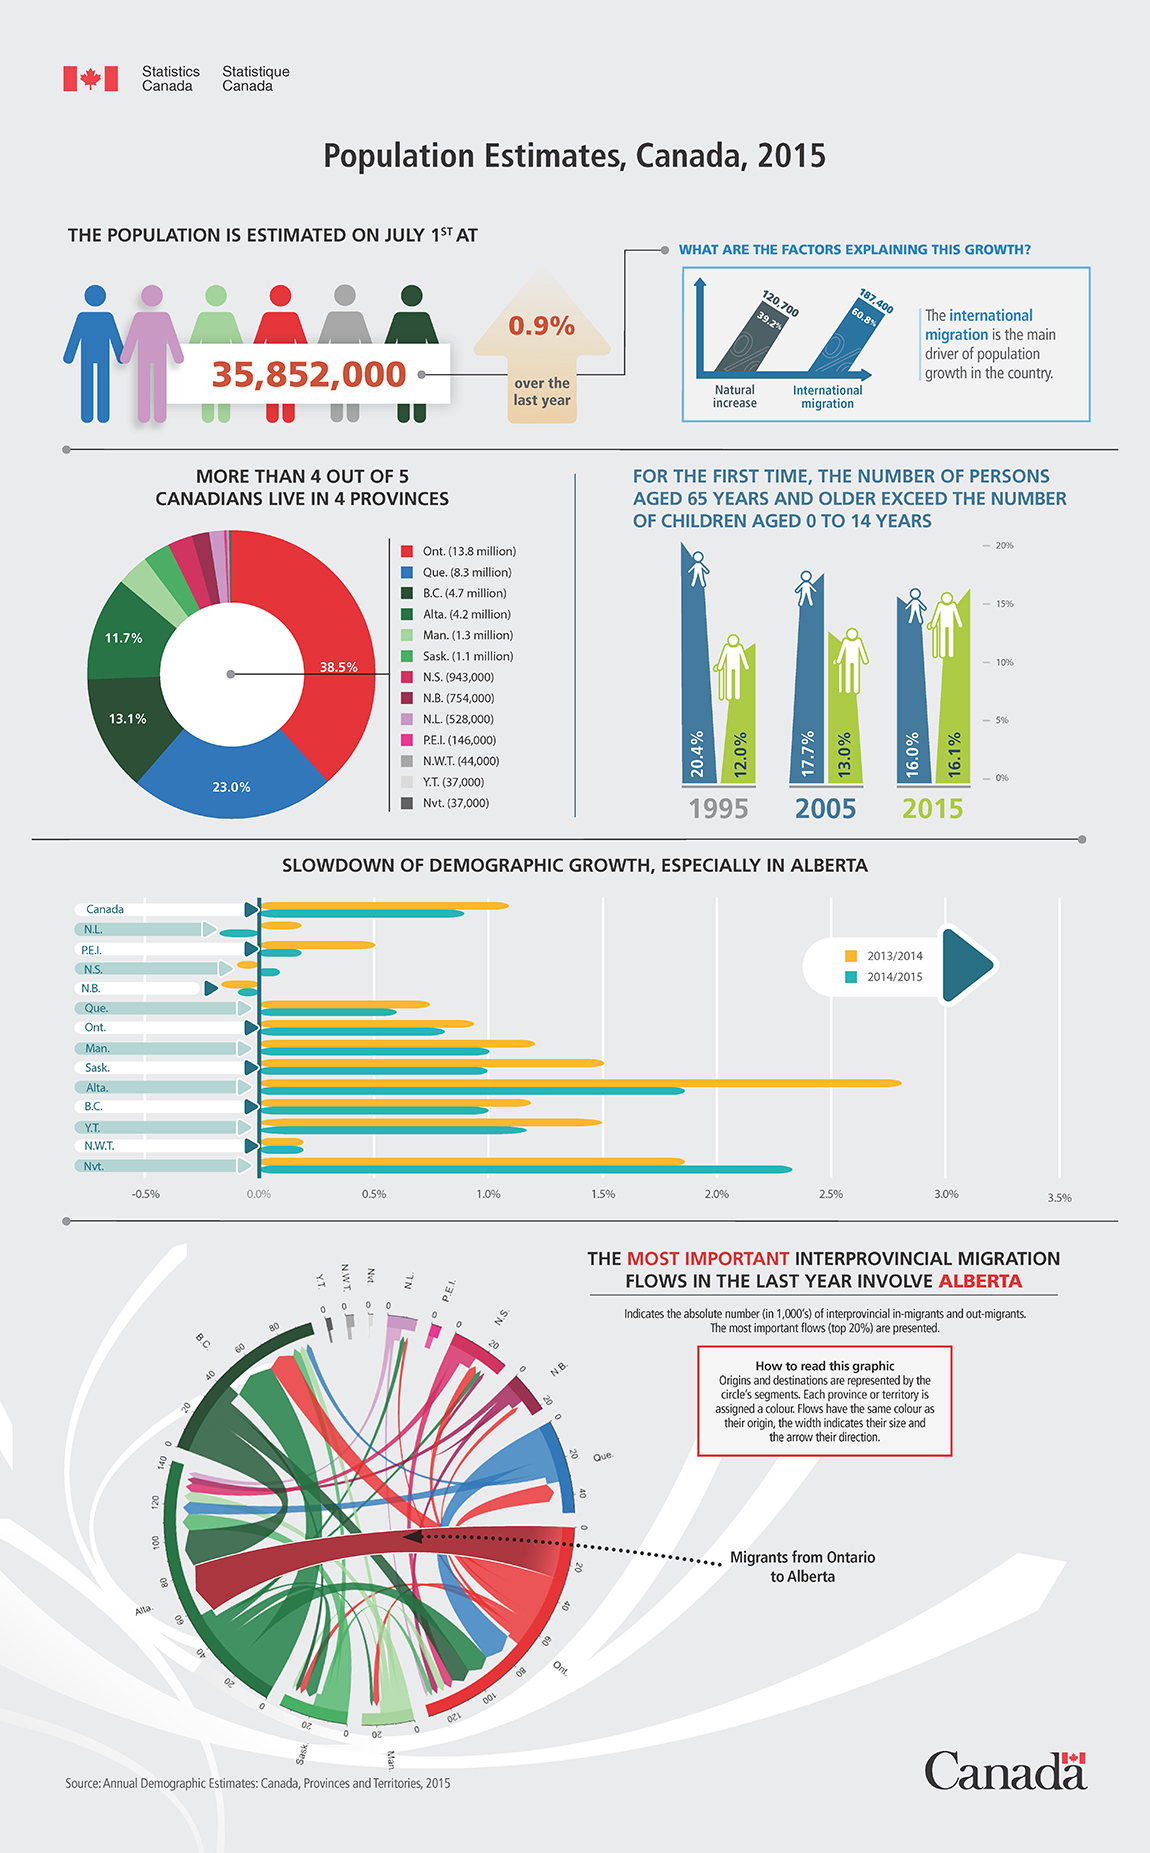
The population is estimated on July 1 to: 35,852,000
- +0.9% over the last year
What are the factors explaining this growth?
- Natural increase – 39.2% (120,700)
- International migration – 60.8% (187,400)
The international migration is the main driver of the population growth in the country.
| Province | Population |
|---|---|
| Ontario | 13.8 million |
| Quebec | 8.3 million |
| British Columbia | 4.7 million |
| Alberta | 4.2 million |
| Manitoba | 1.3 million |
| Saskatchewan | 1.1 million |
| Nova Scotia | 943,000 |
| New Brunswick | 754,000 |
| Newfoundland and Labrador | 528,000 |
| Prince Edward Island | 146,000 |
| Northwest Territoires | 44,000 |
| Nunavut | 37,000 |
| Yukon | 37,000 |
Persons 65 years and older now outnumber children aged 0 to 14 years.
| Proportion of population | % |
|---|---|
| Aged 0 to 14 years | 20.4 |
| Aged 65 years and older | 12.0 |
| Proportion of population | % |
|---|---|
| Aged 0 to 14 years | 17.7 |
| Aged 65 years and older | 13.0 |
| Proportion of population | % |
|---|---|
| Aged 0 to 14 years | 16.0 |
| Aged 65 years and older | 16.1 |
Slowdown of population growth, especially in Alberta.
| 2013/2014 | 2014/2015 | |
|---|---|---|
| Canada | 1.1 | 0.9 |
| Newfoundland and Labrador | 0.2 | -0.2 |
| Prince Edward Island | 0.5 | 0.2 |
| Nova Scotia | -0.1 | 0.1 |
| New Brunswick | -0.2 | -0.1 |
| Quebec | 0.7 | 0.6 |
| Ontario | 0.9 | 0.8 |
| Manitoba | 1.2 | 1.0 |
| Saskatchewan | 1.5 | 1.0 |
| Alberta | 2.8 | 1.8 |
| British Columbia | 1.2 | 1.0 |
| Yukon | 1.5 | 1.2 |
| Northwest Territoires | 0.2 | 0.2 |
| Nunavut | 1.8 | 2.3 |
The most important interprovincial migration flows in the last year involve Alberta.
Indicates the absolute number, (in 1,000's) of interprovincial in-migrants and out-migrants. The most important flows (top 20%) are shown.
| Origin | Destination | ||||||||||||
|---|---|---|---|---|---|---|---|---|---|---|---|---|---|
| N.L. | P.E.I. | N.S. | N.B. | Que. | Ont. | Man. | Sask. | Alta. | B.C. | Y.T. | N.W.T. | Nvt. | |
| N.L. | . | 196 | 1,436 | 446 | 257 | 2,020 | 122 | 144 | 3,315 | 503 | 9 | 37 | 125 |
| P.E.I. | 142 | . | 615 | 295 | 107 | 786 | 29 | 44 | 1,097 | 286 | 0 | 44 | 0 |
| N.S. | 793 | 343 | . | 1,802 | 618 | 5,104 | 250 | 437 | 5,017 | 1,412 | 100 | 250 | 163 |
| N.B. | 274 | 322 | 2,286 | . | 1,276 | 3,436 | 134 | 320 | 3,520 | 725 | 32 | 122 | 47 |
| Que. | 200 | 95 | 739 | 1,484 | . | 17,684 | 423 | 623 | 7,151 | 3,366 | 153 | 105 | 118 |
| Ont. | 1,896 | 738 | 4,957 | 2,817 | 10,595 | . | 3,521 | 3,511 | 26,013 | 15,207 | 412 | 440 | 383 |
| Man. | 186 | 25 | 305 | 168 | 379 | 4,396 | . | 2,118 | 6,054 | 4,014 | 36 | 77 | 67 |
| Sask. | 112 | 24 | 396 | 205 | 287 | 3,041 | 1,620 | . | 9,727 | 4,307 | 30 | 70 | 90 |
| Alta. | 2,895 | 345 | 2,609 | 1,833 | 1,881 | 13,091 | 2,141 | 6,823 | . | 24,523 | 251 | 402 | 110 |
| B.C. | 418 | 91 | 1,270 | 506 | 1,816 | 11,335 | 1,649 | 2,469 | 22,472 | . | 435 | 361 | 148 |
| Y.T. | 34 | 8 | 56 | 10 | 86 | 129 | 67 | 117 | 397 | 628 | . | 6 | 7 |
| N.W.T. | 124 | 0 | 232 | 52 | 21 | 340 | 70 | 99 | 949 | 299 | 159 | . | 132 |
| Nvt. | 138 | 15 | 102 | 76 | 162 | 365 | 40 | 4 | 113 | 113 | 18 | 111 | . |
- Date modified: