
Economic Insights
Recent Developments in the Canadian Economy, 2020: COVID-19, fourth edition

Archived Content
Information identified as archived is provided for reference, research or recordkeeping purposes. It is not subject to the Government of Canada Web Standards and has not been altered or updated since it was archived. Please "contact us" to request a format other than those available.
This article summarizes notable changes in output and employment over the first few months of the reopening period, focusing on the unevenness of the economic recovery across industrial sectors and population groups. It also highlights monthly data on business openings and closures in the late spring as COVID-related restrictions continued to ease. The tabulations in this report are based on data that are publicly available as of October 23, 2020.
The article references numerous findings from a recent presentation on the social, economic and health impacts of the pandemic, titled The Social and Economic Impacts of COVID-19: A Six-Month Update. For contextual information on major business and economic developments since the onset of the pandemic, see the Canadian Economic News.
Several headline economic indicators—including merchandise trade, manufacturing sales, wholesale sales, and retail sales—rebounded sharply from historic declines in the months following the lockdowns. After double-digit gains in June and July, merchandise trade edged lower in August, stabilizing at about 6% below pre-COVID levels, due largely to lower trade in energy products and aircraft and other transportation equipment. Manufacturing sales rose sharply from May to July, rebounding to within 5% of pre-COVID levels, despite lower sales of petroleum and coal products. Wholesaling edged above pre-COVID levels in July, while retail sales, buoyed by a sharp increase in on-line receipts, returned to pre-COVID levels by June. Much of the sudden decline and rebound in these headline indicators reflected large swings in auto-related sales, which fell precipitously during the lockdowns and then strengthened markedly once restrictions affecting auto supply chains began to ease.
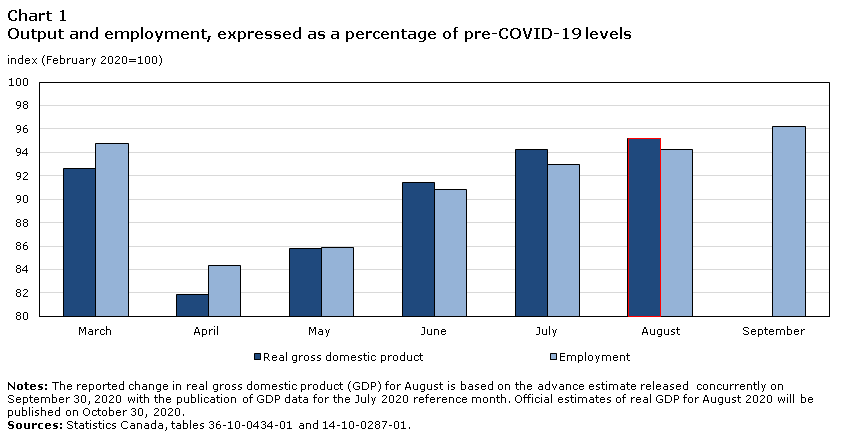
Data table for Chart 1
| March | April | May | June | July | August | September | |
|---|---|---|---|---|---|---|---|
| index (February 2020=100) | |||||||
| Real gross domestic product | 92.6 | 81.9 | 85.8 | 91.4 | 94.2 | 95.2 | Note ..: not available for a specific reference period |
| Employment | 94.7 | 84.3 | 85.9 | 90.8 | 93.0 | 94.3 | 96.3 |
|
.. not available for a specific reference period Notes: The reported change in real gross domestic product (GDP) for August is based on the advance estimate released concurrently on September 30, 2020 with the publication of GDP data for the July 2020 reference month. Official estimates of real GDP for August 2020 will be published on October 30, 2020. Sources: Statistics Canada, tables 36-10-0434-01 and 14-10-0287-01. |
|||||||
Changes in economy-wide output in the months following the lockdowns provide a more general sense of how quickly economic activity began ramping up once COVID-related restrictions began to ease. After contracting by 18% from February to April, real gross domestic product rose sharply in May (+4.8%) and June (+6.5%), rising to within 9% of its pre-COVID level before the summer months (Chart 1). A substantial portion of the economy-wide rebound during the late spring reflected increases in construction, manufacturing and retail trade as restrictions that curtailed activity in these sectors began to ease.
The pace of economic growth moderated in July (+3.0%) as businesses continued to reopen, bringing real gross domestic product to within 6% of its pre-COVID level. Higher factory output again contributed substantially to July’s headline gain, supported by increases in health services, real estate activity and accommodation and food services. Despite the sizeable rebound in economy-wide output during the late spring and early summer, the pace of the recovery has varied substantially across industrial sectors, especially among services (Chart 2).
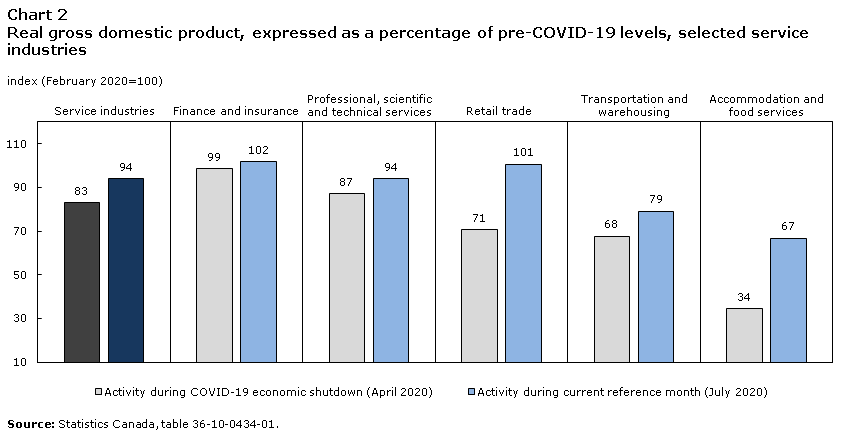
Data table for Chart 2
| Activity during COVID-19 economic shutdown (April 2020) | Activity during current reference month (July 2020) | |
|---|---|---|
| index (February 2020=100) | ||
| Service industries | 83 | 94 |
| Finance and insurance | 99 | 102 |
| Professional, scientific and technical services | 87 | 94 |
| Retail trade | 71 | 101 |
| Transportation and warehousing | 68 | 79 |
| Accommodation and food services | 34 | 67 |
| Source: Statistics Canada, table 36-10-0434-01. | ||
Early stages of the recovery underscored key differences among service industries
Many higher-earning services, including financial services, computer systems design, and scientific, research and development services, were less impacted by the lockdowns as employees in financial and professional sectors tend to have relatively high levels of workplace flexibility and autonomy.Note Teleworking capacity varies markedly across industries, and is more prevalent in financial services and professional, scientific and technical services . Teleworking is also more prevalent among high-earning families (The Social and Economic Impacts of COVID-19: A Six-Month Update, slides 77 and 78).
Services that support spending on consumer durables and housing also rebounded swiftly as businesses began to reopen. While the recovery in retail activity was led by a strong rebound in auto sales, activity at several other store types, including furniture and home furnishing stores, electronics and appliance stores, and building equipment and garden equipment stores, all reached or surpassed pre-COVID levels by June. Many non-essential retailers developed or enhanced their on-line platforms during the lockdowns, resulting in sizable increases in on-line sales across a broad range of store types (Aston et al., 2020 and The Social and Economic Impacts of COVID-19: A Six-Month Update, slide 74).
At the same time, continued strong demand for housing in the months following the lockdowns fueled sharp increases in real estate services. The output of real estate agents and brokers rose briskly from May to July, eclipsing pre-COVID levels by over 20%. These activities in July were at their highest level in 16 years, bolstered by double-digit increases in resale activity in many urban markets.
Other monthly data reinforce the surge in the post-lockdown housing market. Starts accelerated during the summer months as investment in residential construction strengthened from May to August. New housing prices also rose steadily over this four-month period, before accelerating in September as builders reported the largest headline increase in 14 years.Note The strong momentum in housing contrasts with developments in the commercial property market, where recent data point to a pull-back in non-residential outlays as businesses reassess their office and store space needs. The sharp decline in commercial rents in the second quarter, along with lower non-residential construction intentions (based on revised data collected during June and July) underscore the weaker outlook for commercial properties.Note
Travel, tourism and hospitality remain severely impacted
While some services have rebounded quickly, others, particularly those related to discretionary spending on travel, tourism and hospitality, remain severely affected by weaker demand and ongoing travel restrictions. By July, the output of air transportation services, despite reduced fees, discounts and promotions, remained over 90% below pre-pandemic levels. Despite modest increases in recent months, air passenger volumes, measured year-over-year, have been down 90% or more since the first full month of border closures took effect in April.
Accommodation and food services were among those industries most visibly impacted by COVID‑19. Despite stronger sales during late spring and early summer, their combined output in July was still about one-third below pre-pandemic levels. Despite substantial price reductions aimed at encouraging a return to travel, accommodation was over 40% below levels observed in February, while food services was down nearly 30%, even as full-service restaurants with dining halls and patios continued to reopen.Note Arts, entertainment, and other recreation services also continued to be severely impacted into the early summer, as output remained at less than one-half its pre-pandemic level.
Oil and gas extraction weighed on the recovery in goods production
While increases in construction and manufacturing supported the rebound in goods production, oil and gas extraction has edged lower in the aftermath of the shutdowns, while the weaker investment outlook led many firms to substantially revise their capital plans. Both oil sands output and conventional oil and gas extraction have trended lower in recent months. Oil sands production declined steadily from April to July, falling about 13% below pre-pandemic levels. Conventional oil and gas extraction in July was about 10% below pre-pandemic levels. More notable has been the decline in support activities for mining and oil gas extraction, which include rigging and drilling services. These support activities are strongly correlated with investment conditions in the energy sector, and have fallen off sharply since the onset of the pandemic. Despite a double-digit increase in July, support activities for mining and oil and gas extraction were about 70% below pre-pandemic levels.Note
Employment continues to recover, bolstered by strong gains in September
The recovery in employment slowed during the summer months, before accelerating in September. In June, employment was still 1.8 million below pre-COVID levels, as the unemployment rate fell to 12.3% after reaching a record high in May (13.7%). Employment gains then slowed during July (+419,000) and August (+246,000) as reopening efforts continued across the country. Total employment in August remained 1.1 million below pre-COVID levels as the unemployment rate declined to 10.2%.
Stronger job gains in September (+378,000) brought employment to within 720,000 of February’s level, as the unemployment rate fell to 9.0% (Chart 3). Most of the net employment losses from February to September were full-time work, and three-quarters of these net losses were in accommodation and food services, retail trade, construction, and transportation and warehousing. About 1.8 million Canadians were unemployed in September, compared to 1.1 million prior to the pandemic. At the same time, the number of Canadian workers still impacted by COVID-19, due to employment losses or substantial reductions in hours worked, declined to 1.3 million, after peaking at 5.5 million during the shutdowns in April. Among Canadians who worked most of their usual hours in September, about one-quarter reported working from home.
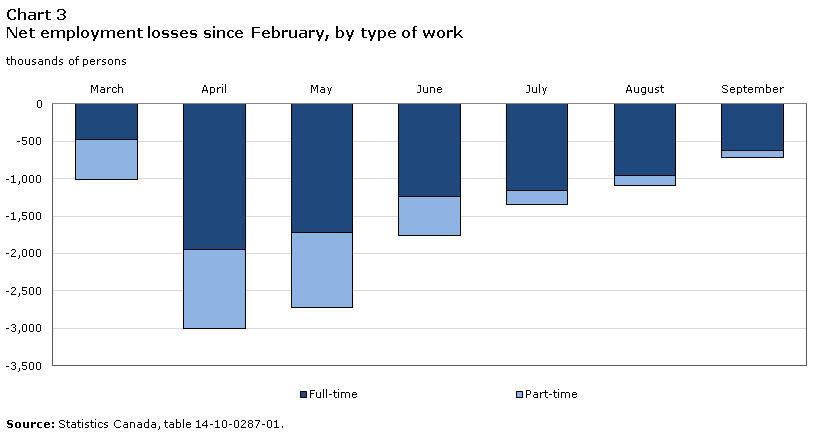
Data table for Chart 3
| Full-time | Part-time | |
|---|---|---|
| thousands of persons | ||
| March | -474 | -537 |
| April | -1,946 | -1,059 |
| May | -1,727 | -988 |
| June | -1,239 | -524 |
| July | -1,165 | -178 |
| August | -960 | -138 |
| September | -626 | -94 |
| Source: Statistics Canada, table 14-10-0287-01. | ||
Much attention since the onset of the pandemic has focused on the disproportionately large impacts of the shutdowns on specific groups, including lower-wage and less educated workers, temporary workers, recent immigrants, diverse communities, recent immigrants, women and younger workers. (For detailed information on the unevenness of the recovery across population groups, see (The Social and Economic Impacts of COVID-19: A Six-Month Update, slides 50 to 61).
The labour market impacts of the pandemic on specific population groups continue to evolve five months into the recovery period. While women were harder hit by job losses early during the lockdowns, their employment gains since early summer have outpaced gains among men. The net employment losses of 720,000 from February to September were split evenly between men and women, and full-time work among both men and women in September was 4% below pre-pandemic levels. While labour force participation has declined more rapidly among women during the pandemic, unemployment, which includes job searchers and those on temporary layoff, has risen more sharply among men.

Data table for Chart 4
| Indexed employment level during COVID-19 economic shutdown (April 2020) | Indexed employment level during current reference month (September 2020) | |
|---|---|---|
| index (February 2020=100) | ||
| Youth: male | 70 | 90 |
| Youth: female | 62 | 90 |
| Core-age: male | 88 | 98 |
| Core-age: female | 87 | 98 |
| Older: male | 87 | 97 |
| Older: female | 86 | 95 |
|
Note: Youth: 15 to 24 year-olds; Core-age: 25 to 54 year-olds; Older: 55 year- olds and over. Source: Statistics Canada, table 14-10-0287-01. |
||
Younger workers remain among those most visibly impacted by COVID-19 (Chart 4). From February to April, employment among 15 to 24 year-olds fell by over 870,000, losses that amount to about one-third of their pre-pandemic workforce. While youth employment has risen steadily since the economy began to reopen, employment among 15 to 24 year-olds, as of September, remained about 10% below pre-pandemic levels, with losses split evenly between young men and young women. Much of the recovery in youth employment into the summer months was concentrated in part-time, as full-time work among youth remained almost one-quarter below February levels. This changed markedly in September, as full-time work among young Canadians rose by over 150,000. September’s increase in full-time work coincided with notable gains in accommodation and food services and information, cultural and recreation services, industries that employ large numbers of young workers. Despite these gains, the unemployment rate among young men in September stood at 20.5%, almost twice the rate observed in February, while the rate among young women stood at 17.2%.
New research shows that the sharp deterioration in labour market conditions for young workers can be expected to adversely impact their cumulative earnings in the years following the pandemic, irrespective of basic differences in education attainment (see Frenette 2020 and The Social and Economic Impacts of COVID-19: A Six-Month Update, slide 60). The sharp decline in youth employment also coincides with a notable deterioration in their reported mental health. In July, 40% of young Canadians reported that they were in very good or excellent mental health, down from 60% prior to the pandemic. Declines in mental health among young Canadians were the largest among the age groups examined (The Social and Economic Impacts of COVID-19: A Six-Month Update, slide 30).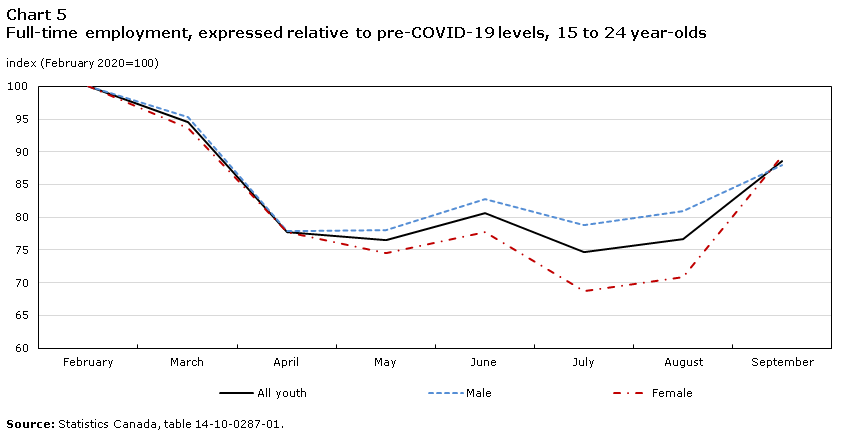
Data table for Chart 5
| All youth | Male | Female | |
|---|---|---|---|
| index (February 2020=100) | |||
| February | 100.0 | 100.0 | 100.0 |
| March | 94.6 | 95.3 | 93.6 |
| April | 77.8 | 77.8 | 77.8 |
| May | 76.5 | 78.0 | 74.5 |
| June | 80.7 | 82.8 | 77.7 |
| July | 74.6 | 78.8 | 68.7 |
| August | 76.7 | 80.9 | 70.9 |
| September | 88.5 | 87.9 | 89.3 |
| Source: Statistics Canada, table 14-10-0287-01. | |||
The recovery in employment has been more rapid among core-age workers. Following losses of nearly 1.6 million during the shutdowns, employment among 25 to 54 year-olds has risen steadily as businesses continue to reopen, reducing their net losses since the onset of the pandemic to 282,000. Employment among core-age men in September was 2.4% below pre-pandemic levels, and 2.1% below among core-age women. Their unemployment rates were 7.6% and 7.0%, respectively.
A slower recovery among low-wage workers
Employment among lower-wage workers was severely impacted during the lockdowns, falling by almost 40% from February to April.Note The decline among other (higher) paid employees, by comparison, was 13%. While many low-paid jobs have been recovered as the economy reopens, the vast majority of net losses that remain four months after the shutdowns reflect declines among lower paid workers.
The number of low-wage employees in September was down 761,000, or 22.1%, from levels reported in September of 2019. Almost one-half of the decline reflected losses in retail, accommodation and food services, and business, building and other support services.Note In contrast, the number of other paid employees has risen by nearly 300,000 in the twelve months to September.
Low-wage workers, especially those with lower levels of educational attainment and more restrictive workplace arrangements, are likely at a much higher risk of job transformation due to automation, which could be expected to accelerate as a result of the pandemic. These risks vary substantially by level of education. About 25% of workers with a high school education are at risk of job-related transformation due to automation, compared to less than 5% of those with a Bachelor’s degree (see Frank and Frenette, 2020 and The Social and Economic Impacts of COVID-19: A Six-Month Update, slide 61). This is one factor that may influence whether short-term layoffs become permanent job losses, which can substantially reduce the long-term earnings of affected workers (Ching et al., 2020 and The Social and Economic Impacts of COVID-19: A Six-Month Update, slide 59).
Steep challenges facing many firms as business conditions remain uncertain
The recovery in jobs in many consumer-oriented sectors may also depend in large part on the extent to which businesses can remain economically viable once the income and wage supports and rent deferrals begin to wind down. Data on business conditions collected as the economy was starting to reopen underscore the financial challenges facing many firms. Nearly one-quarter of businesses with rent or mortgage payments had been granted deferrals.Note Many small firms have also taken on debt to meet their financial obligations as a result of the pandemic.Note At the same time, businesses in most industrial sectors have scaled back their capital plans in light of COVID-19, as stresses on business cash flows are likely to persist. Prior to COVID-19, capital outlays by private sector businesses were expected to edge up 0.9% in 2020. New information collected in June and July now show that private capital outlays are expected to fall by 16.6% (Chart 6).
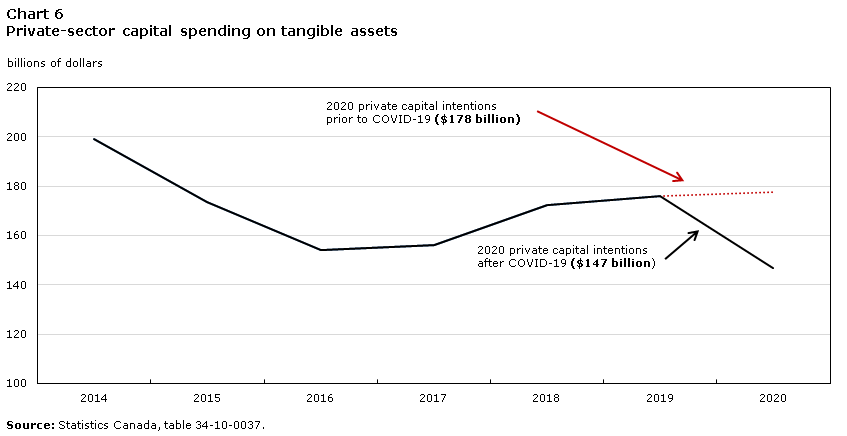
Data table for Chart 6
| 2014 | 2015 | 2016 | 2017 | 2018 | 2019 | 2020 | |
|---|---|---|---|---|---|---|---|
| billions of dollars |
|||||||
| Private capital spending (2020 original intentions) | 198.9 | 173.4 | 153.9 | 156.1 | 172.2 | 176.0 | 177.6 |
| Private capital spending (2020 revised intentions) | 198.9 | 173.4 | 153.9 | 156.1 | 172.2 | 176.0 | 146.8 |
| Source: Statistics Canada, table 34-10-0037. | |||||||
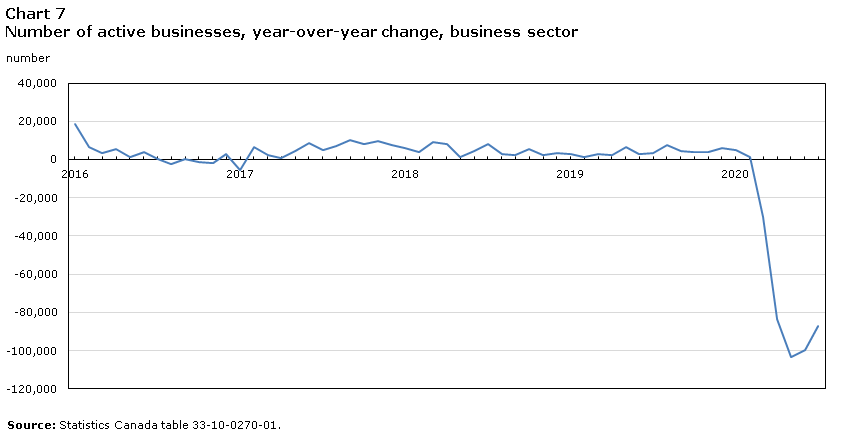
New monthly data on business openings and closures underscore the amount of turbulence that exists as firms navigate the recovery period. During the lockdown in April, 88,000 businesses that were operating in March closed their doors. The number of closures from April to May slowed to 60,500, and then edged down to 55,300 from May to June. Business closures slowed to 36,500 in July, comparable to levels observed prior to the pandemic.
Data table for Chart 7
| 2016 | 2017 | 2018 | 2019 | 2020 | |
|---|---|---|---|---|---|
| number | |||||
| January | 18,401 | -5,577 | 5,744 | 2,983 | 4,990 |
| February | 6,290 | 6,338 | 4,117 | 1,321 | 1,221 |
| March | 3,499 | 2,406 | 9,137 | 2,929 | -30,090 |
| April | 5,391 | 567 | 8,049 | 2,210 | -83,424 |
| May | 1,218 | 4,568 | 1,411 | 6,720 | -103,511 |
| June | 3,839 | 8,746 | 4,472 | 2,615 | -99,850 |
| July | -11 | 5,041 | 8,027 | 3,392 | -87,296 |
| August | -2,147 | 6,889 | 2,882 | 7,474 | Note ..: not available for a specific reference period |
| September | 59 | 10,193 | 2,278 | 4,591 | Note ..: not available for a specific reference period |
| October | -1,098 | 8,283 | 5,259 | 3,779 | Note ..: not available for a specific reference period |
| November | -1,615 | 9,577 | 2,281 | 4,106 | Note ..: not available for a specific reference period |
| December | 2,916 | 7,352 | 3,487 | 5,898 | Note ..: not available for a specific reference period |
|
.. not available for a specific reference period Source: Statistics Canada table 33-10-0270-01. |
|||||
At the same time, the number of openings rose sharply from May to June as restrictions across the country continued to ease. Openings edged down slightly in July to 52,300. The large number of net closures observed from March to May resulted in a substantial decrease in the number of active businesses. In July, just over 712,000 employer businesses were operating in the business sector, over 87,000 less than in July of 2019 (Chart 7). The openings and closures data also show that over 17% of businesses that were active in February closed during March and April. Of those businesses that closed, one-half had reopened by July. New data on openings and closures over the coming months will be critical for evaluating the economic recovery.
References
Aston, J. et al. July 24, 2020. Retail e-commerce and COVID-19: How on-line shopping opened doors while many were closing. StatCan COVID-19: Data to insights for a better Canada. Catalogue 45-28-0001. Ottawa: Statistics Canada.
Chen, W-H. and T. Mehdi. 2018. Assessing Job Quality in Canada: A Multidimensional Approach. Analytical Studies Branch Research Paper Series. Catalogue No. 11F0019M, no. 412. Ottawa: Statistics Canada.
Ching, P. et al. June 10, 2020. COVID-19 and job displacement: Thinking about the longer term. StatCan COVID-19: Data to insights for a better Canada. Catalogue 45-28-0001. Ottawa: Statistics Canada.
Deng, Z., R. Morissette and D. Messacar. May 28, 2020. Running the economy remotely: Potential for working at home during and after COVID-19. StatCan COVID-19: Data to insights for a better Canada. Catalogue 45-28-0001. Ottawa: Statistics Canada.
Frank, K. and M. Frenette. June 29, 2020. Automation, workers and COVID-19. StatCan COVID-19: Data to insights for a better Canada. Catalogue 45-28-0001. Ottawa: Statistics Canada.
Frenette, M., D. Messacar, and T. Handler. July 28, 2020. To what extent might COVID-19 affect the earnings of the class of 2020? StatCan COVID-19: Data to insights for a better Canada. Catalogue 45-28-0001. Ottawa: Statistics Canada.
Hou, F. August 20, 2020. Transitions into and out of employment by immigrants during the COVID-19 lockdown and recovery. StatCan COVID-19: Data to insights for a better Canada. Catalogue 45-28-0001. Ottawa: Statistics Canada.
Messacar, D., Morissette, R. and Z. Deng. June 8, 2020. Inequality and the feasibility of working from home during and after COVID-19. Data to insights for a better Canada. Catalogue 45-28-0001. Ottawa: Statistics Canada.
Statistics Canada. 2020. The Social and Economic Impacts of COVID-19: A Six-Month Update, Ottawa: Statistics Canada.
Verma, R. and R. Husain. October 5, 2020. The resilience and strength on the new housing market during the pandemic. StatCan COVID-19: Data to insights for a better Canada. Catalogue 45-28-0001. Ottawa: Statistics Canada.
Wang, W. July 8, 2020. Canada’s oil and gas sector: The decline in production and investment and the impact on the economy. StatCan COVID-19: Data to insights for a better Canada. Catalogue 45-28-0001. Ottawa: Statistics Canada.
Further reading
Gellatly, G. 2020. Recent Developments in the Canadian Economy, 2020: COVID-19, first edition. Economic Insights no. 104. Statistics Canada Catalogue no. 11-626-X. Ottawa: Statistics Canada.
Gellatly, G. and C. McCormack. 2020. Recent Developments in the Canadian Economy, 2020: COVID-19, second edition. Economic Insights no. 106. Statistics Canada Catalogue no. 11-626-X Ottawa: Statistics Canada.
Clarke, S., C. McCormack, and W. Asghar. 2020. Recent Developments in the Canadian Economy, 2020: COVID-19, third edition. Economic Insights no. 115. Statistics Canada Catalogue no. 11-626-X Ottawa: Statistics Canada.
- Date modified: