
Economic Insights
How Do Workers Displaced from Traditional Energy-producing Sectors Fare after Job Loss? Evidence from Coal Mining

Archived Content
Information identified as archived is provided for reference, research or recordkeeping purposes. It is not subject to the Government of Canada Web Standards and has not been altered or updated since it was archived. Please "contact us" to request a format other than those available.
This Economic Insights article examines how workers displaced from coal mining in recent years have fared after job loss. The analysis uses Statistics Canada’s Longitudinal Worker File. The study shows that for many coal miners and workers in other industries, job loss leads to substantial and persistent earnings declines. However, three years or five years after being displaced, a significant fraction of workers displaced from coal mining or other industries earn more than they did in the year prior to job loss. Taken together, these findings do not support the view that all workers displaced from traditional energy-producing sectors experience substantial earnings declines after job loss. Nor do they support the view that all workers displaced from these sectors make a smooth transition to new employment after job loss.
Efforts to help Canadian firms and workers make a transition to a low-carbon economy raise the following question: how do workers displaced from traditional energy-producing sectors (e.g. oil and gas, coal-fired power plants) or industries that provide input for these sectors (e.g. coal mining) fare after job loss? Does job loss lead most of these displaced workers to experience a substantial decline in real earnings in the short term and medium term or do most displaced workers make smooth transitions to new employment after job loss? The answer to this question is currently unknown and is important because it informs discussions regarding the difficulties (or lack thereof) faced by workers displaced from these sectors to adjust to job loss.
One view is that, hopefully, workers displaced from traditional energy-producing sectors might be able to make smooth transitions to “green” sectors such as solar panel industries or recycling industries and might not suffer serious financial consequences as a result of the loss of their jobs. An alternative view is that some workers in traditional energy-producing industries might lack the skills needed to obtain new employment in dynamic sectors and therefore, might be unable to find relatively well-paying jobs after being displaced. Hence, whether workers displaced from traditional energy-producing sectors or industries that provide input for these sectors experience substantial earnings declines in the years following job loss is an empirical question.
The goal of this paper is to answer this question for a specific group of workers: those who were displaced from coal mining in recent years. To do so, the study uses Statistics Canada’s Longitudinal Worker File (LWF), a rich administrative data that covers virtually all employees in Canada. The study covers the 1995-to-2015 period and focuses on permanent layoffs, which capture job losses.Note
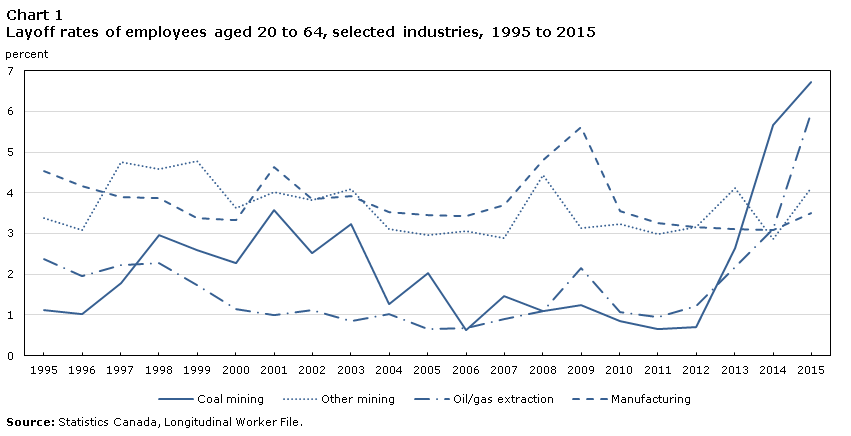
From the mid-1990s to the early 2010s, layoff rates in coal mining were relatively low
For all years of the 1995-to-2015 period except 2014 and 2015, layoff rates in coal mining were lower than those observed in manufacturing or other mining industries (Chart 1). For example, layoff rates in coal mining amounted to 2.3% in 2000, compared with 3.3% in manufacturing, and 3.6% in all industries as well as in other mining industries. The sharp rise in layoff rates in coal mining in 2015 reversed this pattern. By 2015, layoff rates in coal mining were, at 6.7%, at least 2.5 percentage points higher than those observed in manufacturing or other mining industries. The sharp increase in layoff rates in coal mining after 2013 coincided with a substantial increase in layoff rates in oil and gas extraction, which in turn was associated with a decrease in oil prices.Note
Data table for Chart 1
| Coal mining | Other mining | Oil/gas extraction | Manufacturing | |
|---|---|---|---|---|
| percent | ||||
| 1995 | 1.1 | 3.4 | 2.4 | 4.5 |
| 1996 | 1.0 | 3.1 | 2.0 | 4.2 |
| 1997 | 1.8 | 4.8 | 2.2 | 3.9 |
| 1998 | 3.0 | 4.6 | 2.3 | 3.9 |
| 1999 | 2.6 | 4.8 | 1.7 | 3.4 |
| 2000 | 2.3 | 3.6 | 1.2 | 3.3 |
| 2001 | 3.6 | 4.0 | 1.0 | 4.6 |
| 2002 | 2.5 | 3.8 | 1.1 | 3.8 |
| 2003 | 3.2 | 4.1 | 0.9 | 3.9 |
| 2004 | 1.3 | 3.1 | 1.0 | 3.5 |
| 2005 | 2.0 | 3.0 | 0.7 | 3.5 |
| 2006 | 0.6 | 3.1 | 0.7 | 3.4 |
| 2007 | 1.5 | 2.9 | 0.9 | 3.7 |
| 2008 | 1.1 | 4.4 | 1.1 | 4.8 |
| 2009 | 1.3 | 3.1 | 2.1 | 5.6 |
| 2010 | 0.9 | 3.2 | 1.1 | 3.5 |
| 2011 | 0.6 | 3.0 | 0.9 | 3.3 |
| 2012 | 0.7 | 3.2 | 1.2 | 3.2 |
| 2013 | 2.7 | 4.1 | 2.2 | 3.1 |
| 2014 | 5.7 | 2.9 | 3.1 | 3.1 |
| 2015 | 6.7 | 4.1 | 6.0 | 3.5 |
| Source: Statistics Canada, Longitudinal Worker File. | ||||
Most displaced coal miners found a job in the year following job loss
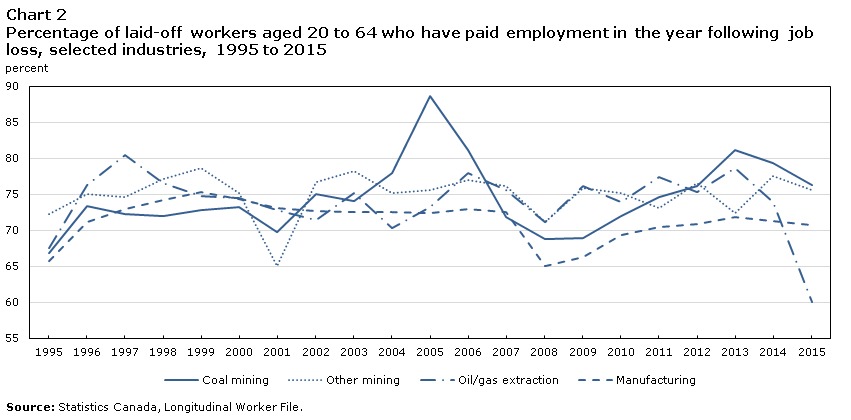
Most coal miners displaced over the 1995-to-2015 period found a paid job in the year following job loss. The percentage of laid-off workers with paid employment in the year following job loss ranged from 67% for workers laid-off in 1995 to 89% for those laid-off in 2005 (Chart 2). Over the 1995-to-2015 period, on average 75% of workers laid-off from coal mining had paid employment in the year following job loss. The corresponding averages amount to about 72% in the aggregate and for manufacturing and to about 75% in oil and gas extraction and other mining industries.
Of all coal miners laid-off in 1995-2000 and 2010-2015 and re-employed in the year following job loss, about one-fifth found paid employment in mining, quarrying, oil and gas extraction in the year following job loss (Table 1). Another 20 percent found paid employment in highly skilled service industries.Note The industries of employment in the new job were fairly similar—at least when considering broad industrial groupings—for workers laid-off from coal mining and for their counterparts laid-off from other mining industries. Relative to these two groups of workers, employees displaced from oil and gas extraction were more likely to be re-employed in mining, quarrying, oil and gas extraction or highly skilled services in the year following job loss and, in 2010-2015, less likely to be re-employed in construction. As expected, workers displaced from manufacturing firms were more likely than those displaced from coal mining, other mining industries or mining, oil and gas extraction to be re-employed in manufacturing.
Data table for Chart 2
| Coal mining | Other mining | Oil/gas extraction | Manufacturing | |
|---|---|---|---|---|
| percent | ||||
| 1995 | 66.8 | 72.3 | 67.5 | 65.8 |
| 1996 | 73.4 | 75.0 | 76.3 | 71.2 |
| 1997 | 72.3 | 74.6 | 80.4 | 73.0 |
| 1998 | 72.0 | 77.2 | 76.6 | 74.2 |
| 1999 | 72.8 | 78.6 | 74.8 | 75.3 |
| 2000 | 73.3 | 75.2 | 74.5 | 74.3 |
| 2001 | 69.8 | 65.1 | 72.8 | 73.1 |
| 2002 | 75.0 | 76.7 | 71.5 | 72.7 |
| 2003 | 74.1 | 78.2 | 75.2 | 72.6 |
| 2004 | 78.0 | 75.2 | 70.3 | 72.6 |
| 2005 | 88.6 | 75.6 | 73.3 | 72.4 |
| 2006 | 81.1 | 77.0 | 78.0 | 72.9 |
| 2007 | 71.9 | 76.2 | 75.6 | 72.5 |
| 2008 | 68.8 | 71.2 | 71.1 | 65.1 |
| 2009 | 69.0 | 75.9 | 76.1 | 66.3 |
| 2010 | 72.0 | 75.2 | 74.0 | 69.4 |
| 2011 | 74.7 | 73.1 | 77.4 | 70.4 |
| 2012 | 76.1 | 76.6 | 75.3 | 70.9 |
| 2013 | 81.1 | 72.4 | 78.6 | 71.9 |
| 2014 | 79.4 | 77.6 | 74.0 | 71.3 |
| 2015 | 76.3 | 75.6 | 60.0 | 70.8 |
| Source: Statistics Canada, Longitudinal Worker File. | ||||
| Industry of new job | Mining, oil and gas extraction | Construction | Manufacturing | Highly skilled services | Low-skilled services | PEHSTable 1 Note 1 | Other industries | Overall |
|---|---|---|---|---|---|---|---|---|
| percent | ||||||||
| Workers laid-off from coal mining | ||||||||
| 1995-2000 | 18.4 | 13.1 | 14.3 | 21.5 | 8.8 | 11.3 | 12.7 | 100.0 |
| 2010-2015 | 22.2 | 16.8 | 11.8 | 20.3 | 8.0 | 10.7 | 10.3 | 100.0 |
| Change | 3.8 | 3.7 | -2.5 | -1.3 | -0.8 | -0.5 | -2.5 | Note ...: not applicable |
| Workers laid-off from other mining industries | ||||||||
| 1995-2000 | 19.1 | 18.6 | 14.4 | 19.1 | 7.0 | 8.7 | 13.2 | 100.0 |
| 2010-2015 | 18.2 | 20.1 | 11.2 | 20.3 | 8.7 | 9.6 | 11.8 | 100.0 |
| Change | -0.9 | 1.6 | -3.2 | 1.2 | 1.8 | 0.9 | -1.4 | Note ...: not applicable |
| Workers laid-off from oil and gas extraction | ||||||||
| 1995-2000 | 28.1 | 12.1 | 9.4 | 26.1 | 7.3 | 6.9 | 10.1 | 100.0 |
| 2010-2015 | 27.8 | 9.9 | 6.3 | 28.6 | 7.1 | 10.3 | 9.9 | 100.0 |
| Change | -0.3 | -2.2 | -3.0 | 2.5 | -0.2 | 3.4 | -0.2 | Note ...: not applicable |
| Workers laid-off from manufacturing | ||||||||
| 1995-2000 | 1.4 | 10.5 | 37.3 | 18.5 | 11.4 | 5.8 | 15.2 | 100.0 |
| 2010-2015 | 1.5 | 13.4 | 28.4 | 22.5 | 12.5 | 6.8 | 14.9 | 100.0 |
| Change | 0.2 | 2.9 | -8.8 | 4.0 | 1.1 | 0.9 | -0.3 | Note ...: not applicable |
| Workers laid-off from highly skilled services | ||||||||
| 1995-2000 | 1.6 | 9.8 | 12.7 | 40.3 | 12.3 | 9.9 | 13.4 | 100.0 |
| 2010-2015 | 1.7 | 10.5 | 8.8 | 44.1 | 12.9 | 9.9 | 12.0 | 100.0 |
| Change | 0.1 | 0.7 | -3.9 | 3.8 | 0.7 | 0.0 | -1.5 | Note ...: not applicable |
| Workers laid-off from low skilled services | ||||||||
| 1995-2000 | 0.6 | 4.3 | 9.7 | 17.0 | 45.1 | 9.0 | 14.3 | 100.0 |
| 2010-2015 | 0.7 | 5.2 | 5.9 | 17.6 | 47.5 | 10.0 | 13.2 | 100.0 |
| Change | 0.1 | 0.9 | -3.8 | 0.5 | 2.4 | 1.0 | -1.1 | Note ...: not applicable |
... not applicable
Source: Statistics Canada, Longitudinal Worker File. |
||||||||
Along with other displaced workers, about half of coal miners displaced from 2004 to 2011 experienced at least a 30% drop in earnings in the short term
A key issue regarding job displacement is whether which displaced workers experience substantial and persistent earnings losses (Jacobson, Lalonde, and Sullivan, 1993; Morissette, Zhang and Frenette, 2007; Morissette, Qiu and Chan, 2013; Morissette and Qiu, 2020). If earnings falls shortly after job loss, do they recover quickly or does it take several years before workers earn their pre-displacement wages? Answering these questions is crucial to get a sense of the magnitude of the adjustments costs that displaced workers face.
Table 2 investigates this issue and shows the percentage changes in real annual wages and salaries experienced by displaced coal mining workers. Percentage changes in real annual wages are shown from the year preceding job loss to: a) the year following job loss; b) three years after job loss; c) five years after job loss. Because job loss may lead to long spells of non-employment, laid-off workers who have no employment income after job loss are included in the analysis as long as they filed an income tax form in the years following displacement. To rule out concerns about early retirement five years after job loss, the sample is restricted to workers who are aged 25 to 49 at the time of job loss (and thus, who are aged 30 to 54 five years after job loss).Note
Table 2 shows that the median percentage declines in the annual wages and salaries of workers laid-off from coal mining firms from 2004 to 2011 amounted to 32% from the year preceding job loss to the year following job loss. The corresponding declines of workers laid-off from other industries were, at 33%, similar. These numbers imply that about half of workers laid-off from coal mining and from other industries during the 2004-to-2011 period saw their annual wages and salaries drop by at least 30% in the short term.
Since coal miners are paid higher-than-average wagesNote , their median annual wages and salaries fell by a greater amount during that period. As Table 3 shows, the median declines in annual wages and salaries of coal miners displaced from 2004 to 2011 amounted to roughly $14,800 (in 2016 dollars) in the short term, more than twice the median declines (of about $6,100) experienced by other laid-off workers.Note
| Percentile of the earnings change distribution | Year t-1 to year t+1 | Year t-1 to year t+3 | Year t-1 to year t+5 | ||||||
|---|---|---|---|---|---|---|---|---|---|
| 25th | 50th | 75th | 25th | 50th | 75th | 25th | 50th | 75th | |
| percent | |||||||||
| Laid-off from coal mining | |||||||||
| 1995 to 2003 | -96.4 | -58.7 | -12.0 | -67.9 | -21.9 | 25.2 | -60.9 | -7.7 | 43.6 |
| 2004 to 2011 | -80.5 | -32.4 | 7.2 | -48.8 | 1.6 | 53.5 | -49.3 | 11.1 | 73.1 |
| Laid-off from all other industries | |||||||||
| 1995 to 2003 | -92.2 | -31.0 | 28.4 | -65.5 | 1.3 | 82.8 | -61.8 | 11.7 | 109.9 |
| 2004 to 2011 | -92.7 | -32.8 | 24.4 | -67.2 | -2.2 | 72.7 | -67.1 | 4.5 | 91.0 |
|
Note: Workers laid-off in year t and who had positive annual wages and salaries in year t-1 and filed a tax form in t+x, x = 1, 3, 5. Includes laid-off workers who had no wages and salaries in year t+x. Workers who earned more than $500,000 (in 2016 dollars) in any of these years are dropped. Source: Statistics Canada, Longitudinal Worker File. |
|||||||||
| Percentile of the earnings change distribution | Year t-1 to year t+1 | Year t-1 to year t+3 | Year t-1 to year t+5 | ||||||
|---|---|---|---|---|---|---|---|---|---|
| 25th | 50th | 75th | 25th | 50th | 75th | 25th | 50th | 75th | |
| 2016 dollars | |||||||||
| Laid-off from coal mining | |||||||||
| 1995 to 2003 | -56,828 | -27,973 | -4,431 | -37,053 | -10,863 | 11,322 | -32,573 | -3,936 | 20,910 |
| 2004 to 2011 | -39,218 | -14,769 | 4,108 | -24,657 | 1,018 | 23,222 | -19,373 | 6,152 | 30,869 |
| Laid-off from all other industries | |||||||||
| 1995 to 2003 | -18,002 | -4,931 | 4,773 | -11,752 | 282 | 14,187 | -10,531 | 2,608 | 18,956 |
| 2004 to 2011 | -20,867 | -6,105 | 4,940 | -13,852 | -370 | 15,048 | -13,073 | 1,176 | 19,020 |
|
Note: Workers laid-off in year t and who had positive annual wages and salaries in year t-1 and filed a tax form in t+x, x = 1, 3, 5. Includes laid-off workers who had no wages and salaries in year t+x. Workers who earned more than $500,000 (in 2016 dollars) in any of these years are dropped. Source: Statistics Canada, Longitudinal Worker File. |
|||||||||
Tables 2 and 3 also highlight the diversity of earnings changes experienced by laid-off workers. Of all workers laid-off from coal mining from 2004 to 2011, one quarter saw their earnings drop by at least $39,200 in the short term. The corresponding amount for workers laid-off from other industries equals roughly $20,900.
In contrast, one laid-off coal miner out of four saw their earnings increase by at least $4,100 from the year preceding job loss to the year following job loss. Similarly, one quarter of workers laid-off from other industries saw their earnings increase by at least $4,900 in the short term. Hence, the majority but not all laid-off workers experience earnings declines in the short run.
Although earnings changes are more favourable in the longer term, many displaced workers—coal miners or other workers—experience earnings declines five years after job loss
As time following job loss increases, displaced workers have greater opportunities to look for alternative jobs. For this reason, one would expect their earnings changes to be more favorable in the medium term than they are in the short run.
Tables 2 and 3 confirm that this is the case. Table 3 shows that three years after job loss, the median change in earnings experienced by coal miners displaced from 2004 to 2011 was, at about $1,000, slightly positive. The corresponding median change in earnings for their counterparts laid-off from other industries amounted to roughly -$400.
Nevertheless, one quarter of coal miners laid-off from 2004 to 2011 saw their annual wages and salaries drop by at least $24,700 three years after job loss. Since Employment Insurance benefits generally cover laid-off workers for only about one year, this finding implies that, for a significant group of displaced coal miners, substantial earnings declines persist even after EI benefits have been exhausted.
The persistence of earnings declines for some displaced workers is observed even five years after job loss. Of all coal miners laid-off from 2004 to 2011, one quarter saw their annual wages and salaries drop by at least $19,400 five years after job loss.Note Likewise, of all workers laid-off from other industries from 2004 to 2011, one quarter saw their annual wages and salaries drop by at least $13,100 during that period. At the other end of the spectrum, one quarter of all laid-off workers—displaced from coal mining or other industries—saw their annual wages and salaries increase by at least $19,000 from the year preceding job loss to the fifth year after job loss.
Taken together, the numbers shown in Tables 2 and 3 highlight the fact that the financial consequences of job loss are not uniform for all displaced workers. This is true whether one considers workers laid-off from 2004 to 2011 or those laid-off from 1995 to 2003. Whether they lose their job from coal mining industries or other industries, not all displaced workers experience earnings declines. However, even five years after job loss, a significant proportion of displaced workers end up with substantially lower earnings than they had prior to job loss (Morissette and Qiu, 2020).
It should be emphasized that the numbers shown in Tables 2 and 3 highlight only the observed earnings declines experienced by laid-off workers: they do not incorporate the earnings growth displaced workers would have experienced in the absence of job loss. As such, the earnings declines shown in Tables 2 and 3 represent a lower bound for the earnings losses (i.e. earnings declines plus foregone earnings growth) of workers displaced from coal mining industries or other industries.
Conclusion
Efforts to make a transition to a low carbon economy have raised concerns that workers displaced from traditional energy-producing sectors might experience substantial earnings declines after job loss. A more optimistic view is that workers displaced from these sectors might be able to make smooth transitions to “green” sectors such as solar panel industries or recycling industries and might not suffer serious financial consequences as a result of the loss of their jobs.
To shed light on this issue, this study documents the employment and earnings trajectories of coal miners who were displaced during the late 1990s and the 2000s. The results indicate that for many coal miners and other workers, job loss leads to substantial and persistent earnings declines.
That being said, the numbers make it clear that the financial consequences of job loss are not uniform for all displaced workers. Whether they lose their job from coal mining industries or other industries, not all displaced workers experience earnings declines. Three years after job loss or five years after job loss, a significant fraction of displaced workers earn more than they did in the year prior to job loss.
A few limitations must be noted. First, the study quantifies the earnings declines and earnings gains observed after displacement but does not incorporate in the calculations the earnings growth foregone due to job loss. Second, the question of which groups of workers experience substantial earnings declines or gains is not investigated and is left for further research.
Despite these limitations, the study paints a nuanced picture of the post-displacement outcomes of workers laid-off from coal mining industries. This nuanced picture does not support the view that all workers displaced from traditional energy-producing sectors experience substantial earnings declines after job loss. Nor does it support the view that all workers displaced from these sectors make a smooth transition to new employment after job loss.
References
Jacobson, L. S., R. J. Lalonde, and D. G. Sullivan. 1993. ‘Earnings Losses of Displaced Workers,’ American Economic Review 83: 685–709.
Morissette, R., X. Zhang, and M. Frenette. 2007. “Earnings Losses of Displaced Workers: Canadian Evidence from a Large Administrative Database on Firm Closures and Mass Layoffs”, Statistics Canada catalogue no. 11F0019M, Analytical Studies Branch Research Paper Series. No. 291.
Morissette, R., H. Qiu, and P.C.W. Chan. 2013. “The risk and cost of job loss in Canada, 1978–2008.” Canadian Journal of Economics 46 (4): 1480–1509.
Morissette, R. and H. Qiu. 2020. Turbulence or Steady Course? Permanent Layoffs in Canada, 1978-2016. IRPP Study 76. Montreal: Institute for Research on Public Policy.
- Date modified: