
Economic Insights
How Do Workers Displaced from Energy-producing Sectors Fare after Job Loss? Evidence from the Oil and Gas Industry
Skip to text
Text begins
This Economic Insights article examines how workers displaced from the oil and gas industry in recent years have fared after job loss. The analysis uses Statistics Canada’s Longitudinal Worker File. The study shows that for many workers displaced from the oil and gas industry, job loss leads to substantial and persistent earnings declines. However, three years or five years after being displaced, a significant fraction of workers displaced from this sector earn more than they did in the year prior to job loss. Taken together, these findings do not support the view that all workers displaced from energy-producing sectors experience substantial earnings declines after job loss. Nor do they support the view that all workers displaced from these sectors make a smooth transition to new employment after job loss.
The last two decades have seen substantial movements in the price of oil and other commodities. Oil prices more than doubled from the early 2000s to 2008, fell during the 2008-2009 recession and dropped sharply after 2014. These price declines have led to increases in permanent layoff rates in the oil and gas industry in Canada, especially in recent years (Chart 1).
Oil prices also dropped sharply in March 2020 as a result of the COVID-19 pandemic and of the failure of Russia and Saudi Arabia to reach an agreement to limit production (Wang, 2020). These developments were associated with declines in employment in firms providing related support activities for mining, oil and gas extraction: from January 2020 to May 2020, the number of employees in these firms fell from roughly 71,600 to 51,500 (Statistics Canada, Table 14-10-0220-01).Note
Meanwhile, growing pressures to reduce greenhouse gas emissions have led some national governments to think about strategies aimed at reducing their economies’ reliance on sectors such as coal mining and oil and gas extraction. Taken together, these developments raise the following question: how do workers displaced from energy-producing sectors (e.g. oil and gas, coal-fired power plants) fare after job loss? Does job loss lead most of these displaced workers to experience a substantial decline in real earnings in the short term and medium term or do most displaced workers make smooth transitions from employment to employment after job loss? The answer to this question is currently unknown and is important since it informs discussions regarding the difficulties (or lack thereof) faced by workers displaced from these sectors while adjusting to job loss.
The goal of this paper is to answer this question for a specific group of workers: those who were displaced from the oil and gas industry in recent years. To do so, the study uses Statistics Canada’s Longitudinal Worker File (LWF), a rich administrative data that covers virtually all employees in Canada. The study covers the 1995-to-2016 period and focuses on permanent layoffs, which capture job losses.Note In this study, the oil and gas industry refers to the two following industries: a) oil and gas extraction; b) related support activities for mining, oil and gas extraction.Note The term “related support activities” is used to refer to employees or firms in related support activities for mining, oil and gas extraction.

Data table for Chart 1
| Price index | Permanent layoff rates (percent) | |
|---|---|---|
| 2000 | 100.0 | 5.5 |
| 2001 | 81.7 | 5.6 |
| 2002 | 76.2 | 5.8 |
| 2003 | 104.2 | 5.3 |
| 2004 | 125.7 | 5.2 |
| 2005 | 182.4 | 4.2 |
| 2006 | 180.5 | 4.7 |
| 2007 | 191.9 | 5.0 |
| 2008 | 259.0 | 7.4 |
| 2009 | 154.0 | 8.5 |
| 2010 | 194.3 | 5.1 |
| 2011 | 227.3 | 5.3 |
| 2012 | 204.1 | 5.6 |
| 2013 | 213.8 | 5.5 |
| 2014 | 212.3 | 5.2 |
| 2015 | 111.9 | 12.7 |
| 2016 | 98.0 | 10.3 |
|
Note: Permanent layoff rates among employees aged 20 to 64. Source: Statistics Canada, Longitudinal worker File; CANSIM Table 329-0074. |
||
From 2014 to 2015, permanent layoff rates in the oil and gas industry more than doubled
From 1995 to 2014, permanent layoff rates in the oil and gas industry hovered around 6%. As oil prices fell sharply after 2014, permanent layoff rates in this sector jumped, rising to 12.7% in 2015 and to 10.3% in 2016, compared with 5.2% in 2014. As a result, about 25,500 workers aged 20 to 64 lost their job in the oil and gas industry in 2015, up from 10,600 in 2014.
Rates of job loss were much lower in oil and gas extraction than in related support activities. From 1995 to 2016, permanent layoff rates in oil and gas extraction were on average about 8 percentage points lower than they were in related support activities (Chart 2).Note Part of the difference reflects the fact that large firms—which tend to have relatively low permanent layoff rates—are more predominant in oil and gas extraction than in related support activities.Note

Data table for Chart 2
| Oil and gas industry | Oil and gas extraction | Related support activities | |
|---|---|---|---|
| percent | |||
| 1995 | 6.9 | 2.4 | 11.6 |
| 1996 | 6.9 | 2.0 | 11.2 |
| 1997 | 6.2 | 2.2 | 9.3 |
| 1998 | 9.3 | 2.3 | 14.6 |
| 1999 | 6.4 | 1.7 | 10.5 |
| 2000 | 5.5 | 1.2 | 8.6 |
| 2001 | 5.6 | 1.0 | 9.0 |
| 2002 | 5.8 | 1.1 | 9.7 |
| 2003 | 5.3 | 0.9 | 8.1 |
| 2004 | 5.2 | 1.0 | 8.0 |
| 2005 | 4.2 | 0.7 | 6.5 |
| 2006 | 4.7 | 0.7 | 7.3 |
| 2007 | 5.0 | 0.9 | 7.9 |
| 2008 | 7.4 | 1.1 | 11.1 |
| 2009 | 8.5 | 2.1 | 13.2 |
| 2010 | 5.1 | 1.1 | 8.0 |
| 2011 | 5.3 | 0.9 | 8.0 |
| 2012 | 5.6 | 1.2 | 8.5 |
| 2013 | 5.5 | 2.2 | 8.1 |
| 2014 | 5.2 | 3.1 | 6.9 |
| 2015 | 12.7 | 6.0 | 18.3 |
| 2016 | 10.3 | 5.1 | 15.0 |
|
Note: Permanent layoff rates among employees aged 20 to 64. The oil and gas industry includes: a) oil and gas extraction, b) related support activities for mining, oil and gas extraction. Source: Statistics Canada, Longitudinal worker File. |
|||
Most workers displaced from the oil and gas industry found a job in the year following job loss
Most workers displaced from the oil and gas industry from 1995 to 2016 found a paid job in the year following job loss. However, the likelihood of having paid employment in the year following job loss varied over time. Less than two-thirds of the workers laid-off from oil and gas extraction in 2015 or 2016 had paid employment in the following year (Chart 3). In contrast, about three quarters of their counterparts laid-off from this sector from 1996 to 2014 managed to find a paid job in the year following job loss. These substantial differences suggest that that the degree to which workers displaced from the oil and gas industry succeed in the labour market shortly after job loss depends not only on macroeconomic conditions at the time of job displacement but also on the dynamism of the oil and gas industry.
Of all workers displaced from the oil and gas industry from 2005 to 2015 and re-employed in the year following job loss, the vast majority—roughly 80%—found new jobs outside the oil and gas industry (Table 1). Close to 29% found a new job in construction while about 18% and 7% found a new position in highly skilled servicesNote and manufacturing, respectively.
| Industry of new job | Coal mining or other mining | Oil and gas industry | Construction | Manufacturing | High-skilled services | Low-skilled services | Public administration, education and health | Other | Total |
|---|---|---|---|---|---|---|---|---|---|
| percent | |||||||||
| Oil and gas industryTable 1 Note 1 | 2.4 | 19.2 | 28.8 | 7.0 | 18.4 | 6.4 | 5.0 | 12.7 | 100.0 |
| Oil & gas extraction | 1.5 | 25.3 | 9.0 | 6.0 | 27.1 | 6.7 | 9.4 | 14.9 | 100.0 |
| Related support activities | 2.6 | 18.4 | 31.5 | 7.2 | 17.3 | 6.3 | 4.4 | 12.4 | 100.0 |
Source: Statistics Canada, Longitudinal Worker File. |
|||||||||
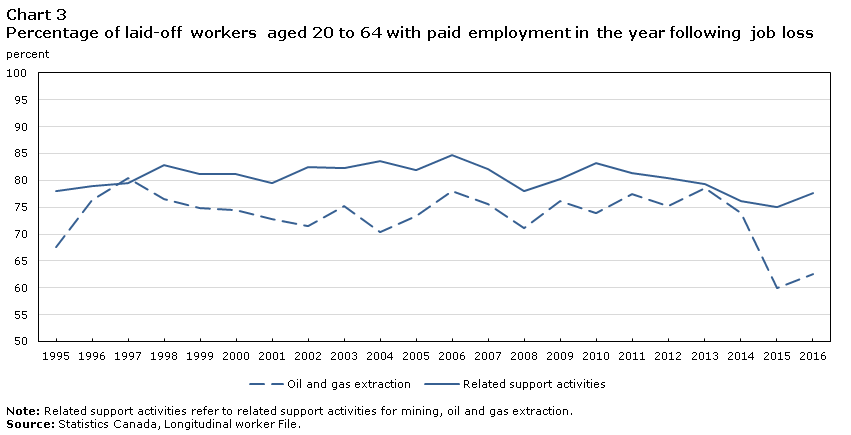
Data table for Chart 3
| Oil and gas extraction | Related support activities | |
|---|---|---|
| percent | ||
| 1995 | 67.5 | 78.1 |
| 1996 | 76.3 | 79.0 |
| 1997 | 80.4 | 79.6 |
| 1998 | 76.6 | 82.9 |
| 1999 | 74.8 | 81.2 |
| 2000 | 74.5 | 81.2 |
| 2001 | 72.8 | 79.6 |
| 2002 | 71.5 | 82.5 |
| 2003 | 75.2 | 82.3 |
| 2004 | 70.3 | 83.6 |
| 2005 | 73.3 | 81.9 |
| 2006 | 78.0 | 84.7 |
| 2007 | 75.6 | 82.2 |
| 2008 | 71.1 | 78.0 |
| 2009 | 76.1 | 80.2 |
| 2010 | 74.0 | 83.2 |
| 2011 | 77.4 | 81.4 |
| 2012 | 75.3 | 80.5 |
| 2013 | 78.6 | 79.4 |
| 2014 | 74.0 | 76.2 |
| 2015 | 60.0 | 75.1 |
| 2016 | 62.5 | 77.6 |
|
Note: Related support activities refer to related support activities for mining, oil and gas extraction. Source: Statistics Canada, Longitudinal worker File. |
||
About half of workers displaced from oil and gas extraction from 2009 to 2011 experienced at least a 30% drop in earnings in the short term
A key issue regarding job displacement is whether which displaced workers experience substantial and persistent earnings losses (Jacobson, Lalonde, and Sullivan, 1993; Morissette, Zhang and Frenette, 2007; Morissette, Qiu and Chan, 2013; Morissette and Qiu, 2020). If earnings falls shortly after job loss, do they recover quickly or does it take several years before workers earn their pre-displacement wages? Answering these questions is crucial to get a sense of the magnitude of the adjustments costs that displaced workers face.
Table 2 investigates this issue and shows the percentage changes in real annual wages and salaries experienced by workers displaced from the oil and gas industry. Percentage changes in real annual wages are shown from the year preceding job loss to: a) the year following job loss; b) three years after job loss; c) five years after job loss. Because job loss may lead to long spells of non-employment, laid-off workers who have no employment income after job loss are included in the analysis as long as they filed an income tax form in the years following displacement. To rule out concerns about early retirement five years after job loss, the sample is restricted to workers who are aged 25 to 49 at the time of job loss (and thus, who are aged 30 to 54 five years after job loss).Note
Table 2 shows that the median percentage declines in the annual wages and salaries of workers laid-off from oil and gas extraction firms from 2009 to 2011 amounted to 29% from the year preceding job loss to the year following job loss. The corresponding declines for workers laid-off from related support activities were, at 16%, smaller. These numbers imply that about half of workers laid-off from oil and gas extraction from 2009 to 2011 saw their annual wages and salaries drop by at least 30% in the short term.
The median declines in the real annual wages and salaries of workers displaced from oil and gas extraction from 2009 to 2011 amounted to roughly $19,500 (in 2016 dollars) in the short term, more than twice the median declines (of about $7,400) experienced by workers laid-off from firms operating in related support activities.Note
Tables 2 and 3 also highlight the diversity of earnings changes experienced by laid-off workers. Of all workers laid-off from oil and gas extraction from 2009 to 2011, one quarter saw their earnings drop by at least $54,800 in the short term. The corresponding amount for workers laid-off from related support activities equals roughly $33,200.
In contrast, one out of four workers displaced from oil and gas extraction saw their earnings increase by at least $6,000 from the year preceding job loss to the year following job loss. Similarly, one quarter of workers laid-off from related support activities industries saw their earnings increase by at least $16,200 in the short term. Hence, the majority but not all laid-off workers experienced earnings declines in the short run.
Although earnings changes are more favourable in the longer term, many workers displaced from the oil and gas industry experience earnings declines five years after job loss
As time following job loss increases, displaced workers have greater opportunities to look for alternative jobs. For this reason, one would expect their earnings changes to be more favorable in the medium term than they are in the short run.
Tables 2 and 3 confirm that this is the case. Table 3 shows that three years after job loss, the median change in earnings experienced by workers displaced from oil and gas extraction from 2009 to 2011 was, at about $1,000, slightly positive. The corresponding median change in earnings for their counterparts laid-off from related support activities amounted to roughly $4,000.
Nevertheless, one quarter of workers laid-off from oil and gas extraction saw their annual wages and salaries drop by at least $32,000 three years after job loss. Since Employment Insurance benefits generally cover laid-off workers for only about one year, this finding implies that, for a significant group of displaced workers, substantial earnings declines persist even after EI benefits have been exhausted.
The persistence of earnings declines for some displaced workers is observed even five years after job loss. Of all employees laid-off from oil and gas extraction 2009 to 2011, one quarter saw their annual wages and salaries drop by at least $36,800 five years after job loss. Likewise, of all workers laid-off from related support activities from 2009 to 2011, one quarter saw their annual wages and salaries drop by at least $26,800 during that period. At the other end of the spectrum, one quarter of workers displaced from these two sectors saw their annual wages and salaries increase by at least $32,000 from the year preceding job loss to the fifth year after job loss.
| Percentile of the percentage earnings change distribution | Year t-1 to year t+1 | Year t-1 to year t+3 | Year t-1 to year t+5 | ||||||
|---|---|---|---|---|---|---|---|---|---|
| 25th | 50th | 75th | 25th | 50th | 75th | 25th | 50th | 75th | |
| percent | |||||||||
| Workers laid-off from: | |||||||||
| The oil and gas industry | -65.1 | -17.3 | 34.2 | -43.9 | 7.1 | 73.0 | -55.4 | 0.7 | 70.3 |
| Oil and gas extraction | -77.8 | -29.4 | 10.7 | -47.0 | 1.3 | 57.0 | -59.9 | 2.0 | 67.8 |
| Related support activities | -63.9 | -15.9 | 36.6 | -43.5 | 7.9 | 74.3 | -55.0 | 0.7 | 70.6 |
|
Note: Year t denotes the year of job loss.The oil and gas industry includes: a) oil and gas extraction, b) related support activities for mining, oil and gas extraction. Source: Statistics Canada, Longitudinal Worker File. |
|||||||||
| Percentile of the earnings change distribution | Year t-1 to year t+1 | Year t-1 to year t+3 | Year t-1 to year t+5 | ||||||
|---|---|---|---|---|---|---|---|---|---|
| 25th | 50th | 75th | 25th | 50th | 75th | 25th | 50th | 75th | |
| 2016 dollars | |||||||||
| Workers laid-off from: | |||||||||
| The oil and gas industry | -34,840 | -8,116 | 15,441 | -22,120 | 3,739 | 33,032 | -27,447 | 355 | 32,453 |
| Oil and gas extraction | -54,752 | -19,497 | 5,965 | -31,752 | 951 | 34,503 | -36,807 | 1,309 | 43,413 |
| Related support activities | -33,249 | -7,364 | 16,211 | -21,467 | 4,013 | 32,870 | -26,838 | 310 | 31,552 |
|
Note: Year t denotes the year of job loss.The oil and gas industry includes: a) oil and gas extraction, b) related support activities for mining, oil and gas extraction. Source: Statistics Canada, Longitudinal Worker File. |
|||||||||
Multivariate analyses indicate that the displaced workers most likely to experience earnings declines (gains) of at least $25,000 five years after job loss are relatively older (younger), have high (low) job tenure, and are in the upper (lower) quintiles of the earnings distribution.Note
Taken together, the numbers shown in Tables 2 and 3 highlight the fact that the financial consequences of job loss are not uniform for all displaced workers. Whether they lose their job from oil and gas extraction or related support activities, not all displaced workers experience earnings declines. However, even five years after job loss, a significant proportion of displaced workers end up with substantially lower earnings than they had prior to job loss. This finding is not limited to the oil and gas industry and is generally observed elsewhere in the economy (Morissette and Qiu, 2020).
It should be emphasized that the numbers shown in Tables 2 and 3 highlight only the observed earnings declines experienced by laid-off workers: they do not incorporate the earnings growth displaced workers would have experienced in the absence of job loss. As such, the earnings declines shown in Tables 2 and 3 represent a lower bound for the earnings losses (i.e. earnings declines plus foregone earnings growth) of workers displaced from the oil and gas industry. Similarly, the numbers do not incorporate the possibility that providing incentives for a green economy in forthcoming years may create new employment opportunities for some displaced oil and gas workers.
Conclusion
Efforts to make a transition to a low carbon economy have raised concerns that workers displaced from energy-producing sectors might experience substantial earnings declines after job loss. A more optimistic view is that workers displaced from these sectors might be able to make smooth transitions to “green” sectors such as solar panel industries or recycling industries and might not suffer serious financial consequences as a result of the loss of their jobs.
To shed light on this issue, this study documents the employment and earnings trajectories of workers who were displaced from the oil and gas industry in recent years. The results indicate that for many of these workers, job loss leads to substantial and persistent earnings declines. However, as Morissette and Qiu (2020) and Chen and Morissette (2020) show, this finding is not limited to the oil and gas industry.
That being said, the numbers make it clear that the financial consequences of job loss are not uniform for all displaced workers. Whether they lose their job from oil and gas extraction or related support activities, not all displaced workers experience earnings declines. Three years after job loss or five years after job loss, a significant fraction of displaced workers earn more than they did in the year prior to job loss.
As mentioned above, the study quantifies the earnings declines and earnings gains observed after displacement but does not incorporate in the calculations the earnings growth foregone due to job loss. Likewise, the study does not take into account the possibility that incentives for firms to move towards a green economy might create job opportunities for some displaced oil and gas workers in the near future. Since the study covers the 1995-to-2016 period, it cannot provide estimates of short-term earnings losses for the oil and gas workers who have been displaced since the beginning of the COVID-19 pandemic. A significant amount of uncertainty remains regarding the post-displacement outcomes of these workers. As firms in the oil and gas industry cut production and their capital expenditures in 2020, some workers employed in this sector and some of those working in industries providing inputs to this sector are likely to experience job loss in the near future (Wang, 2020). It is unclear whether these workers will adapt in the same way as workers displaced during the 1995-to-2016 period did.
Despite these limitations, the study paints a nuanced picture of the post-displacement outcomes of workers laid-off from the oil and gas industry. This nuanced picture does not support the view that all workers displaced from energy-producing sectors experience substantial earnings declines after job loss. Nor does it support the view that all workers displaced from these sectors make a smooth transition to new employment after job loss.
References
Chen, W. H. and R. Morissette. 2020. “How Do Workers Displaced from Traditional Energy-Producing Sectors Fare After Job Loss? Evidence from Coal Mining”, Economic Insights, Statistics Canada.
Jacobson, L. S., R. J. Lalonde, and D. G. Sullivan. 1993. ‘Earnings Losses of Displaced Workers,’ American Economic Review 83: 685–709.
Morissette, R., X. Zhang, and M. Frenette. 2007. “Earnings Losses of Displaced Workers: Canadian Evidence from a Large Administrative Database on Firm Closures and Mass Layoffs”, Statistics Canada catalogue no. 11F0019M, Analytical Studies Branch Research Paper Series. No. 291.
Morissette, R., H. Qiu, and P.C.W. Chan. 2013. “The risk and cost of job loss in Canada, 1978-2008.” Canadian Journal of Economics 46 (4): 1480–1509.
Morissette, R. and H. Qiu. 2020. “Turbulence or Steady Course? Permanent Layoffs in Canada, 1978-2016.” IRPP Study 76. Montreal: Institute for Research on Public Policy.
Wang, W. 2020. “The Decline in Production and Investment in Canada’s Oil and Gas Sector and its Impact on the Economy”, Economic Insights, Statistics Canada, Catalogue 11-626-X, No. 109.
- Date modified: