
Economic Insights
Economic Impact of the COVID-19 Pandemic on Canadian Businesses across Firm Size Classes

Archived Content
Information identified as archived is provided for reference, research or recordkeeping purposes. It is not subject to the Government of Canada Web Standards and has not been altered or updated since it was archived. Please "contact us" to request a format other than those available.
This Economic insights article examines the impact of COVID -19 on the economic activity of Canadian businesses across firm size classes. It focuses on two measures of economic activity: actual hours worked of employees engaged in production in firms and real output (as defined as real gross domestic product, GDP) of the firms. It finds that small firms were among the hardest hit by the COVID-19 pandemic for the first quarter of 2020. Hours worked for small firms declined by 9.4% in the first quarter of 2020, compared with an overall decline of 5.6% in the business sector in that quarter. Real output declined by 2.1% in small firms in the first quarter of 2020, while it declined by 1.7% in the business sector in the first quarter. The declines in hours worked and real output among small firms were larger in the service sectors that in the goods sector.
The economic restrictions and social distancing measures during the COVID-19 pandemic have caused major disruptions to Canadian businesses. Those disruptions are expected to have particularly large negative effects on small and medium-sized firms, as small and medium-sized firms tend to be concentrated in the travel- and tourism-related industries, such as transportation, restaurants, accommodation, and arts and entertainment, which are the hardest hit by the COVID-19 pandemic.
This paper examines the impact of COVID-19 on the economic activity of Canadian businesses across firm size classes. It focuses on two measures of economic activity: actual hours worked of employees engaged in production in firms and real output (as defined as real gross domestic product, GDP) of the firms. The paper estimates the growth in real output and hours worked for the first quarter of 2020 across firm size classes and compared that with their annual growth for the period 2016 to 2019. Firms are classified by their employment: small firms have 0 to 99 employees; medium-sized firms, 100 to 499 employees; and large firms, 500 or more employees.
The estimates of real output and hours worked by firm size classes from Statistics Canada are obtained using various surveys and administrative data and are typically available with a long lag. For example, real GDP and employment by firm size classes for years up to 2015 are released in November 2019 (ISED, 2019). To assess the economic impact of COVID-19 on Canadian firms across size classes, this paper provides more timely estimates of real output and hours worked by firm size classes. That is done by using advance indicators of economic activity and by combining several micro data sources such as monthly Labour Force Survey (LFS) and National Accounts Longitudinal Micro Data File (NALMF), supplemented with monthly industry GDP and annual industry hours worked estimates.
Hours worked of workers engaged in production by firm size and by industry is estimated using the monthly LFS. The Labour Force Survey (LFS) results for March 2020 were released on April 9, 2020. It reflected labour market conditions during the week of March 15 to 21. By then, a sequence of unprecedented government interventions related to COVID-19—including the closure of non-essential businesses, travel restrictions, and public health measures directing Canadians to limit public interactions—had been put in place and these interventions resulted in a dramatic slowdown in economic activity. Therefore, the slowdown for the month of March, 2020 due to COVID-19 is reflected in LFS for March 2020.
Real output by firm size and by industry is estimated using NALMF for years up to 2017. After 2017, the estimates of real output by firm size are projected using hour estimates by firm size from the LFS. The projection is based on the assumption that productivity growth by firm size and by industry for the period after 2017 is the same as their average growth rates for the period 2014 to 2017.
The growth rates of hours worked and real output for the first quarter of 2020 in this paper are calculated as the percentage change in that quarter compared with the average of the four quarters of 2019. This concept of growth rate differs from that of GDP growth for the first quarter of 2020 released on May 29, 2020 (Statistics Canada, 2020a). That growth rate reflects the percentage change between the first quarter of 2020 and the last quarter of 2019.Note
For hours worked, small and medium-sized firms are found to be hardest hit by the COVID-19 pandemic for the first quarter of 2020. The large firms were the least hit. The estimates show that hours worked for small firms declined at 9.4% in Q1 2020, hours worked for medium-sized firms declined at 11.1% in Q1 2020, and hours worked for large firms increased by 1.2% in Q1 2020. Overall, hours worked across all size classes declined at 5.6% in Q1 2020 in the Canadian business sector.
For real output, small firms were hardest hit in Q1 2020, followed by large and medium-sized firms. The estimates show that real output declined by 2.1% for small firms in Q1 2020, real output for large firms declined by 1.5% and real output for medium-sized firms declined by 1.1%. Overall, real output declined by 1.7% in the business sector for the first quarter of 2020 compared with the average level of real output in the four quarters of 2019.
Hours worked declined in Q1 2020 for both goods and services sectors. For goods producing sector, the decline occurred in all size class in Q1 2020. For the service producing sector, the decline was concentrated in small and medium-sized firms in Q1 2020, and there was an increase for the large firms in Q1 2020.
Real output declined in Q1 2020 for both goods and services sectors. The decline was larger in the service sector than in the goods sectors. The decline in real output in the goods sector occurred in medium-sized and large firms, while the decline in real output in the service sector occurred in all firm classes. The decline was the largest in the large firms in the goods sector, while it was the largest in the small firms in the service sector.
The estimates of real output by firm size classes and by industry are sensitive to the assumption that was used to project real output growth by firm size classes. But, the overall conclusion on the differential economic impacts across firm size classes and across sectors is similar.
Data and estimation
The task is to estimate real GDP and hours worked by firm size classes and by industry of the business sector at the link level of industry classification (a mix of North American Industry Classification, NAICS 3 to 4 digits) for the period 2016 to 2020 Q1. The estimates for the years before 2015 can be found in ISED (2019).
Main data sources for the estimation are the NALMF and monthly LFS.
The NALMF was developed by combining a number of data sources including administrative tax records (T2 and T4). The database covers the period 2000 to 2017 and includes all employers in Canada, both incorporated and unincorporated. For this paper, the database is used to estimate GDP and employment by firm-size classes and by industry for the years up to 2017.
The monthly LFS is used to estimate actual hours worked of employed persons by firm size and by industry. The annual actual hours worked estimates are derived from hours worked in a reference week of the reference month, averaged over 12 months times the number of working weeks in a year. The reference week for the monthly LFS is the week containing the 15th day of the month.
The Labour Force Survey (LFS) results for March 2020 were released on April 9, 2020. The reference week for March 2020 is the week of March 15 to 21 during which a sequence of unprecedented government interventions related to COVID-19 had already been put in place. These interventions resulted in a dramatic slowdown in economic activity.
More than 90% of hours worked of paid employees in the LFS are assigned firm-size classes. But less than 2% of hours worked for self-employed workers are assigned firm-size classes. For this paper, self-employed workers will be assigned small firm-size class with less than 99 employees.
Real output (GDP) by firm size is derived from the NALMF for 2016 to 2017.Note For 2018 to 2020 Q1, GDP is estimated using hours worked by firm size and by industry for that period from the LFS. The estimation takes into account the differences in the level and growth of labour productivity (GDP per worker) across firm size classes and by industry. It is assumed that labour productivity growth by firm size and by industry for 2018 to 2020 Q1 is the same as their average growth rates for 2014 to 2017.
The final estimates of hours worked and real GDP by firm size classes and by industry are benchmarked to the estimates of hours worked from the labour productivity program for the period 2016 to 2018 and the estimates of real GDP from monthly GDP program of Statistics Canada from 2016 to March 2020, both of which are at a detailed level of industry aggregation.
The relative shares of GDP by firm-size classes in this paper are similar to those in Baldwin, Leung and Rispoli (2013). Baldwin, Leung and Rispoli (2013) adopted the same definition of firm size classes used in this paper and found that small firms accounted for 41% of nominal GDP in 2008, medium-sized firms accounted for 11% and large firms accounted for 48% of nominal GDP in 2008. The estimates in this paper show that small firms accounted for 42% of GDP in 2016, medium-sized firms accounted for 14% of GDP and large firms accounted for 44% of GDP in 2016.
Main findings and discussions
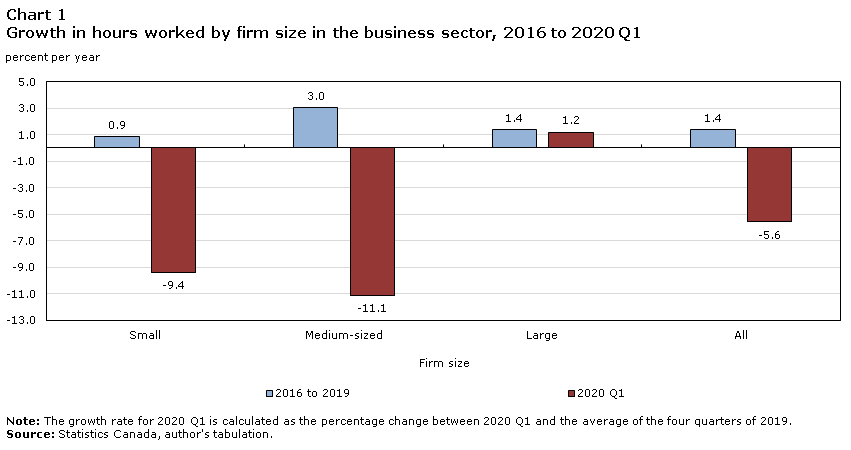
Chart 1 presents annual average growth in hours worked by firm size classes in the business sector for period 2016 to 2019 and growth for the first quarter of 2020.
Data table for Chart 1
| Firm size | 2016 to 2019 | 2020 Q1 |
|---|---|---|
| percent per year | ||
| Small | 0.9 | -9.4 |
| Medium-sized | 3.0 | -11.1 |
| Large | 1.4 | 1.2 |
| All | 1.4 | -5.6 |
|
Note: The growth rate for 2020 Q1 is calculated as the percentage change between 2020 Q1 and the average of the four quarters of 2019. Source: Statistics Canada, author's tabulation. |
||
For the period 2016 to 2019, the growth in hours worked was highest in the medium-sized firms, followed by small and large firms. For that period, hours worked rose by 3.0% per year for medium-sized firms. It increased by 0.9% per year for small firms, and it increased by 1.4% for large firms.
For the first quarter of 2020, hours worked declined in the business sector, but the decline was the largest for small and medium-sized firms. Hours worked declined by 11.1% for medium-sized firms in 2020 and declined by 9.4% for small firms and it increased by 1.2 for large firms in 2020. Overall, hours worked declined by 5.6% for 2020 Q1 in the business sector.
Data table for Chart 2
| Firm size | 2016 to 2019 | 2020 Q1 |
|---|---|---|
| percent per year | ||
| Small | 1.7 | -2.1 |
| Medium-sized | 3.9 | -1.1 |
| Large | 2.8 | -1.5 |
| All | 2.5 | -1.7 |
|
Note: The growth rate for 2020 Q1 is calculated as the percentage change between 2020 Q1 and the average of the four quarters of 2019. Source: Statistics Canada, author's tabulation. |
||
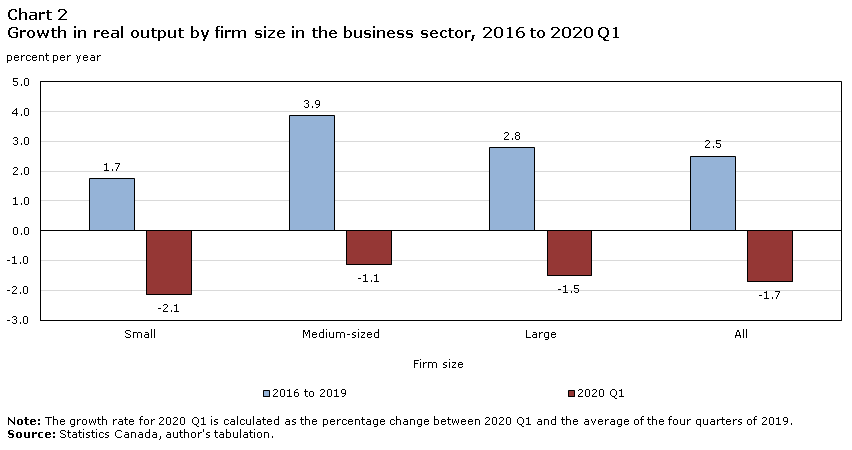
Chart 2 presents annual growth of real GDP by firm size classes for period 2016 to 2019 and the growth of real GDP for Q1 2020.
For period 2016 to 2019, real GDP increased for all firm size classes. It increased at 1.7% per year for small firms, 3.9% per year for medium-sized firms and 2.8% per year for large firms. Overall, real GDP increased by 2.5% in the business sector for the period 2016 to 2019.
For Q1 2020, real GDP declined in all firm size classes. The largest decline was in small firms, followed by large and medium-sized firms. Real output declined by 2.1% for small firms in Q1 2020, real output for large firms declined by 1.5% and real output for medium-sized firms declined by 1.1%. Overall, real output declined by 1.7% in the business sector for the first quarter of 2020.
| 2016 to 2019 | 2020 Q1 | |
|---|---|---|
| percent per year | percent per year | |
| Firm size in goods sector | ||
| Small | -0.1 | -7.8 |
| Medium | 2.5 | -5.6 |
| Large | 2.7 | -3.7 |
| All | 1.3 | -6.0 |
| Firm size in services sector | ||
| Small | 1.3 | -10.0 |
| Medium | 3.2 | -13.7 |
| Large | 0.9 | 2.8 |
| All | 1.4 | -5.4 |
|
Note: The growth rate for 2020 Q1 is calculated as the percentage change between 2020 Q1 and the average of the four quarters of 2019. Source: Statistics Canada, author's tabulation. |
||
Table 1 presents growth of hours worked by firm size classes and by goods and services producing sectors. Hours worked declined in Q1 2020 for both goods and services sectors. For goods producing sector, the decline occurred in all size class in Q1 2020. For the service producing sector, the decline occurred in small and medium-sized firms in Q1 2020, and there was an increase for the large firms in Q1 2020.
| 2016 to 2019 | 2020 Q1 | |
|---|---|---|
| percent per year | percent per year | |
| Firm size in goods sector | ||
| Small | 1.5 | 0.6 |
| Medium | 2.8 | -0.9 |
| Large | 2.9 | -2.7 |
| All | 2.4 | -1.3 |
| Firm size in services sector | ||
| Small | 1.9 | -3.5 |
| Medium | 4.7 | -1.3 |
| Large | 2.7 | -0.6 |
| All | 2.6 | -2.0 |
|
Note: The growth rate for 2020 Q1 is calculated as the percentage change between 2020 Q1 and the average of the four quarters of 2019. Source: Statistics Canada, author's tabulation. |
||
Real output declined in Q1 2020 for both goods and services sectors. The decline was larger in the services sector than in the goods sectors. It declined at 1.3% in the goods sector for 2020 Q1 and it declined at 2.0% in the services sector for 2020 Q1. The decline in real output in the goods sector occurred in medium-sized and large firms, while the decline in real output in the services sector occurred in all firm size classes. The decline was largest in the large firms in the goods sector, and it was largest in the small firms in the service sector.
The estimates of real GDP by firm size classes and by industry are sensitive to the assumption that is used to project real output growth by firm size classes. The estimates of real GDP above are based on the assumption that productivity growth by firm size for the period after 2017 when micro data are not available is equal to the average growth rate for the period from 2014 to 2017 at a detailed level of industry aggregation (86 industries).
The implicit labour productivity growth is 3.8% in the business sector for Q1 2020, which is much higher than an average annual growth of 1.1% for the period from 2016 to 2019.Note The decline in hours worked for 2020 Q1 tends to be larger for those industries with relatively low productivity in the previous years. For example, the industries such as restaurants, accommodation, and arts and entertainment with relatively low productivity experienced large declines in hours worked in Q1 2020. This would give rise to a large reallocation effect that is associated with a shift in the composition of hours worked from the industries with relatively low productivity to those industries with relatively high productivity. A shift-share analysis shows that this positive reallocation effect in 2020 Q1 contributed about 30% of labour productivity growth in 2020 Q1. The remainder 70% of labour productivity growth in Q1 2020 is from increases in labour productivity within industries holding shares of hours worked constant.
The evidence on the widespread decline in real output across Canadian businesses in this paper is consistent with the evidence from the Canadian Survey on Business Conditions on the Impact of COVID-19 on businesses in Canada (Statistics Canada, 2020b). According to that survey, nearly half of businesses reported that their revenues from the first quarter of 2020 were down by more than 20% over the same quarter a year earlier.
The estimates in this paper focused on the production side of the economy, with no consideration for the demand side of the economy which will also affect economic activity of Canadian firms. The consumer spending and consumption pattern will likely be affected by the COVID-19 pandemic. Business investment may shift towards new opportunities such as AI, e-commerce, green technologies. The exports will also likely to be affected.
The future analysis will focus on the effect of disruptions in the global value chain which are major risks for the growth of small and large firms. This can be done using the extended SUT tables to estimate the impact of decline in exports and production on the economic activity of firms.
References
Leung, D., L. Rispoli, and B. Gibson. 2011. Small, Medium-Sized and Large Businesses in the Canadian Economy: Measuring Their Contribution to Gross Domestic Product in 2005. Economic Analysis Research Paper Series, no. 069. Statistics Canada Catalogue no. 11F0027M. Ottawa: Statistics Canada.
Baldwin, J.R., D. Leung, and L. Rispoli. 2013. Canadian Labour Productivity Differences across Firm Size Classes, 2002 to 2008. Canadian Productivity Review, no. 032. Statistics Canada Catalogue no. 15-206-X. Ottawa: Statistics Canada.
Balk, Bert M. 2019. "Consistency Issues in the Construction of Annual and Quarterly Productivity Indices." International Productivity Monitor 37, 2019.
Cross, P. D Wyman. 2011. “The Relationship between Monthly, Quarterly and Annual Growth Rates.” Canadian Economic Observer. Statistics Canada.
Innovation, Science and Economic Development Canada (ISED). 2019. Key Small Business Statistics. Ottawa, Canada.
Statistics Canada. 2020a. “Gross Domestic Product, Income and Expenditure, First Quarter 2020,” and “Gross Domestic Product by Industry, March 2020.” The Daily, May 29, 2020.
Statistics Canada. 2020b. “Canadian Survey on Business Conditions: Impact of COVID-19 on businesses in Canada, March 2020.” The Daily, April 29, 2020.
- Date modified: