
Economic Insights
Potential Earnings Losses among High School and Postsecondary Graduates Due to the COVID-19 Economic Downturn

Archived Content
Information identified as archived is provided for reference, research or recordkeeping purposes. It is not subject to the Government of Canada Web Standards and has not been altered or updated since it was archived. Please "contact us" to request a format other than those available.
In this Economic Insights article, the potential earnings losses experienced by this year’s class of high school and postsecondary graduates as a result of COVID-19 are simulated. These graduates may face very challenging conditions as they enter the labour market, which could have long-term ramifications for their earnings prospects. Consequently, earnings losses are simulated up to five years after graduation, based on various scenarios of this year’s youth unemployment rate.
Introduction
The COVID-19 pandemic has led to a shutdown of most non-essential businesses and government services in most countries around the globe. This has resulted in a considerable slowdown in economic activity. In Canada, Real Gross Domestic Product was 18.2% lower in April compared to February.Note Moreover, the overall unemployment rate jumped following the onset of the lockdown, going from 5.6% in February 2020 to 13.0% in April 2020.Note Many experts are now forecasting that Canada will enter a recession as a result of COVID‑19.Note
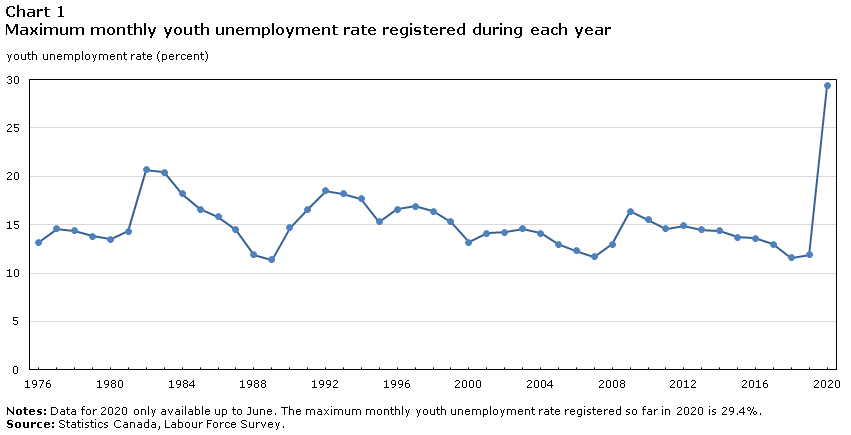
Typically, new entrants to the labour market are hit hardest during a recession. In fact, the unemployment rate for youth (15 to 24 year-olds) almost tripled between February (10.3%) and May (29.4%), followed by a modest decline in June (reaching 27.5%).Note The May figure is the highest monthly rate observed since the data have been tabulated, and even notably higher than during the last three recessions in the early 1980s, early 1990s, and late 2000s (Chart 1). Consequently, this year’s class of secondary and postsecondary graduates who will enter the labour market in the coming months may do so under very challenging conditions, raising concerns about their labour market prospects in the years ahead.
While the government has announced measures to ease student debt burdenNote , a poor start in one’s career may have implications for many years to follow, as indicated by previous research. Oreopoulos, von Wachter, and Heisz (2012) used administrative data on graduates up to 1995 combined with personal tax data and company-level administrative data up to 1999 to demonstrate the importance of labour market conditions during the year of graduation in determining the long-term labour market outcomes of male bachelor’s degree graduates. For example, they found that a 1 percentage point increase in the provincial youth unemployment rate during the year of graduation was associated with a 0.7% decline in constant dollar earnings 5 years following graduation.
Data table for Chart 1
| Youth unemployment rate (percent) | |
|---|---|
| 1976 | 13.2 |
| 1977 | 14.6 |
| 1978 | 14.4 |
| 1979 | 13.8 |
| 1980 | 13.5 |
| 1981 | 14.3 |
| 1982 | 20.7 |
| 1983 | 20.4 |
| 1984 | 18.2 |
| 1985 | 16.6 |
| 1986 | 15.8 |
| 1987 | 14.5 |
| 1988 | 11.9 |
| 1989 | 11.4 |
| 1990 | 14.7 |
| 1991 | 16.6 |
| 1992 | 18.5 |
| 1993 | 18.2 |
| 1994 | 17.7 |
| 1995 | 15.3 |
| 1996 | 16.6 |
| 1997 | 16.9 |
| 1998 | 16.4 |
| 1999 | 15.3 |
| 2000 | 13.2 |
| 2001 | 14.1 |
| 2002 | 14.2 |
| 2003 | 14.6 |
| 2004 | 14.1 |
| 2005 | 13.0 |
| 2006 | 12.3 |
| 2007 | 11.7 |
| 2008 | 13.0 |
| 2009 | 16.4 |
| 2010 | 15.5 |
| 2011 | 14.6 |
| 2012 | 14.9 |
| 2013 | 14.5 |
| 2014 | 14.4 |
| 2015 | 13.7 |
| 2016 | 13.6 |
| 2017 | 13.0 |
| 2018 | 11.6 |
| 2019 | 11.9 |
| 2020 | 29.4 |
|
Notes: Data for 2020 only available up to June. The maximum monthly youth unemployment rate registered so far in 2020 is 29.4%. Source: Statistics Canada, Labour Force Survey. |
|
How will the slowdown from COVID-19 affect this year’s graduating class? Although it is too early to tell, it is possible to expand upon the work of Oreopoulos, von Wachter, and Heisz (2012) to gain some insights. To that end, using quinquennial Census data from 1986 to 2016, this article estimates the impact of graduating during a recession on labour market earnings separately for male and female high school, college and bachelor’s degree graduates. The focus is on the relationship between the provincial youth unemployment rate (obtained from the Labour Force Survey) during the graduation year and annual earnings from paid and self-employment up to five years after graduation.
To further inform possible labour market impacts on this year’s graduating class, the study then applies the estimated relationship between the youth unemployment rate and graduate outcomes from the past to simulate cumulative earnings losses due to the economic downturn brought on by COVID-19 for this year’s cohort of graduates over the following 5 years. Since it is too early to know what impact COVID‑19 will have on the youth labour market in the coming months, the analysis will be based on various scenarios for this year’s youth unemployment rate. In doing so, this study casts a wide net by simulating earnings losses related to the downturn based on a wide variety of potential youth unemployment rates: 16.0%, 19.0%, 22.0%, 25.0%, and 28.0%.Note It is important to note that the study does not simulate total earnings losses between this year’s class of graduates and previous cohorts, but rather, only the portion of earnings losses that may be caused by the COVID-related economic downturn. Other factors may come into play, which may counterbalance or exacerbate earnings losses related to an economic downturn. For example, increasing automation in the workplace may preferentially benefit knowledge workers whose skills may complement those of robots and computer algorithms, while reducing the demand for workers whose tasks may be automatable.Note
Graduates could lose $25,000 or more over the next 5 years if the labour market does not improve soon
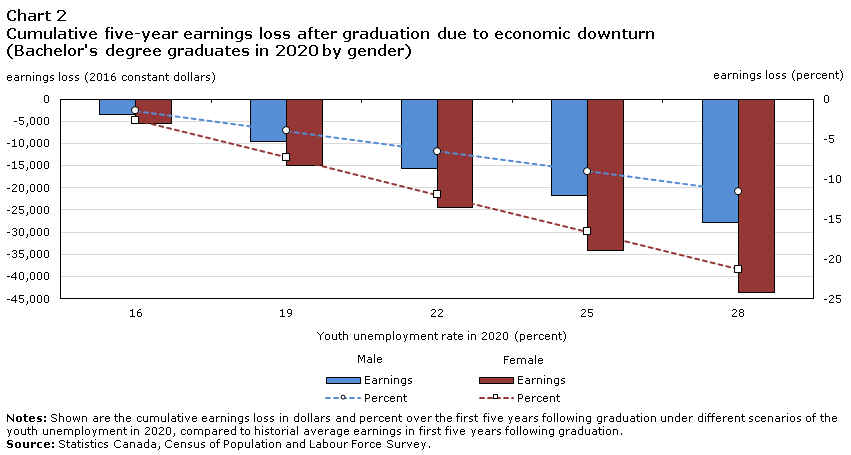
If the youth unemployment remains close to its June rate of 27.5% for the remainder of the year, this year’s graduates could lose $25,000 or more during the next 5 years compared to what previous graduates earned. For example, male bachelor’s degree graduates could lose $27,887 during this time span if the youth unemployment rate in 2020 will be 28.0% (Chart 2 in the Appendix). This represents a loss of almost $6,000 per year. Potential losses under this scenario range from about $23,000 to $44,000, depending on the sex and education level (see Chart 2, 3, and 4 in the Appendix).
Such losses are quite relevant given that many postsecondary graduates typically graduate with significant debt. According to the National Graduates Survey, 49% of college graduates from the class of 2015 held student debt at graduation. Among those who held debt, the average debt was $15,000. Among bachelor’s degree graduates, 54% held student debt at graduation, and the average debt load among those owing money was $28,000.Note
However, the size of the student debt load, as well as the magnitude of the simulated earnings losses under the scenario described above are quite small compared to the estimated benefit of graduating with a postsecondary qualification. In fact, Frenette (2019) found that over a 15 year period early in one’s career, male and female bachelor’s degree graduates earned about $500,000 more than their counterparts with a high school diploma.
Moreover, an annual youth unemployment rate of 28.0% would top the previous high of 19.2% set in 1983 by 8.8 percentage points. While it is clear that youth are very disproportionately affected during this pandemic due to restaurant, bar, and retail closures or reductions in operations, a turnaround in the youth labour market could happen quickly if the infection curve has been flattened significantly and physical distancing guidelines are eased as a result.
If instead this year’s youth unemployment rate roughly matches the historical high at 19.0%, earnings losses are likely to be far more moderate. For example, under this scenario, male bachelor’s degree graduates could lose $9,590 over the next five years, or less than $2,000 per year (Chart 2). In general, potential losses under this scenario, could range from about $8,000 to $15,000 (Chart 2, 3, and 4).
Under a scenario where the youth labour market recovers very quickly (i.e. the youth unemployment rate will be 16.0% this year), five year losses could be less than $6,000 for all groups, or less than $1,200 per year (Chart 2, 3, and 4).
Female postsecondary graduates face larger potential earnings losses than their male counterparts
Regardless of the scenario that actually unfolds, this year’s female postsecondary graduates may incur larger earnings losses during the next five years than their male counterparts. For example, if the unemployment rate remains at around 28.0%, female bachelor’s graduates may lose $43,674, compared to $27,887 among their male counterparts.Note As the annual earnings of women are generally lower than those of men, even when both have a bachelor’s degree, these earnings losses represent a larger share of women’s earnings. Specifically, women could lose 21.3% under this scenario, compared to only 11.6% for men. Even under a more optimistic scenario corresponding to a 16.0% youth unemployment rate, women with a bachelor’s degree could lose $5,467 over the next five years—about $2,000 more than their male counterparts.Note
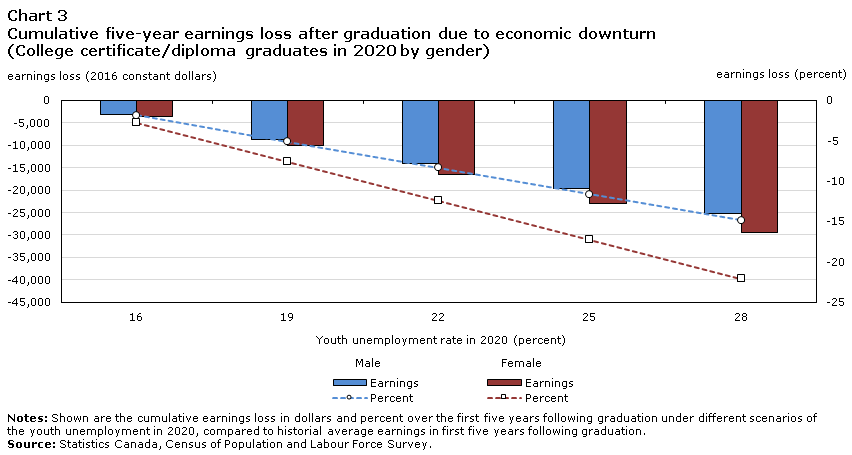
The differences in potential losses are much smaller among college graduates, but they are still larger among women. Under the 28.0% youth unemployment rate scenario, female college graduates may lose $29,491 over the next five years, compared to $25,197 for men. Again, since female college graduates typically earn less than men with a college credential, this difference in dollars corresponds to a much larger difference when expressed as a share of earnings (22.1% for women compared to 14.9% for men). Under the more optimistic scenario (16.0% youth unemployment rate), the earnings loss may be quite negligible over the five year period (about $500 more for women).
Among high school graduates, men and women may lose the same amount in dollars, although this represents a larger share of women’s earnings.
High school graduates may lose a larger share of their typical earnings than postsecondary graduates
When it comes to weathering the storm of the recession, education appears to matter as well. High school graduates may be more adversely affected than postsecondary graduates. Although high school graduates may lose less in dollar earnings than postsecondary graduates, these potential losses represent a larger share of their earnings. This is because postsecondary graduates, earn considerably more than high school graduates on average.
For instance, male postsecondary graduates could lose between about $500 and $4,000 more than their high school peers, depending on the scenario that unfolds in the youth labour market. For female postsecondary graduates, the losses may be between about $3,000 and $21,000 more than their high school peers. While the losses are greater in dollar terms for postsecondary graduates, they are larger when viewed as a share of earnings for high school graduates. Under the worst case scenario examined in this study, male high school graduates may lose 8.3 percentage points more of their earnings than bachelor’s degree graduates. For women, the loss would be 3.6 percentage points higher among high school graduates compared to postsecondary graduates.
Conclusion
Previous research has shown that new graduates are adversely affected by a recessionary economic environment during the year they enter the labour market. Often, the implications of a poor start to one’s career can follow these new graduates for years. The concern is that this year’s graduates will enter the labour market under unusually difficult and unpredictable conditions. This study examines the potential impact of worsening economic conditions caused by the COVID-19 pandemic and subsequent lockdown on the earnings of the 2020 secondary and postsecondary graduates. Specifically, this study simulates the initial 5 years of annual earnings of these new high school, college, and bachelor’s degree graduates while taking into consideration various youth unemployment rate scenarios.
The main findings suggest that if the youth unemployment rate remains near its current historic high for the remainder of the year, graduates could lose $25,000 or more over the next 5 years. Female postsecondary graduates may be hit somewhat harder than their male counterparts, as could high school graduates compared to postsecondary graduates.
The COVID-19 recession may be less predictable than traditional economic downturns, and thus the outcomes may be governed by several atypical factors. For instance, successive waves of the COVID‑19 virus may dictate how the economy recovers since there is a possibility of subsequent shutdowns. Additionally, it is still not known when or if there will be a successful vaccine or treatment, and how effective workplaces will be at adapting to the pandemic environment.
Methods
The estimated relationship between the youth unemployment rate and annual earnings of graduates derives from a regression of the log of annual earnings on a vector of fixed effects (FEs) for potential experience interacted with the unemployment rate of younger workers (aged 15 to 24) in the province of birth/study and year of graduation. The regression also controls for FEs by potential experience, province of study, survey year and highest level of schooling.
Earnings are expressed in 2016 constant dollars, and are bottom- and top-coded at the 1st and 99th percentiles to control for outliers. The sample is restricted to individuals aged 15 to 40 who are not in school (if known, from 1991 onward), who are in the labour force, have 1 to 15 years of potential experience and have strictly positive earnings in the survey year. The “Mincerian” year of graduation is used, defined as year of birth + 6 + total years of schooling. From 2006 onward, years of schooling is not reported so this value is imputed based on the average number of years of schooling required for individuals to complete their highest level of schooling, estimated using data from 2001 and earlier. Potential experience is calculated as the difference between the survey and graduation years.Note Province of study is reported from 2006 onward among those who attended some postsecondary education; for all other respondents, the province of birth (2001 and earlier) or province of residence 5 years ago (2006 onward) is used depending on the availability of these variables. The highest level of schooling is grouped into three categories to maintain consistent reporting across Census years: terminal high school diploma, college diploma graduates, and bachelor’s degree graduates (including professional certifications). Graduates of the trades and registered apprenticeships are not included since their educational pathways are generally less linear than other graduates, which creates challenges in estimating the graduation year on the Census. Moreover, registered apprenticeships did not appear as a category until the 2006 Census.
To estimate the model, the data are grouped into cells based on the interaction of province of study, year of graduation, survey year, gender and highest level of schooling. Probability weights are used to compute averages within cells and then each cell is weighted by its sample size using frequency weights in the regressions so the results are nationally-representative. While the regressions include individuals up to 15 years following graduation, earnings losses due to an economic downturn are only simulated up to 5 years post-graduation since longer projections are generally less reliable.
Then, to simulate earnings losses, the historical average earnings of graduates are adjusted based on various youth unemployment rate scenarios for 2020 (compared to a historical average) and the marginal impact of youth unemployment at graduation on post-graduate outcomes. The five scenarios for the youth unemployment rate: 16.0%, 19.0%, 22.0%, 25.0%, and 28.0%. Cumulative earnings losses due to the downturn are reported in 2016 constant dollars and in percent terms. The historical comparison group graduated between one and five years prior to one of the Census income reference years (i.e. the calendar year prior to the Census), thus between 1980 and 2014. During this period, the average youth unemployment rate was 14.3%. Note that the simulated earnings loss only refers to the potential loss that is related to a downturn in the youth labour market compared to historical norms. No attempt is made to simulate total earnings losses for this year’s class of graduates as this would require taking into account many other factors, some of which may increase or decrease the demand for graduates. Also note that the historical relationship between the youth unemployment rate during the year of graduation and future earnings may or may not hold in a post-COVID world. Indeed, COVID may affect certain sectors, and thus graduates, more or less than during past recessions. Ultimately, only time will tell what impact COVID will have on graduates.
Appendix
Data table for Chart 2
| Youth unemployment rate in 2020 (percent) | Men | Women | Men | Women |
|---|---|---|---|---|
| earnings loss (2016 constant dollars) | earnings loss (percent) | |||
| 16 | -3,491 | -5,467 | -1.45 | -2.67 |
| 19 | -9,590 | -15,019 | -3.98 | -7.32 |
| 22 | -15,689 | -24,570 | -6.52 | -11.98 |
| 25 | -21,788 | -34,122 | -9.05 | -16.64 |
| 28 | -27,887 | -43,674 | -11.58 | -21.30 |
|
Notes: Shown are the cumulative earnings loss in dollars and percent over the first five years following graduation under different scenarios of the youth unemployment in 2020, compared to historial average earnings in first five years following graduation. Source: Statistics Canada, Census of Population and Labour Force Survey. |
||||
Data table for Chart 3
| Youth unemployment rate in 2020 (percent) |
Men | Women | Men | Women |
|---|---|---|---|---|
| earnings loss (2016 constant dollars) | earnings loss (percent) | |||
| 16 | -3,154 | -3,692 | -1.86 | -2.76 |
| 19 | -8,665 | -10,141 | -5.11 | -7.59 |
| 22 | -14,176 | -16,591 | -8.36 | -12.42 |
| 25 | -19,686 | -23,041 | -11.62 | -17.25 |
| 28 | -25,197 | -29,491 | -14.87 | -22.08 |
|
Notes: Shown are the cumulative earnings loss in dollars and percent over the first five years following graduation under different scenarios of the youth unemployment in 2020, compared to historial average earnings in first five years following graduation. Source: Statistics Canada, Census of Population and Labour Force Survey. |
||||

Data table for Chart 4
| Youth unemployment rate in 2020 (percent) | Men | Women | Men | Women |
|---|---|---|---|---|
| earnings loss (2016 constant dollars) | earnings loss (percent) | |||
| 16 | -2,987 | -2,870 | -2.49 | -3.12 |
| 19 | -8,204 | -7,883 | -6.84 | -8.57 |
| 22 | -13,422 | -12,896 | -11.18 | -14.02 |
| 25 | -18,640 | -17,910 | -15.53 | -19.48 |
| 28 | -23,857 | -22,923 | -19.88 | -24.93 |
|
Notes: Shown are the cumulative earnings loss in dollars and percent over the first five years following graduation under different scenarios of the youth unemployment in 2020, compared to historial average earnings in first five years following graduation. Source: Statistics Canada, Census of Population and Labour Force Survey. |
||||
References
Bank of Canada. 2020. Monetary Policy Report.
C.D. Howe Institute. 2020. Canada Entered Recession in First Quarter of 2020: Statement from the C.D. Howe Institute’s Business Cycle Council.
Frenette, M. 2019. Are the Career Prospects of Postsecondary Graduates Improving? Analytical Studies Branch Research Paper Series, Catalogue no. 11F0019M no. 415. Ottawa: Statistics Canada.
Government of Canada. 2020. Canada’s COVID-19 Economic Response Plan. Department of Finance.
Oreopoulos, P., T. von Wachter, and A. Heisz. 2012."The Short- and Long-Term Career Effects of Graduating in a Recession."American Economic Journal: Applied Economics, 4 (1): 1-29.
Schwandt, H. and T. von Wachter. 2019."Unlucky Cohorts: Estimating the Long-term Effects of Entering the Labor Market in a Recessions in Large Cross-Sectional Data Sets."Journal of Labor Economics, 37 (S1): S161-S198.
- Date modified: