
Economic Insights
The Changing Job Landscape, 1981 to 2019

Archived Content
Information identified as archived is provided for reference, research or recordkeeping purposes. It is not subject to the Government of Canada Web Standards and has not been altered or updated since it was archived. Please "contact us" to request a format other than those available.
This Economic Insights article examines how jobs held by Canadian employees have changed over the last four decades, prior to the COVID-19 pandemic. The analysis uses a wide variety of data sets to document the evolution of selected job characteristics from 1981 to 2019. The main finding is that changes in job characteristics over the last four decades have not been uniform for men and women or for young and older workers. Several questions remain. One important question is about the degree to which advances in artificial intelligence and robotics will affect the overall number of jobs and their task content in the coming years. One plausible hypothesis is that the COVID-19 pandemic might accelerate the automation of certain tasks. Likewise, the COVID-19 pandemic might lead to a permanent increase in rates of telework and, more generally, to changes in work arrangements (e.g. shiftwork, configuration of office spaces) that facilitate physical distancing.
While COVID-19 might change the labour market in ways that are still unknown, it is important to provide a long-term perspective on how jobs have changed over the past four decades, prior to the pandemic.
Today’s jobs differ from those of the past in several ways. First, the industrial composition of Canadian employment has changed markedly over the past four decades. In 2019, roughly 1 in 10 Canadian employees aged 17 to 64 was employed in manufacturing, down from about 1 in 5 in 1981 (Chart 1). In contrast, proportionally more paid workers were employed in professional, scientific and technical services, as well as in education, health care and social assistance, in 2019 compared with 1981.
The drop in the importance of manufacturing employment has been more pronounced among young men (those aged 25 to 34) and among prime-aged men (those aged 35 to 54) than among their female counterparts. For instance, the share of manufacturing in young men’s overall paid employment fell by about 14 percentage points from 1981 to 2019, twice the 7 percentage point decline observed among young women (Table 1).Note
Jobs in education, health care and social assistance have become relatively more important for young and prime-aged women, but not for men. This sector employed 38% of prime-aged women in 2019, up from 31% in 1981. In contrast, the growing proportion of jobs in professional, scientific and technical services is apparent for both sexes and age groups.

Data table for Chart 1
| All employees aged 17 to 64 | ||
|---|---|---|
| 1981 | 2019 | |
| percent | ||
| Public administration | 7.5 | 6.3 |
| Education, health care and social assistance | 16.1 | 21.3 |
| Manufacturing | 20.9 | 10.6 |
| Retail trade | 11.3 | 12.3 |
| Professional, scientific and technical services | 3.2 | 6.7 |
| Accommodation and food services | 5.2 | 6.6 |
| Mining and oil and gas extraction | 2.4 | 1.6 |
| Construction | 5.7 | 6.7 |
| Finance and insurance | 5.0 | 4.7 |
| Information and cultural industries | 2.7 | 1.8 |
| Transportation | 4.7 | 4.0 |
| Other industries | 15.5 | 17.4 |
|
Note: Main job held in May. Source: Statistics Canada, Labour Force Survey. |
||
Other changes are also worth noting. Young men were more likely to be employed in construction, retail trade, and accommodation and food services in 2019 than they were in 1981. However, proportionally fewer of them had jobs in public administration in 2019. In contrast, prime-aged women have increased their presence in public administration over the past four decades.
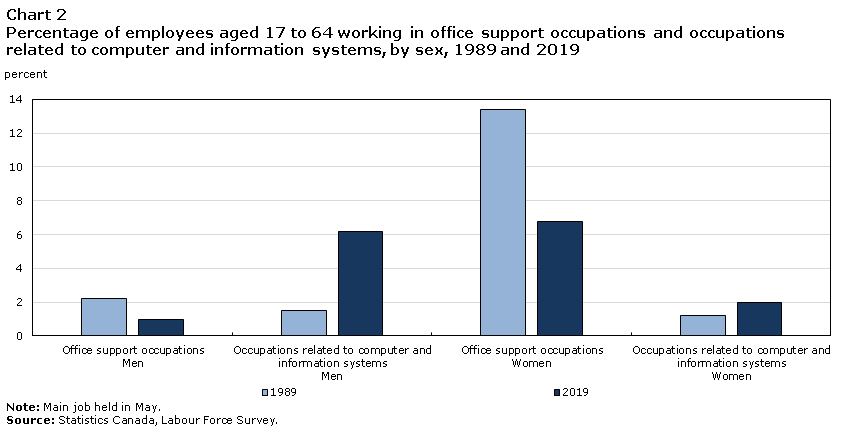
As a result of automation driven by the introduction of computer-based technologies, some occupations saw their share of total employment drop significantly. For example, 7% of women aged 17 to 64 were employed in office support occupations (clerical work) in 2019, down from 13% in 1989 (Chart 2). However, the introduction of computer-based technologies has also led to the creation of new jobs. In 2019, 6% of men were employed in occupations related to computer and information systems, up from 2% in 1989.Note
Data table for Chart 2
| 1989 | 2019 | |
|---|---|---|
| percent | ||
| Office support occupations Men | 2.2 | 1.0 |
| Occupations related to computer and information systems Men | 1.5 | 6.2 |
| Office support occupations Women | 13.4 | 6.8 |
| Occupations related to computer and information systems Women | 1.2 | 2.0 |
|
Note: Main job held in May. Source: Statistics Canada, Labour Force Survey. |
||
Along with changes in technology, in the intensity of firm competition and in international trade, changes in industrial composition have led to changes in several job characteristics. Overall, jobs were less likely to be full-time, permanent, unionized or covered by a registered pension plan (RPP) in 2019 than they were in the early 1980s.Note For example, the percentage of unionized jobs fell from 38% in 1981 to 29% in 2019 (Table 2).
These changes have not been uniform for men and women. While proportionally fewer male employees had full-time jobs, permanent jobs, unionized jobs or jobs covered by an RPP in 2019 compared with 1981, the percentage of female employees holding full-time jobs or unionized jobs was fairly similar to what it was in 1981. Women’s RPP coverage has, if anything, increased over the past four decades. This increase was driven partly by the growing presence of women in high-paying jobs and in education, health care and social assistance, both of which tend to have relatively high pension coverage.
Furthermore, while the percentage of men covered by a defined-benefit RPP fell by 26 percentage points from 1981 to the late 2010s, the percentage of women covered by such plans declined by only 4 points. As a result, women were more likely than men to have such plans in recent years. In 2017, 29% of women and 21% of men were covered by a defined-benefit RPP (Table 2).
Changes in job characteristics have also not been uniform for younger workers and older workers.
First, pay rates diverged across age groups.Note While median real hourly wages of prime-aged men employed full time grew by 13% from 1981 to 2019, those of young men were almost the same in 1981 and 2019 (Table 3).Note Likewise, median real hourly wages of prime-aged female full-time employees increased by 38% from 1981 to 2019, almost twice the 20% increase observed among their counterparts aged 25 to 34.
Second, the percentage of employees holding full-time permanent jobs followed different trajectories for different groups of workers. For example, it fell from 78% in 1989 to 75% in 2019 for young women but increased (from 74% to 79%) for prime-aged women.
Third, unionization rates diverged during the 1981-to-2019 period.Note The percentage of employees in unionized jobs fell by at least 16 percentage points for young and prime-aged men, remained fairly stable at about 35% for prime-aged women, and fell only moderately for young women.Note
The changes documented above occurred in conjunction with changes in work arrangements. Thanks to computer applications that connect workers with job offers through the Internet, gig work has emerged as a new form of employment. Gig workers are usually independent contractors hired for short-term jobs. Contrary to employees, gig workers do not usually have an employer–employee relationship. They include highly skilled freelancers, as well as on-demand workers hired for jobs through a growing number of online platforms.
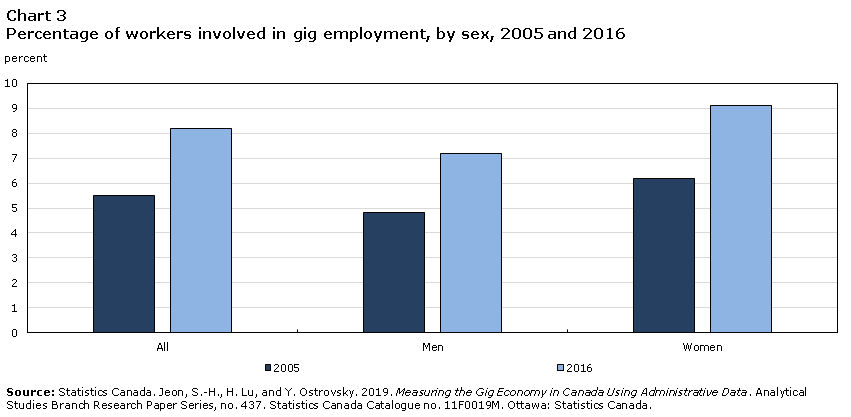
A recent Statistics Canada study (Jeon, Lu and Ostrovsky 2019) shows that the percentage of workers—employees and self-employed individuals—involved in gig work increased from 5.5% in 2005 to 8.2% in 2016. This increase was observed for men and women (Chart 3) and was driven by growth in the percentage of both workers who had only gig employment income and workers who combined gig work and wages and salaries.
The study also shows that gig work was associated with high worker turnover: roughly half of the people who entered gig work in a given year were not involved in gig work the following year. The share of gig workers was highest among workers whose main occupations were in arts, entertainment and recreation.
Data table for Chart 3
| All | Men | Women | |
|---|---|---|---|
| 2005 | 5.50 | 4.80 | 6.20 |
| 2016 | 8.20 | 7.20 | 9.10 |
|
Source: Statistics Canada. Jeon, S.-H., H. Lu, and Y. Ostrovsky. 2019. Measuring the Gig Economy in Canada Using Administrative Data. Analytical Studies Branch Research Paper Series, no. 437. Statistics Canada Catalogue no. 11F0019M. Ottawa: Statistics Canada. |
|||
The many changes observed in the Canadian labour market over the last four decades raises the following question: how does job quality now compare across workers?
A Statistics Canada study (Chen and Mehdi 2018) uses the 2016 General Social Survey to answer this question. The authors show that not all workers were equally represented in high-quality jobs. For example, workers with a high school diploma or less education were more likely than other workers to have jobs with less flexible work schedules, low autonomy, and lack of training opportunities and employment benefits. Likewise, younger workers were more likely than older workers to hold jobs with involuntary and irregular work schedules. Nevertheless, young workers did relatively well in terms of manageable workload and access to informal training.
Several questions remain unanswered. One important question is about the degree to which advances in artificial intelligence and robotics will affect the overall number of jobs and their task content in the coming years. One plausible hypothesis is that the COVID-19 pandemic might accelerate the automation of certain tasks. Likewise, the COVID-19 pandemic might lead to a permanent increase in rates of telework and, more generally, to changes in work arrangements (e.g. shiftwork, configuration of office spaces) that facilitate physical distancing. Subsequent research should attempt to tackle these issues.
| Men | Women | |||||||||||
|---|---|---|---|---|---|---|---|---|---|---|---|---|
| Ages 25 to 34 | Ages 35 to 54 | Ages 25 to 34 | Ages 35 to 54 | |||||||||
| 1981 | 1999 | 2019 | 1981 | 1999 | 2019 | 1981 | 1999 | 2019 | 1981 | 1999 | 2019 | |
| percent | ||||||||||||
| Industry | ||||||||||||
| Public administration | 8.3 | 4.7 | 4.9 | 9.6 | 9.1 | 7.9 | 7.7 | 5.5 | 5.7 | 5.6 | 7.9 | 7.9 |
| Education, health care and social assistance | 9.2 | 8.0 | 8.2 | 10.9 | 10.1 | 9.9 | 30.0 | 26.2 | 34.3 | 30.5 | 33.8 | 37.8 |
| Manufacturing | 26.5 | 23.0 | 12.2 | 27.4 | 26.4 | 16.4 | 12.0 | 11.7 | 5.2 | 14.1 | 10.8 | 6.9 |
| Retail trade | 8.3 | 10.7 | 11.0 | 6.0 | 7.0 | 8.5 | 9.8 | 11.7 | 10.6 | 14.1 | 10.5 | 9.7 |
| Professional, scientific and technical services | 3.6 | 7.3 | 9.6 | 2.5 | 4.2 | 8.0 | 4.8 | 6.8 | 8.0 | 2.8 | 4.1 | 6.4 |
| Accommodation and food services | 2.5 | 4.6 | 5.8 | 2.0 | 2.5 | 3.2 | 5.7 | 7.6 | 6.9 | 6.9 | 5.2 | 4.6 |
| Mining and oil and gas extraction | 4.2 | 1.8 | 2.8 | 3.7 | 2.4 | 3.0 | 0.8 | 0.5 | 0.6 | 0.3 | 0.3 | 0.6 |
| Construction | 8.6 | 7.6 | 14.3 | 9.1 | 6.6 | 10.3 | 1.3 | 0.9 | 2.7 | 2.0 | 1.1 | 1.9 |
| Finance and insurance | 3.7 | 3.5 | 4.5 | 2.9 | 3.0 | 4.7 | 9.5 | 8.1 | 7.0 | 5.9 | 7.5 | 5.7 |
| Information and cultural industries | 3.0 | 3.7 | 2.2 | 2.4 | 3.1 | 2.5 | 3.2 | 3.2 | 1.7 | 2.8 | 3.0 | 1.6 |
| Transportation | 6.4 | 5.1 | 4.6 | 7.8 | 7.2 | 6.8 | 2.6 | 2.2 | 2.0 | 1.5 | 1.9 | 2.4 |
| Other industries | 15.8 | 20.1 | 19.9 | 15.6 | 18.4 | 18.9 | 12.6 | 15.5 | 15.2 | 13.5 | 13.9 | 14.4 |
|
Note: Main job held in May. Source: Statistics Canada, Labour Force Survey. |
||||||||||||
| Percentage of employees with: | Median real hourly wages in: | ||||||||
|---|---|---|---|---|---|---|---|---|---|
| (1) Full-time jobs |
(2) Permanent jobs |
(3) Full-time permanent jobs |
(4) Unionized jobs |
(5) Registered pension plans (RPPs) |
(6) Defined-benefit RPPs |
(7) All jobs |
(8) Full-time jobs |
(9) Part-time jobs |
|
| percent | 2019 dollars | ||||||||
| Both sexes | |||||||||
| 1981 | 87.4 | Note ..: not available for a specific reference period | Note ..: not available for a specific reference period | 37.6 | 44.6 | 41.8 | 21.17 | 22.08 | 15.18 |
| 1989 | 85.8 | 92.9 | 79.7 | 35.9 | 42.7 | 38.7 | 21.40 | 22.57 | 14.61 |
| 1999 | 83.6 | 88.1 | 75.9 | 30.1 | 40.8 | 34.5 | 21.47 | 22.82 | 13.23 |
| 2007 | 83.9 | 86.7 | 74.9 | 30.3 | 38.4 | 29.5 | 22.05 | 23.56 | 13.78 |
| 2017 | 83.5 | 85.8 | 74.0 | 29.2 | 37.1 | 24.9 | 23.64 | 25.53 | 14.67 |
| 2019 | 84.3 | 87.3 | 76.0 | 28.6 | Note ..: not available for a specific reference period | Note ..: not available for a specific reference period | 24.04 | 25.96 | 15.00 |
| Men | |||||||||
| 1981 | 94.9 | Note ..: not available for a specific reference period | Note ..: not available for a specific reference period | 42.1 | 51.4 | 47.8 | 24.15 | 24.84 | 13.80 |
| 1989 | 94.0 | 93.6 | 87.7 | 39.2 | 46.9 | 42.2 | 24.78 | 25.57 | 12.36 |
| 1999 | 91.6 | 88.6 | 83.1 | 30.5 | 42.0 | 34.8 | 24.11 | 25.00 | 11.76 |
| 2007 | 91.4 | 87.3 | 81.6 | 30.0 | 37.8 | 28.0 | 24.50 | 25.32 | 12.25 |
| 2017 | 89.3 | 86.0 | 79.0 | 27.4 | 35.1 | 21.4 | 25.72 | 27.08 | 13.62 |
| 2019 | 89.9 | 88.0 | 81.3 | 26.8 | Note ..: not available for a specific reference period | Note ..: not available for a specific reference period | 25.96 | 27.15 | 15.00 |
| Women | |||||||||
| 1981 | 77.2 | Note ..: not available for a specific reference period | Note ..: not available for a specific reference period | 31.4 | 34.8 | 33.0 | 17.94 | 18.43 | 15.45 |
| 1989 | 76.2 | 92.2 | 70.6 | 32.1 | 37.3 | 34.2 | 18.26 | 19.10 | 15.07 |
| 1999 | 75.1 | 87.5 | 68.2 | 29.6 | 39.4 | 34.2 | 19.09 | 20.59 | 14.69 |
| 2007 | 76.2 | 86.0 | 68.1 | 30.6 | 39.0 | 31.1 | 20.19 | 21.54 | 14.70 |
| 2017 | 77.5 | 85.6 | 69.0 | 31.0 | 39.3 | 28.7 | 22.00 | 24.09 | 15.71 |
| 2019 | 78.7 | 86.7 | 70.7 | 30.5 | Note ..: not available for a specific reference period | Note ..: not available for a specific reference period | 22.12 | 24.04 | 16.00 |
|
.. not available for a specific reference period Notes: Main job held in May. For 1989, columns 2 and 3 refer to employees aged 15 to 64. Columns 5 and 6 refer to all employees, regardless of their age. Sources: Statistics Canada, 1981 Survey of Work History, 1989 Labour Market Activity Survey, 1989 General Social Survey, Labour Force Survey, Pension Plans in Canada database, and Longitudinal Worker File. |
|||||||||
| Percentage of employees with: | Median real hourly wages in full-time jobs | ||||
|---|---|---|---|---|---|
| (1) Full-time jobs |
(2) Permanent jobs |
(3) Full-time permanent jobs |
(4) Unionized jobs |
||
| percent | 2019 dollars | ||||
| Men aged 25 to 34 | |||||
| 1981 | 97.9 | Note ..: not available for a specific reference period | Note ..: not available for a specific reference period | 43.3 | 25.83 |
| 1989 | 97.4 | 94.1 | 91.2 | 37.1 | 24.34 |
| 1999 | 95.1 | 89.1 | 85.8 | 24.2 | 23.13 |
| 2007 | 95.4 | 88.2 | 85.1 | 26.0 | 24.50 |
| 2019 | 93.3 | 88.1 | 83.6 | 24.7 | 26.00 |
| Men aged 35 to 54 | |||||
| 1981 | 98.4 | Note ..: not available for a specific reference period | Note ..: not available for a specific reference period | 46.8 | 27.40 |
| 1989 | 98.4 | 97.1 | 96.3 | 47.3 | 29.47 |
| 1999 | 97.1 | 93.0 | 91.3 | 38.3 | 28.69 |
| 2007 | 96.8 | 92.1 | 89.9 | 35.9 | 28.73 |
| 2019 | 96.2 | 93.1 | 90.4 | 30.3 | 31.00 |
| Women aged 25 to 34 | |||||
| 1981 | 80.5 | Note ..: not available for a specific reference period | Note ..: not available for a specific reference period | 34.7 | 20.03 |
| 1989 | 80.9 | 93.1 | 77.8 | 32.0 | 20.09 |
| 1999 | 81.2 | 88.2 | 73.4 | 26.1 | 20.54 |
| 2007 | 83.1 | 86.4 | 73.5 | 29.9 | 21.62 |
| 2019 | 84.6 | 86.2 | 74.5 | 29.1 | 24.00 |
| Women aged 35 to 54 | |||||
| 1981 | 75.0 | Note ..: not available for a specific reference period | Note ..: not available for a specific reference period | 34.9 | 19.32 |
| 1989 | 77.1 | 93.6 | 73.8 | 39.3 | 20.71 |
| 1999 | 79.0 | 91.1 | 73.8 | 36.4 | 22.61 |
| 2007 | 81.2 | 90.5 | 75.2 | 35.2 | 23.56 |
| 2019 | 85.0 | 91.5 | 79.4 | 35.9 | 26.44 |
|
.. not available for a specific reference period Note: Main job held in May. Sources: Statistics Canada, 1981 Survey of Work History, 1989 Labour Market Activity Survey, 1989 General Social Survey, and Labour Force Survey. |
|||||
References
Chen, W.-H., and T. Mehdi. 2018. Assessing Job Quality in Canada: A Multidimensional Approach. Analytical Studies Branch Research Paper Series, no. 412. Statistics Canada Catalogue no. 11F0019M. Ottawa: Statistics Canada.
Frenette, M., and K. Frank. 2020. Automation and Job Transformation in Canada: Who’s at Risk? Analytical Studies Branch Research Paper Series. Statistics Canada Catalogue no. 11F0019M. Ottawa: Statistics Canada. Forthcoming.
Jeon, S.-H., H. Lu and Y. Ostrovsky. 2019. Measuring the Gig Economy in Canada Using Administrative Data. Analytical Studies Branch Research Paper Series, no. 437. Statistics Canada Catalogue no. 11F0019M. Ottawa: Statistics Canada.
Morissette, R. 2018a. Changing Characteristics of Canadian Jobs, 1981 to 2018. Economic Insights, no. 86. Statistics Canada Catalogue no. 11-626-X. Ottawa: Statistics Canada.
Morissette, R. 2018b. Wages for Young Workers up to the Age of 40. Analytical Studies Branch Research Paper Series, no. 405. Statistics Canada Catalogue no. 11F0019M. Ottawa: Statistics Canada.
Morissette, R. 2020. The Impact of the Manufacturing Decline on Local Labour Markets in Canada. Analytical Studies Branch Research Paper Series, no. 440. Statistics Canada Catalogue no. 11F0019M. Ottawa: Statistics Canada.
Morissette, R., and M. Drolet. 2001. “Pension coverage and retirement savings of young and prime-aged workers in Canada, 1986–1997.” Canadian Journal of Economics 34 (1): 100–119.
Morissette, R., and A. Johnson. 2005. “Are good jobs disappearing in Canada?” Economic Policy Review 11 (1): 23−56.
Morissette, R., G. Picot, and Y. Lu. 2013. The Evolution of Canadian Wages over the Last Three Decades. Analytical Studies Branch Research Paper Series, no. 347. Statistics Canada Catalogue no. 11F0019M. Ottawa: Statistics Canada.
Morissette, R., G. Schellenberg, and A. Johnson. 2005. “Diverging trends in unionization.” Perspectives on Labour and Income 6 (4): 5–12. Statistics Canada Catalogue no. 75-001-X.
- Date modified: