
Economic Insights
Recent Developments in the Canadian Economy, 2020: COVID-19, second edition

Archived Content
Information identified as archived is provided for reference, research or recordkeeping purposes. It is not subject to the Government of Canada Web Standards and has not been altered or updated since it was archived. Please "contact us" to request a format other than those available.
This article in the Economic Insights series highlights sudden changes in economic conditions as households and businesses adjusted to social and economic restrictions intended to contain the spread of COVID-19. It is the second in a series of articles that provides integrated analysis of the economic impacts of COVID-19 as new data and information become available.
This second report is based on data that are publicly available as of June 19, 2020. It discusses the impact of COVID-19 on economic output in the first quarter of 2020 and in March as non-essential businesses began shuttering their operations. It then examines data on international trade, manufacturing and retail sales for April as the economic impacts of the shutdowns became more apparent. In addition, the article highlights changes in the employment data in May as restrictions on social and economic activity in several provinces began to ease.
Overview
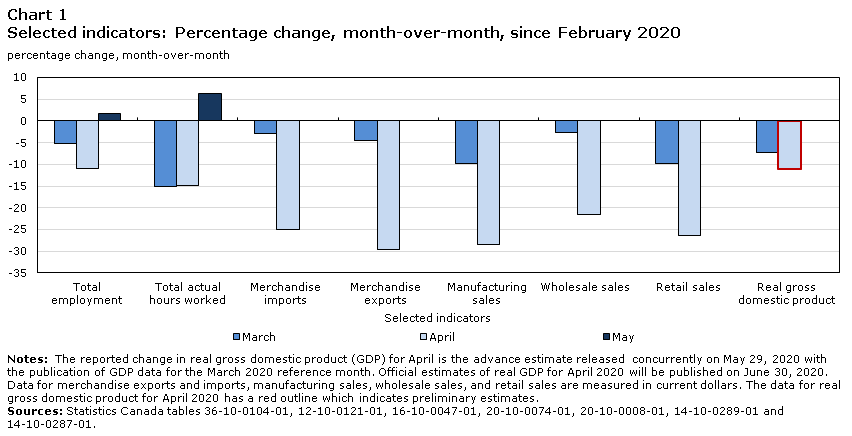
Real gross domestic product (GDP) fell by 7.2% in March as COVID-19 related shutdowns severely impacted the output of service industries. Real GDP contracted 2.1% in the first quarter, the largest quarterly decline since early 2009. Severe reductions in auto-related sales contributed to substantial declines in economic activity as the shutdowns extended through April. Merchandise trade activity in April fell to the lowest level in almost a decade, while manufacturing sales declined by almost 30%. Retail sales in April fell by over one-quarter. An advance estimate of real GDP, released by Statistics Canada at the end of May, pointed to an approximate 11% decline in April (Chart 1).
Following employment losses of three million during March and April, employment rose by 290,000 in May, led by gains in Quebec as restrictions on economic activity eased. The unemployment rate rose to a record 13.7% in May as the number of people searching for work increased substantially as job seekers re-entered the labour force. However, 1.4 million Canadians wanted to work in May but did not search for a job, while more than one-third of Canada’s potential labour force remained fully or partially underutilized.
Data table for Chart 1
| Selected indicators | March | April | May |
|---|---|---|---|
| percentage change, month-over-month | |||
| Total employment |
-5.3 | -11.0 | 1.8 |
| Total actual hours worked | -15.1 | -14.9 | 6.3 |
| Merchandise imports | -3.0 | -25.1 | Note ...: not applicable |
| Merchandise exports | -4.5 | -29.7 | Note ...: not applicable |
| Manufacturing sales | -9.8 | -28.5 | Note ...: not applicable |
| Wholesale sales | -2.7 | -21.6 | Note ...: not applicable |
| Retail sales | -9.9 | -26.4 | Note ...: not applicable |
| Real gross domestic product | -7.2 | -11 | Note ...: not applicable |
|
... not applicable Notes: The reported change in real gross domestic product (GDP) for April is the advance estimate released concurrently on May 29, 2020 with the publication of GDP data for the March 2020 reference month. Official estimates of real GDP for April 2020 will be published on June 30, 2020. Data for merchandise exports and imports, manufacturing sales, wholesale sales, and retail sales are measured in current dollars. The data for real gross domestic product for April 2020 has a red outline which indicates preliminary estimates. Sources: Statistics Canada tables 36-10-0104-01, 12-10-0121-01, 16-10-0047-01, 20-10-0074-01, 20-10-0008-01, 14-10-0289-01 and 14-10-0287-01. |
|||
Record decline in household spending
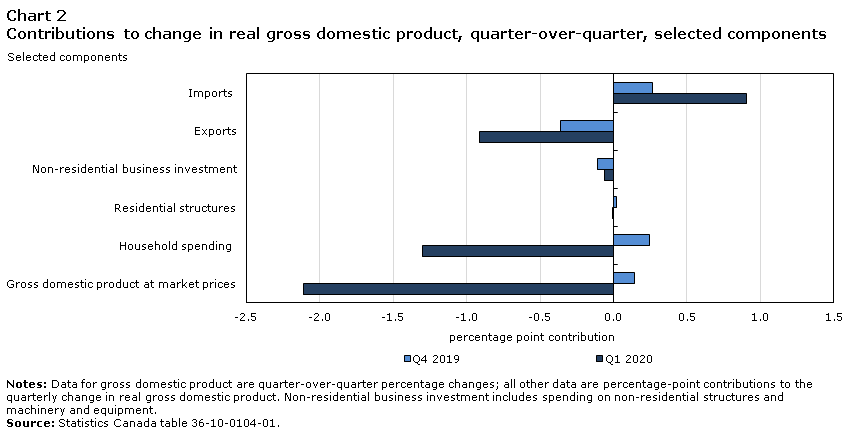
Real GDP declined 2.1% in the first quarter of 2020, the largest quarterly decrease since early 2009. Household expenditures fell by a record 2.3% as public health restrictions severely impacted economic activity during the last two weeks of March. Lower spending on services accounted for about two-thirds of the overall decrease in household spending, led by sharp reductions in food, beverage and accommodation services, and recreational services (Chart 2). Outlays on goods also fell as lower spending on autos and clothing was partly offset by higher spending on food.
Data table for Chart 2
| Selected components | Q1 2020 | Q4 2019 |
|---|---|---|
| percentage point contribution | ||
| Imports | 0.907 | 0.264 |
| Exports | -0.911 | -0.359 |
| Non-residential business investment | -0.061 | -0.112 |
| Residential structures | -0.008 | 0.021 |
| Household spending | -1.303 | 0.245 |
| Gross domestic product at market prices | -2.109 | 0.140 |
|
Notes: Data for gross domestic product are quarter-over-quarter percentage changes; all other data are percentage-point contributions to the quarterly change in real gross domestic product. Non-residential business investment includes spending on non-residential structures and machinery and equipment. Source: Statistics Canada table 36-10-0104-01. |
||
Export volumes were down 3.0% in the first quarter, the third consecutive decline and the largest quarterly decrease in almost four years. About two-thirds of the overall decrease in export volumes reflected declines in travel services, motor vehicles and parts, and aircrafts and other transportation equipment. Import volumes fell 2.8% in the first quarter, reflecting lower imports of electronics and electrical equipment, consumer products, travel services, industrial machinery and equipment, and motor vehicles and parts. Import volumes have contracted in three of the last four quarters.
Non-residential business investment was down 0.7% in the first quarter, reflecting lower outlays on machinery and equipment (M&E). Business expenditures on M&E have declined for four consecutive quarters, while spending on non-residential structures has advanced steadily since early 2019. After declining in late 2019, business outlays on intellectual property products increased 0.3% in the first quarter, supported by higher spending on software.
Final domestic demand, which reflects total consumption and investment activity, fell 1.5% in the first quarter, the largest quarterly decrease since the first quarter of 2009. Declines in the value of financial assets pushed household net worth lower in the first quarter as equities fell sharply in March in light of investor concerns over COVID-19. Business productivity rose sharply in the first quarter as declines in hours worked outpaced decreases in output.
Service industries severely impacted by shutdowns in March
The restrictions implemented in mid-March to contain COVID-19 reduced activity across many sectors of the economy. Real gross domestic product fell 7.2% in March as output declined in 19 out of 20 industrial sectors. Over 80% of March’s decline reflected lower output in the services sector as both private and public services were impacted by mandatory closures and physical distancing (Chart 3).
Accommodation and food services fell by 36.9% in March, the largest monthly decline on record. Transportation and warehousing contracted by 12.2% as travel restrictions and border closures impacted the sector. Retail trade fell by 9.6%, reflecting storefront closures and steep declines in auto-related sales. Educational services, health care and social assistance, and public administration were also down substantially, as activity in these industries was impacted by stay-at-home orders.
The output of manufacturers fell 6.5% in March, led by sharp declines in motor vehicle and parts manufacturing as producers shuttered operations on both sides of the Canada-U.S. border. Construction fell 4.4% in March, eclipsing the 3.3% decline observed in January 2009.
An advance estimate released by Statistics Canada at the end of May pointed to an 11% decline in real GDP in April.

Data table for Chart 3
| Selected industrial aggregates | percentage point contribution |
|---|---|
| Non-business sector: Services | -1.382 |
| Business sector: Services | -4.631 |
| Business sector: Goods | -1.193 |
| Gross domestic product at basic prices | -7.213 |
|
Notes: The data point for gross domestic product is the month-over-month percentage change for March 2020; all other data are percentage-point contributions to the change in real gross domestic product in March. Source: Statistics Canada, special tabulations. |
|
Steep declines in merchandise trade and manufacturing as plants shutter operations
Economic closures related to COVID-19 had severe impacts on Canadian trade flows in April, as shutdowns in manufacturing and consumer-oriented industries, coupled with sharp declines in energy prices, pushed total merchandise trade to its lowest monthly level in almost a decade. Merchandise exports fell by 30% in April to $32.7 billion, while merchandise imports declined by 25% to $35.9 billion. Almost all of the reduction in trade activity in April was due to lower trade between Canada and the United States, reflecting the high degree of economic integration between the two countries.
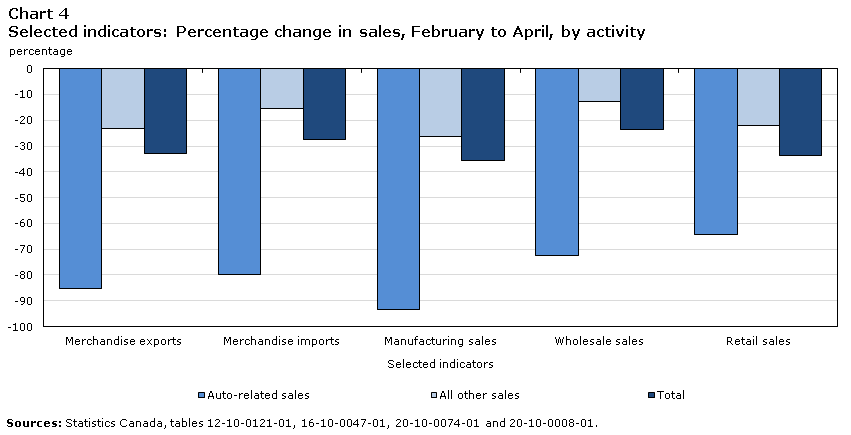
Severe reductions in auto-related trade contributed substantially to lower trade activity in April. Exports of motor vehicles and parts fell over 80%, as widespread shutdowns impacted auto production on both sides of the Canada-U.S. border (Chart 4). Lower shipments of motor vehicles and parts accounted for more than one-third of the overall decline in Canadian exports. Similarly, imports of motor vehicles and parts, down almost 80% in April, accounted for more than one-half of the overall decline in Canadian imports.
Data table for Chart 4
| Selected indicators | Auto-related sales | All other sales | Total |
|---|---|---|---|
| percentage | |||
| Merchandise exports | -85.3 | -23.4 | -32.8 |
| Merchandise imports | -79.8 | -15.3 | -27.4 |
| Manufacturing sales | -93.3 | -26.2 | -35.5 |
| Wholesale sales | -72.4 | -12.9 | -23.6 |
| Retail sales | -64.2 | -22.2 | -33.6 |
| Sources: Statistics Canada, tables 12-10-0121-01, 16-10-0047-01, 20-10-0074-01 and 20-10-0008-01. | |||
Sharp declines in energy-related trade also contributed to lower trade activity in April. Energy exports fell by over 40% on steep price reductions and lower volumes, while energy imports fell by more than 50%. Lower exports and imports of consumer goods were also contributing factors in April, as economic shutdowns impacted the demand for consumer products. Canada’s international trade in services also contracted sharply, led by severe reductions in travel services due to COVID-19 related border closures.
After declining in March to the lowest level in nearly four years, manufacturing sales fell by nearly 30% in April as over four in five establishments reported that COVID-19 impacted their activities. Total manufacturing sales in April were $36.4 billion, well below the lowest monthly level of $38.3 billion observed during the 2008-2009 recession. About one-third of April’s decline reflected lower sales of motor vehicles and parts, which fell by over 90% as all Canadian assembly plants and many parts suppliers ceased operations. Sales of petroleum and coal products fell by 46% in April as refineries curtailed production in response to weak demand. After strengthening in March, sales of food manufacturers fell by13% in April as operations at meat processing plants were impacted by COVID-19.
Severe declines in auto sales as retail spending falls
Following a 10% decline in March, retail sales fell by over one-quarter (-26.4%) in April to $34.7 billion. Sales at motor vehicles and parts dealers fell 44% and accounted for one-third of the overall decline in retail spending. Lower sales at food and beverage stores and gasoline stations also contributed to April’s decline. However, sales at food and beverage stores in April remained nearly 8% above the level in February. Based on respondent feedback, about one-third of retailers were closed during April, on average, for eight business days. E-commerce sales strengthened in April as many retailers started or expanded their online presence and curbside pick-up services in response to storefront closures. Online orders in April represented about 10% of total retail sales.
Data on new motor vehicle sales underscore the impact of COVID-19 on the auto sector. Measured on a year-over-year basis, new motor vehicle sales fell by 48.5% in March, and then by 74.6% in April, the two largest declines on record.
Headline consumer inflation falls into negative territory
The Consumer Price Index fell 0.2% on a year-over-year basis in April as lower energy prices pushed the headline rate into negative territory for the first time since September 2009. Gasoline prices, measured year-over-year, fell 39.3% in April, the largest decline on record.
The headline rate remained in negative territory in May as consumer prices, measured year-over-year, fell by 0.4%. While prices at the pump rose from April to May as many countries began easing restrictions related to COVID-19, gasoline prices in May remained 30% lower than in May of last year. Excluding gasoline prices, consumer inflation slowed to 0.7% in May, the smallest year-over-year increase since early 2013.
Employment begins to recover as several provinces ease restrictions
Following losses of three million during March and April, employment rose by 290,000 in May as several provinces began easing restrictions, allowing some non-essential businesses to re-open. Three-quarters of May’s headline increase was in full-time work, while nearly 80% of overall gains reflected higher employment in Quebec.
Employment in construction and manufacturing rose by 153,000, led by increases in Quebec as activity ramped up in these industries. Employment in wholesale and retail trade rose by 107,000 in May, also led by gains in Quebec. Ontario was the only province where employment continued to fall in May as restrictions on economic activity in that province largely remained in place.Note After declining by 27.7% from February to April, total hours worked rebounded by 6.3% in May, led by increases in wholesale and retail trade, construction and manufacturing.
Employment among core-age workers (25 to 54 year-olds) rose by 168,000 in May with gains split between core-age men and women (Chart 5). Employment among older workers rose by 92,000, almost entirely on increases among men. After falling by over 870,000 during March and April, employment among younger Canadians was relatively unchanged in May (+30,000).

Data table for Chart 5
| thousands of persons | March | April | May |
|---|---|---|---|
| thousands of persons | |||
| Youth male |
-163 | -229 | 26 |
| Youth female |
-230 | -251 | 3 |
| Core-age male |
-128 | -646 | 95 |
| Core-age female |
-299 | -491 | 73 |
| Older male |
-87 | -215 | 85 |
| Older female |
-105 | -162 | 7 |
|
Notes: Age groups: Youth=15 to 24 years; Core-age=25 to 54 years; Older=55 years and over. Source: Statistics Canada, table 14-10-0287-01. |
|||
After falling to a record low of 52.1% in April, Canada’s employment rate—the portion of the working age population that is employed—rose to 52.9% in May, about nine percentage points below the rate observed in February. The employment rate among core-age workers increased to 73.7% in May, after falling to the lowest level in April in over 35 years. Over 77 percent of core-age men were employed in May, compared to seven in ten core-age women. The employment rate among younger Canadians edged up to 38.8% in May and remained over 19 percentage points below the rate observed in February (Chart 6).
Canada’s unemployment rate rose to 13.7% in May as more people began looking for work, led by job seekers re-entering the labour force. However, the number of Canadians who wanted to work but did not look for a job remained high in May, declining to 1.4 million from 1.5 million in April. If adjusted to include these individuals, the unemployment rate in May would have been 19.6%. Over one-third of Canada’s potential labour force remained fully or partially underutilized in May.Note
Lower-wage workers—those that earned less than two-thirds of the 2019 median wage—were severely impacted by the business shutdowns during March and April as employment among this group fell by nearly 40%. Employment in lower-wage jobs began to recover in May with the initial easing of COVID-19 restrictions. Employment among lower-wage workers rose by 134,000, a recovery of just over 10% of the losses observed in March and April. Higher employment in wholesale and retail trade and in accommodation and food services supported the increase in lower-wage jobs in May.

Data table for Chart 6
| Age group | February | March | April | May |
|---|---|---|---|---|
| percentage | ||||
| Youth | 58 | 49.1 | 38.2 | 38.8 |
| Core age | 83.1 | 80.2 | 72.6 | 73.7 |
| Older | 36.1 | 34.3 | 31.1 | 31.8 |
|
Notes: Youth: 15 to 24 years; Core-age: 25 to 54 years; Older: 55 years and over. Source: Statistics Canada, table 14-10-0287-01. |
||||
New analysis of the potential impacts of COVID-19 on Canadian workers
Two new articles, released in June 2020, evaluated the potential impacts of COVID-19 on different segments of Canada’s labour force. Messacar, Morissette and Deng (2020) examined how the feasibility of working from home varies among families with different earnings profiles and levels of educational attainment. While about 40% of Canadians work in jobs that could be performed at home, the likelihood of doing so is far greater among higher earning and more educated families.
The authors show, for example, that over 50% of dual-earner families in the top decile of the earnings distribution hold jobs in which both husbands and wives can work from home, more than twice the rate of dual-earner families located closer to the middle of the earnings distribution. Conversely, less than 10% of dual-earner families with among the lowest earnings have jobs in which both partners can work from home. The prevalence of working from home also increases sharply with the educational attainment of the primary income earner. About two-thirds of primary earners with a bachelor’s degree or higher can work from home, compared to less than 30% of high school graduates.
An analysis by Chan, Morissette and Qiu (2020) provides some initial guidance on the potential impacts of COVID-19 related job losses on the longer term earnings of affected workers. The authors note that during the past three Canadian recessions, younger workers, less educated workers, and recent hires were more likely to be laid-off, temporarily or permanently, than other employees (patterns that are also apparent in the employment losses due to COVID-19). During these earlier recessions, about 45% of all laid-off workers were permanently laid-off, while 15% of remaining workers who were temporarily laid-off lost their jobs in the following year. As the authors note, the degree to which COVID-19 results in permanent layoffs will have a major impact on how the pandemic affects Canadian workers over the longer term. Looking back over recent decades, at least one in five Canadian workers who was permanently laid-off experienced earnings declines of at least 25% five years after the job loss.
References
Chan, W., R. Morissette, and H. Qiu. 2020. COVID-19 and job displacement: Thinking about the longer term. Catalogue no. 45-28-0001. Ottawa: Statistics Canada.
Messacar, D., R. Morissette, and Z. Deng. 2020. Inequality in the feasibility of working from home during and after COVID-19. Ottawa: Statistics Canada.
- Date modified: