
Economic Insights
Foreign-owned Affiliates in Canada: Trends across Major Sectors

Archived Content
Information identified as archived is provided for reference, research or recordkeeping purposes. It is not subject to the Government of Canada Web Standards and has not been altered or updated since it was archived. Please "contact us" to request a format other than those available.
Analytical Studies Branch, Statistics Canada
This Economic Insights article presents estimates of the nominal output of foreign-owned multinationals operating in different sectors of Canada’s economy. It examines changes in the value added of foreign majority-owned affiliates, highlighting contributions by country of control.Note Estimates are examined separately for affiliates operating in resource, manufacturing and service industries.
Developed by the Canadian Macroeconomic Accounts, the data summarized in this article are part of a series of projects designed to provide more detailed information on the global dimensions of Canada’s economy. Annual estimates of the value added of foreign-owned affiliates are currently available from 2010 to 2016. The ongoing development of these data will be used to support more in-depth analysis and monitoring of changes in the industrial organization of foreign ownership.Note
Introduction
The Canadian economy experienced two consecutive annual declines in goods production in 2015 and 2016 as firms and investors adjusted to lower oil prices. Lower goods output during these years reflected inter alia substantial reductions in support activities for mining and oil and gas extraction and engineering construction—industries where production activities support the creation of large scale capital assets. While resource and construction output declined during this period, the output of manufacturing and service industries continued to advance, albeit at a slower pace.Note
There is substantial interest in how these developments affected the operations of foreign-owned firms in Canada, especially in light of sizable declines in inward foreign direct investment as capital spending shifted away from the energy sector.Note This article examines changes in the nominal output of foreign multinationals operating in resource, manufacturing and service industries using new annual output data on foreign majority-owned affiliatesNote . It contrasts recent declines in resource output with gains in manufacturing and services, highlighting the extent to which these reflect output changes among U.S., European and Asian-based multinationals.
As a group, the economic weight of foreign-owned affiliates is substantial. In 2016, they accounted for 14% of Canada’s gross domestic product and employed 12% of workers. Affiliates in that year also accounted for over one-half of total merchandise trade and over two-thirds of cross-border trade in technological services.
About one-quarter of all majority-owned affiliates operate in goods-producing industries.Note The output share of these companies in the goods sector is larger. In 2016, foreign affiliates engaged in either manufacturing or resource extraction accounted for half of the nominal output of foreign multinationals, down from 54% in 2010. Goods-based affiliates tend to be large, trade-intensive companies that operate along multinational supply chains, either by sourcing inputs from abroad and/or by exporting products to international customers. Sixty percent of goods-producing affiliates both import and export merchandise products, while another 16% engage in one-way trade (either importing or exporting).Note
Affiliates operating in service industries tend to be smaller companies that, on balance, are more likely to source their inputs domestically and sell to domestic customers. One-half of these service firms do not have merchandise import or export activities.
Lower output among U.S. and U.K.-based affiliates in the resource sector
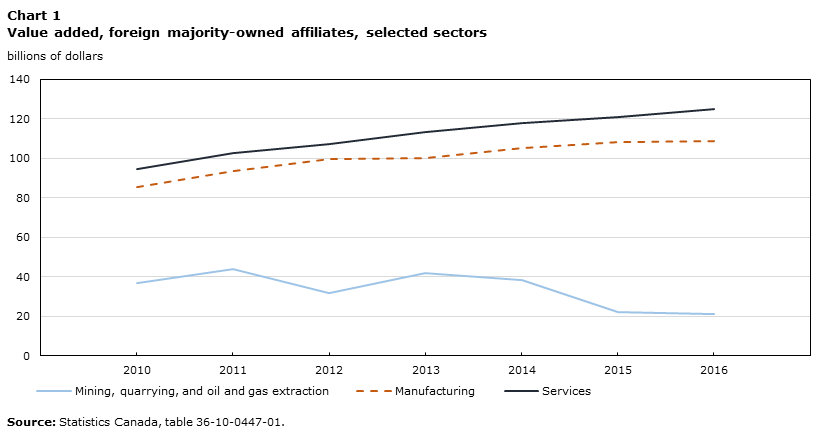
After trending higher following the recession, the nominal output of foreign affiliates in mining, quarrying and oil and gas extraction contracted sharply in 2015 and 2016 as a result of lower energy prices (Chart 1 and Table 1). In 2016, foreign-owned resource companies accounted for 8% of all value added generated by foreign multinationals, about one-half of their output share in 2010. Lower resource output in recent years reflected sizable declines among U.S.-owned and European-owned firms. American-owned affiliates bore the bulk of this decline, as their share of resource output among foreign producers declined from 53% in 2010 to 48% in 2016. Declines among European multinationals largely reflected lower output among British-owned firms (Chart 2).
Data table for Chart 1
| 2010 | 2011 | 2012 | 2013 | 2014 | 2015 | 2016 | |
|---|---|---|---|---|---|---|---|
| billions of dollars | |||||||
| Mining, quarrying, and oil and gas extraction | 36.9 | 43.8 | 31.7 | 42.0 | 38.4 | 22.1 | 21.1 |
| Manufacturing | 85.5 | 93.6 | 99.5 | 100.1 | 105.3 | 108.3 | 108.5 |
| Services | 94.3 | 102.6 | 107.3 | 113.5 | 117.8 | 120.9 | 125.1 |
| Source: Statistics Canada, table 36-10-0447-01. | |||||||
| 2010 | 2014 | 2016 | |
|---|---|---|---|
| billions of dollars | |||
| All sectors - total | 224.8 | 275.5 | 267.1 |
| Mining, quarrying, and oil and gas extraction | 36.9 | 38.4 | 21.1 |
| Manufacturing - total | 85.5 | 105.3 | 108.6 |
| Transportation equipment manufacturing | 12.8 | 18.5 | 21.6 |
| Chemical manufacturing | 9.2 | 13.3 | 15.4 |
| Petroleum and coal product manufacturing | 10.2 | 14.7 | 7.7 |
| Other manufacturing | 53.3 | 58.8 | 63.8 |
| Services - total | 94.3 | 117.8 | 125.1 |
| Wholesale trade | 25.1 | 34.4 | 36.8 |
| Professional, scientific and technical services | 12.5 | 19.9 | 18.9 |
| Retail trade | 14.2 | 16.0 | 18.4 |
| Finance and insurance | 14.2 | 14.4 | 14.9 |
| Others | 28.3 | 33.3 | 36.1 |
| Source: Statistics Canada, table 36-10-0447-01. | |||
While the output of Asian and OceanianNote resource companies also fell in 2015 and 2016, their share of total output among foreign producers has risen significantly over time (Chart 2). Companies from this region produced 19% of the nominal output of foreign affiliates in the resource sector in 2016, up from 5% in 2010. This was primarily due to the increased activities of Chinese-owned multinationals, as both the number and average output of Chinese-owned firms rose during this six-year period.

Data table for Chart 2
| 2016 | 2010 | |
|---|---|---|
| billions of dollars | ||
| United States | 10.1 | 19.6 |
| Asia and Oceania | 4.0 | 2.0 |
| Europe | 4.9 | 14.5 |
| Source: Statistics Canada, table 36-10-0582-01. | ||
Gains in foreign-owned manufacturing supported by transportation equipment and chemicals
Four out of five majority-owned affiliates in the manufacturing sector engaged in two-way trade, often as part of multinational supply chains. In 2010, foreign affiliates in the manufacturing sector accounted for 38% of the value added produced by foreign multinationals in Canada. By 2016, this share had risen to 41%, supported by gains among transportation equipment firms and chemical producers (Table 1).Note
The nominal output of foreign-owned manufacturers expanded rapidly prior to the onset of lower energy prices in 2015. From 2010 to 2014, the value added of affiliates in the manufacturing sector grew by 23%. Higher output among transportation equipment firms, petroleum and coal product manufacturers, and chemical producers all contributed to increases during this period as nominal output per firm in each of these industries expanded. Gains among foreign-owned affiliates in manufacturing moderated in 2015 and 2016 as price-led declines in petroleum and coal products detracted from growth. Excluding petroleum and coal, the output of manufacturing-based affiliates rose by 11% during this two-year period, led by increases in transportation equipment and chemical industries.
U.S. and Japanese-owned manufacturers advanced
About one-third of the total increases in value added among manufacturing-based affiliates from 2010 to 2016 reflected higher output among U.S.-owned companies. Nonetheless, the U.S. share of foreign-owned manufacturing declined during this period, from 54% to 50%, as the output share of Asian-owned manufacturers increased from 10% to 16%. Nearly one-half of the increase among Asian-owned multinationals can be attributed to gains among Japanese-owned companies. At the same time, Dutch, Swiss and Italian-owned affiliates accounted for about 60% of the total increase among European-owned manufacturers.

Data table for Chart 3
| 2016 | 2010 | |
|---|---|---|
| billions of dollars | ||
| United States | 53.8 | 46.3 |
| Japan | 10.1 | 6.0 |
| France | 4.9 | 5.5 |
| Netherlands | 4.6 | 2.9 |
| Germany | 4.3 | 3.8 |
| United Kingdom | 4.1 | 4.3 |
| Italy | 2.7 | 1.3 |
| Ireland | 1.7 | 0.4 |
| Source: Statistics Canada, table 36-10-0582-01. | ||
U.S. wholesalers supported gains in services
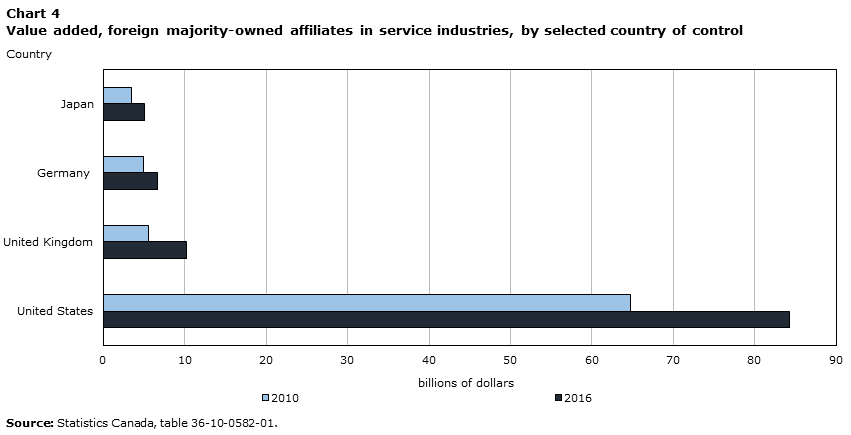
Foreign-owned companies operating in service industries accounted for about three quarters of all majority-owned affiliates operating in Canada. These service companies employ about two-thirds of all people working for Canadian affiliates of foreign multinationals. American firms are well represented within this group. In 2016, U.S.-owned service firms accounted for over two-thirds of the output produced by foreign multinationals in the service sector.
The nominal output of affiliates in service industries has advanced steadily since the 2008-2009 recession. In 2016, service companies produced 47% of the value added of foreign-owned affiliates, up from 42% in 2010. One third of this overall increase in services output reflected gains among wholesalers, led by increases among U.S.-owned firms.Note Affiliates that provide professional, scientific and technical services also contributed to higher services output, led by increases among U.S.-owned companies. Foreign affiliates of Irish, Swedish and French multinationals also contributed to higher output among professional service firms.
Higher output among U.K.-owned and German-owned affiliates also supported increases in value added among foreign multinationals operating in the service sector. Higher value added among management, finance and insurance firms contributed to gains among U.K.-owned multinationals, while increases among finance and insurance firms contributed to gains among German multinationals.
Data table for Chart 4
| 2016 | 2010 | |
|---|---|---|
| billions of dollars | ||
| United States | 84.3 | 64.8 |
| United Kingdom | 10.2 | 5.5 |
| Germany | 6.6 | 4.9 |
| Japan | 5.0 | 3.5 |
| Source: Statistics Canada, table 36-10-0582-01. | ||
Conclusion
This article highlights changes in the nominal output of foreign majority-owned affiliates operating in resource, manufacturing and service industries. It examines annual changes in value-added from 2010 to 2016, the period for which these new data are currently available. Much of the decline in resource output in 2015 and 2016 reflected lower value added among U.S. and U.K.-owned affiliates. Asian-owned companies, led by Chinese multinationals, have increased their share of resource output since 2010.
The nominal output of foreign multinationals operating in the manufacturing sector has also advanced in recent years. Excluding declines among petroleum and coal producers, the value added of foreign-owned manufacturers rose by 11% from 2014 to 2016, led by increases in transportation equipment and chemicals. The output of service-based affiliates also expanded in recent years, supported by gains among U.S. wholesalers.
This article sets the stage for more in-depth studies and monitoring of recent changes in the industrial organization of foreign ownership as data on foreign-owned affiliates continues to develop. Future articles and data releases will focus on the recovery in oil prices in 2017 and incorporate additional measures of multinational activity.
References
Gellatly, G. and C. McCormack. 2019. Recent Developments in the Canadian Economy: Spring 2019. Economic Insights, no. 93. Statistics Canada Catalogue no. 11-626-X. Ottawa: Statistics Canada.
Gellatly, G. and E. Richards. 2017. Recent Developments in the Canadian Economy: Spring 2017. Economic Insights, no. 72. Statistics Canada Catalogue no. 11-626-X. Ottawa: Statistics Canada.
Richards, E. 2017a. Recent Developments in the Canadian Economy: How have the decline in oil prices and a weaker Canadian dollar affected Canada’s economy? A presentation series from Statistics Canada about the economy, environment and society. Statistics Canada Catalogue no. 11-631-X. Ottawa: Statistics Canada.
Richards, E. 2017b. Motor Vehicle manufacturers reposition in 2015. Economic Insights, no. 68. Statistics Canada Catalogue no. 11-626-X. Ottawa: Statistics Canada.
- Date modified: