
Economic Insights
Residential Property Ownership Among Refugees in
Vancouver and Toronto

Archived Content
Information identified as archived is provided for reference, research or recordkeeping purposes. It is not subject to the Government of Canada Web Standards and has not been altered or updated since it was archived. Please "contact us" to request a format other than those available.
This article in the Economic Insights series highlights new data on homeownership among residents who came to Canada as resettled refugees. It reports on how the stock of refugee-owned housing in Vancouver and Toronto compares to that of Canadian-born residents, highlighting differences in property values across various segments of the housing market. Information on the location, age and size of properties and on the age and income of property owners is used to assess relative differences in property values between the two groups. Estimates are based on data developed by the Canadian Housing Statistics Program, released in December 2018.
Introduction
From 1980 to 2017, Canada welcomed 1,088,000 refugees, an average of about 30,000 per year. For many refugees, homeownership is an important milestone in their path to social and economic integration. Investments in housing may be a key retirement asset and a source of wealth creation within this community. While recent research has highlighted the labour market outcomes of refugees (Picot, Zhang, and Hou, 2019) and the type and value of housing owned by immigrants (Gellatly and Morissette, 2018), less is known about the extent to which the homeownership patterns of refugees differ from those of the Canadian born.
Using data from the Canadian Housing Statistics Program (CHSP) and the 2016 Census of Population, this article addresses this gap. It compares the homeownership rates of resettled refugee families to the Canadian-born and documents how the type and value of residential properties owned by refugees differ from those owned by Canadian-born residents. The focus of the article is on housing owned by resettled refugees in the cities of Vancouver and Toronto.Note
A recent study from Statistics Canada (Gellatly and Morissette, 2018) highlighted qualitative differences in the housing markets of Vancouver and Toronto insofar as they relate to immigrant-owned housing. Single-detached houses owned by immigrants in Vancouver were found to have substantially higher average property values than those owned by Canadian-born residents. This is particularly true of houses owned by recent immigrants. Notable differences in housing values are apparent in Vancouver when recent immigrant owners are differentiated on the basis of immigration category and country of birth—with higher housing values among recent investor immigrants and immigrants from China. In Toronto, overall differences in the value of immigrant-owned homes and those owned by Canadian-born residents are much less apparent. This is true both among immigrant-owned properties generally, and among those owned by recent immigrants.
This article extends the analysis of immigrant-owned properties in Vancouver and Toronto to persons who came to Canada as resettled refugees. It highlights basic differences in the relative value of their housing assets as compared to the Canadian born.
Rates of homeownership are lower among refugees, largely because of lower incomes
Although more than half of resettled refugee families in Toronto and Vancouver owned their own home in 2016, their rates of homeownership are lower than among Canadian-born families. In Vancouver, 50% of refugee families owned residential property in 2016, compared to 61% of their Canadian-born counterparts (Table 1). The corresponding percentages for Toronto are 59% and 65%, respectively.Note
In both cities, families of refugees generally exhibit lower rates of homeownership irrespective of the age, education level, or sex of the primary household maintainer. However, the incidence of homeownership varies across occupations. Refugee families whose primary household maintainer works in health, trades and transport occupations have homeownership rates that are comparable to their Canadian-born counterparts. This suggests that differences in household income may play a major role in explaining overall differences in homeownership between the two groups.Note
The data presented in Table 1 support this view. In Toronto, rates of homeownership among refugee families are actually higher than those among Canadian-born families when households with similar income levels are compared. Likewise, gaps in homeownership rates are reduced or eliminated in Vancouver after adjusting for differences in family income. Regression analysis confirms the strong link between income and homeownership even after adjusting for differences in age, sex and education. In Toronto, all of the six percentage point gap in homeownership rates between resettled refugee and Canadian-born families can be explained by lower incomes on the part of the former. Similarly, about 80% of the gap in Vancouver is accounted for by income differences.
| Vancouver | Toronto | |||
|---|---|---|---|---|
| Canadian-born | Resettled refugees | Canadian-born | Resettled refugees | |
| percent | ||||
| All | 60.5 | 50.0 | 65.1 | 59.4 |
| Age of household maintainer | ||||
| 15 to 34 | 33.5 | 33.9 | 37.1 | 37.4 |
| 35 to 44 | 58.7 | 44.8 | 68.7 | 55.7 |
| 45 to 54 | 66.0 | 52.4 | 74.2 | 63.1 |
| 55 to 64 | 70.0 | 57.0 | 74.3 | 66.2 |
| 65 and over | 74.4 | 52.6 | 73.0 | 54.7 |
| Education of household maintainer | ||||
| High school or less | 57.2 | 46.6 | 57.9 | 54.2 |
| Some PSE below BA | 60.3 | 53.5 | 65.6 | 63.8 |
| BA or more | 65.4 | 57.1 | 71.2 | 68.3 |
| Sex of household maintainer | ||||
| Men | 63.6 | 52.5 | 70.0 | 64.2 |
| Women | 56.2 | 44.6 | 58.7 | 48.6 |
| Size-adjusted household income after tax (2015 dollars) | ||||
| Less than $25,000 | 31.7 | 26.7 | 30.4 | 32.3 |
| $25,000 to $44,999 | 51.7 | 52.1 | 53.2 | 62.3 |
| $45,000 to $64,999 | 66.9 | 68.7 | 70.4 | 80.0 |
| $65,000 or more | 80.3 | 78.6 | 84.3 | 88.2 |
| Economic family is in low income? | ||||
| No | 66.9 | 60.9 | 71.3 | 71.5 |
| Yes | 24.3 | 23.2 | 26.7 | 27.4 |
| Household maintainer worked full year full-time in 2015? | ||||
| No | 58.3 | 41.3 | 59.0 | 45.8 |
| Yes | 62.8 | 60.2 | 69.8 | 73.5 |
| Occupation of household maintainer | ||||
| Management | 70.2 | 65.1 | 77.4 | 77.7 |
| Business, finance and administration | 60.3 | 54.5 | 64.7 | 71.1 |
| Natural and applied sciences and related occupations | 63.2 | 60.9 | 71.5 | 80.7 |
| Health | 62.4 | 61.6 | 69.1 | 68.9 |
| Education, law and social, community and government services | 63.6 | 51.5 | 69.4 | 61.1 |
| Art, culture, recreation and sport | 45.6 | 43.2 | 52.6 | 58.1 |
| Sales and services | 46.8 | 45.6 | 52.2 | 56.1 |
| Trades, transport and equipment operators and related occupations | 58.4 | 56.6 | 67.0 | 67.0 |
| Natural resources, agriculture and related production occupations | 46.3 | 69.9 | 61.3 | 63.8 |
| Occupations in manufacturing and utilities | 55.4 | 53.5 | 60.5 | 71.8 |
| Did not work in 2015 and 2016 | 65.5 | 33.1 | 61.8 | 34.2 |
|
Note: Refugees arrived from 1980 to 2016. Source: Statistics Canada, Census of Population of 2016. |
||||
Resettled refugees own proportionately fewer single detached homes in both cities
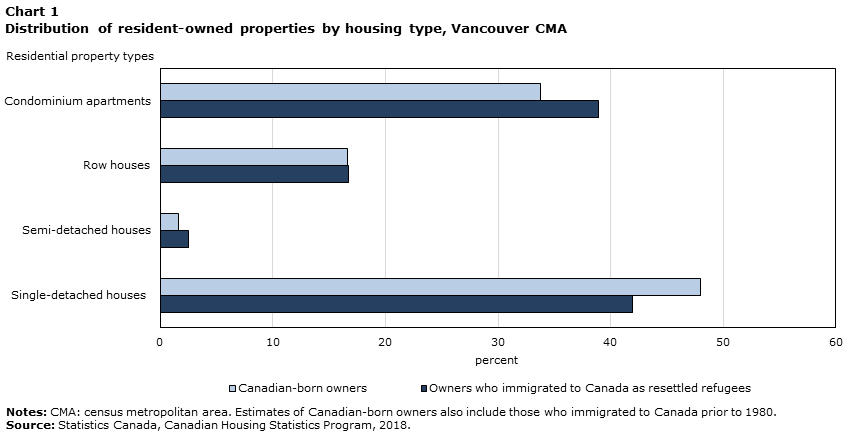
Properties owned by resettled refugees account for a very small share of the housing market in both cities.Note Less than 2% of residential properties in Vancouver and 3% of residential properties in Toronto are owned by individuals who came to Canada as resettled refugees.Note In both cities, refugee homeowners are less invested than Canadian-born owners in the single-detached segment of the housing market. Single-detached properties account for 42% of all Vancouver properties owned by resettled refugees, compared to 48% of those owned by Canadian-born residents (Chart 1). Resettled refugees own proportionately more condominium apartments in Vancouver than their Canadian-born counterparts.Note In Toronto, resettled refugee homeowners also own proportionately fewer single detached houses than the Canadian-born, and are slightly more invested in semi-detached houses and row units. Nonetheless, single detached homes account for 54% of refugee-owned properties in that city, and 60% of properties with Canadian-born owners.Note
Data table for Chart 1
| Single-detached houses | Semi-detached houses | Row houses | Condominium apartments | |
|---|---|---|---|---|
| percent | ||||
| Owners who immigrated to Canada as resettled refugees | 41.9 | 2.5 | 16.7 | 38.9 |
| Canadian-born owners | 48.0 | 1.6 | 16.6 | 33.8 |
|
Notes: CMA: census metropolitan area. Estimates of Canadian-born owners also include those who immigrated to Canada prior to 1980. Source: Statistics Canada, Canadian Housing Statistics Program, 2018. |
||||

Data table for Chart 2
| Single-detached houses | Semi-detached houses | Row houses | Condominium apartments | |
|---|---|---|---|---|
| percent | ||||
| Owners who immigrated to Canada as resettled refugees | 53.7 | 14.3 | 13.5 | 18.5 |
| Canadian-born owners | 60.4 | 11.0 | 9.7 | 19.0 |
|
Notes: CMA: census metropolitan area. Estimates of Canadian-born owners also include those who immigrated to Canada prior to 1980. Source: Statistics Canada, Canadian Housing Statistics Program, 2018. |
||||
Homeownership patterns can vary between more established refugees and more recent arrivals. Single detached houses account for 48% of Vancouver properties owned by resettled refugees that came to Canada in the 1980s—equivalent to the share among Canadian-born residents. This declines to 38% among homeowners in Vancouver that came as resettled refugees in the 1990s, and to under 25% among refugees that arrived since 2000. These differences are not apparent in Toronto, as single detached houses account for over 50% of the properties owned by resettled refugees, regardless of whether they landed in the 1980s, 1990s or 2000s.
Homeownership patterns among refugees also vary by source country. In Vancouver, over one-half of resettled refugee homeowners came from Viet Nam, Poland or Iran. Single-detached dwellings account for 60% of the properties in that city owned by resettled refugees from Viet Nam, compared to 42% and 37% among those from Poland and Iran. Resettled refugees from Viet Nam, Poland and Iran also account for about one-half of refugee homeowners in Toronto – in each of these cases, however, single-detached properties account for over half of their residential assets.Properties owned by resettled refugees have lower average assessment values
Table 2 compares the average assessment values of properties owned by resettled refugees to those of Canadian-born owners. In both cities, refugees own less expensive properties. In Vancouver, single-detached houses owned by resettled refugees have an average assessment value of $1.28 million, about 15% less the corresponding average among Canadian-born owners (a difference of $228,800). Similarly, the average value of condominium apartments owned by resettled refugees in Vancouver is 17% lower than those owned by Canadian-born residents (a difference of $103,700). Similar differences between the two groups are apparent in Toronto. Single-detached properties owned by refugees, at $768,800, have an average value which is about 10% less than those owned by Canadian-born residents. The average value of refugee-owned condominium apartments is 22% lower.Note
| Average assessment value | Median assessment value | |||||
|---|---|---|---|---|---|---|
| Owners who immigrated to Canada as resettled refugees | Canadian-born owners | Difference | Owners who immigrated to Canada as resettled refugees | Canadian-born owners | Difference | |
| 2017 dollars | ||||||
| Vancouver | ||||||
| All property types | 861,400 | 1,073,000 | -211,600 | 710,600 | 851,000 | -140,400 |
| Single detached | 1,283,600 | 1,512,400 | -228,800 | 1,142,000 | 1,254,100 | -112,100 |
| Semi-detached | 1,009,400 | 1,270,200 | -260,800 | 987,000 | 1,205,000 | -218,000 |
| Row house | 583,900 | 706,900 | -123,000 | 545,600 | 617,000 | -71,400 |
| Condominium | 516,000 | 619,700 | -103,700 | 463,000 | 515,000 | -52,000 |
| 2016 dollars | ||||||
| Toronto | ||||||
| All property types | 614,800 | 715,000 | -100,200 | 572,000 | 618,000 | -46,000 |
| Single detached | 768,800 | 849,300 | -80,500 | 696,000 | 724,000 | -28,000 |
| Semi-detached | 562,000 | 656,800 | -94,800 | 538,000 | 587,000 | -49,000 |
| Row house | 451,400 | 520,600 | -69,200 | 441,000 | 463,000 | -22,000 |
| Condominium | 328,300 | 420,400 | -92,100 | 303,000 | 359,000 | -56,000 |
|
Note: In this table, property estimates for Canadian-born owners also include properties owned by individuals who immigrated to Canada prior to 1980. Estimates for residents who came to Canada as refugees are based on those who landed from 1980 to 2016. Source: Statistics Canada, Canadian Housing Statistics Program. |
||||||
Property and owner characteristics explain differences in property value
The CHSP data contain information on a range of property-level characteristics—including the location, size, and age of dwellings—that contribute to the observed differences in assessment value reported in Table 2. The CHSP data also includes information on the age and family income of property owners, which may also influence differences in property value between the two groups. Table 3 reports on differences in housing value between resettled refugee owners and Canadian-born owners when accounting for these characteristics.
| Control variables | No controls | Property characteristics | Owner characteristics | Both property and owner characteristics |
|---|---|---|---|---|
| 2017 dollars | ||||
| Vancouver | ||||
| All properties | -211,500Note *** | -95,400Note *** | -105,400Note *** | -53,400Note *** |
| Single detached | -228,800Note *** | -184,700Note *** | -54,000Note *** | -124,300Note *** |
| Semi-detached | -260,900Note *** | -88,000Note *** | -155,900Note *** | -40,000 |
| Row house | -123,000Note *** | -35,300Note *** | -76,000Note *** | -19,500Note *** |
| Condominium | -103,600Note *** | -11,700Note *** | -68,500Note *** | -10,700Note *** |
| 2016 dollars | ||||
| Toronto | ||||
| All properties | -100,200Note *** | -62,700Note *** | -58,900Note *** | -47,900Note *** |
| Single detached | -80,400Note *** | -58,900Note *** | -21,600Note *** | -42,800Note *** |
| Semi-detached | -94,900Note *** | -42,200Note *** | -65,800Note *** | -36,300Note *** |
| Row house | -69,200Note *** | -45,700Note *** | -50,400Note *** | -40,200Note *** |
| Condominium | -92,100Note *** | -37,400Note *** | -60,400Note *** | -34,000Note *** |
Source: Statistics Canada, Canadian Housing Statistics Program. |
||||
The first column in Table 3 reports the unadjusted differences in property value discussed earlier. The second column presents adjusted estimates of the gap that control for differences in the size, age and location of properties (measured at the census subdivision level). In both cities, and for all types of housing examined, adjusting for these characteristics reduces the gap in property value between resettled refugee owners and Canadian-born owners.
In Vancouver, controlling for these property-level characteristics has a relatively modest effect on the observed gap for single detached dwellings, and a larger impact on other housing types. Before adjustment, the average value of single detached dwellings owned by resettled refugees in Vancouver is $228,800 less than those owned by Canadian-born residents. Adjusting for the size, age and location of these properties reduces the gap by about 20% to $184,700. By comparison, most of the difference in property value for refugee-owned condominium apartments is eliminated when controlling for these property characteristics (the gap narrows from $103,600 to $11,700). The pattern is qualitatively similar in Toronto. Adjusting for property characteristics reduced the gap associated with refugee-owned single detached dwellings by almost 30%, and by about 60% for condominium apartments.
The third column of Table 3 presents adjusted estimates of the gap that control for differences in the age and family income of owners (without taking into account property-level characteristics). Comparing owners with equivalent age and income profiles substantially reduces the gap associated with refugee-owned single detached houses. In Vancouver, this gap narrows from $228,800 to $54,000, while the corresponding gap in Toronto declines from $80,400 to $21,600. In both cities, controlling for these owner characteristics also has a qualitatively large impact on observed differences in property value for other housing types.
The last column in Table 3 re-estimates the gap taking both property and owner characteristics into account. While the combined effect of these characteristics varies across housing types, all of the adjusted estimates show substantial reductions in the gap when compared to the unadjusted differences reported earlier. Dwelling and owner characteristics are both important factors that help explain differences in property value between refugee and Canadian-born owners.
Conclusion
This article examines rates of homeownership and the characteristics of the residential properties owned by resettled refugees in Vancouver and Toronto. Using Census data, the study shows that homeownership rates in Toronto and Vancouver are lower among refugees to Canada than among the Canadian-born. In both cities, most of the observed difference in rates of homeownership can be explained by differences in family income after controlling for the age, education level, and sex of the primary household maintainer.
Using data developed by the CHSP, the article compares the value of dwellings owned by resettled refugees to those owned by Canadian-born residents, focusing of different segments of the housing market in both cities. The article also evaluates the extent to which the location, age and size of properties and the age and income of property owners can explain differences in property value between the two groups.
Resettled refugees own just under 2% of all resident-owned residential properties in Vancouver and 3% of resident-owned residential properties in Toronto. In both cities, refugee homeowners own proportionately fewer single detached houses than their Canadian-born counterparts. Refugees in Vancouver own proportionately more condominium apartments, while those in Toronto are slightly more invested than Canadian-born owners in semi-detached houses and row houses. Among all of the housing types examined, refugee-owned properties have lower average property values than those owned by Canadian-born residents.
Average differences in property value between the two groups are shown to be strongly influenced by the size, age and location of these properties or by the age and family income of property owners. In both cities, property level characteristics account for much of the lower value associated with refugee-owned condominium apartments, while the age and family income of property owners strongly influence the observed gap in the value of refugee-owned single-detached houses.
A few limitations must be noted. Because refugees from different source countries generally arrived at different time periods, differences in homeownership rates and property values among groups of refugees from different countries cannot be fully assessed while conditioning results on time since arrival, as the current data include only one measurement period. This precludes the analyses of the extent to which the homeownership rates and property characteristics of refugees eventually converge to those of the Canadian-born. Going forward, the further development of the CHSP data will support the evaluation of these issues.References
Gellatly, G. and R. Morissette. 2018. Immigrant ownership of residential properties in Toronto and Vancouver. Economic Insights no. 87. Ottawa: Statistics Canada.
Picot, G. Y. Zhang and F. Hou. 2019. Labour Market Outcomes Among Refugees to Canada. Analytical Branch Research Paper Series. Catalogue no. 11F0019M, no. 419. Ottawa: Statistics Canada.
- Date modified: