
Economic Insights
Recent Developments in the Canadian Economy: Spring 2019

Archived Content
Information identified as archived is provided for reference, research or recordkeeping purposes. It is not subject to the Government of Canada Web Standards and has not been altered or updated since it was archived. Please "contact us" to request a format other than those available.
by Guy Gellatly and Carter McCormack,
Analytical Studies Branch
This article in the Economic Insights series provides users with an integrated summary of recent changes in output, employment, household demand, international trade and prices. Organized as a statistical summary of major indicators, the report is designed to inform about recent developments in the Canadian economy, highlighting major changes in the economic data during the second half of 2018 and early 2019. Unless otherwise noted, the tabulations presented in this report are based on seasonally adjusted data available as of April 18, 2019.
Overview
Economic growth slowed in the second half of 2018 as business investment in machinery and equipment and non-residential structures declined. Investment in housing also contracted in the second half of the year. While households continued to support growth, the pace of household spending slowed as outlays on durables declined. Following slower growth in the third quarter, export volumes edged down in the fourth.
In contrast, employment strengthened in the second half of the year, led by increases among private sector employees and core-age workers. Increases in both full-time and part-time work contributed to higher employment as overall gains were concentrated in services. Over two-thirds of the net increase in employment during the last six months of 2018 reflected gains in British Columbia and Ontario.
Overall, the growth in real gross domestic product, measured on a year-over-year basis, slowed to 1.1% in December, matching the increase in employment. The output of goods industries at year end was down 1.2% from levels in December 2017 while services rose 1.9%. More recently, the pace of output and employment growth strengthened in early 2019 (Chart 1).

Data table for Chart 1
| Real gross domestic product | Employment | |
|---|---|---|
| 2010 | ||
| January | 0.8 | 0.0 |
| February | 1.9 | 0.4 |
| March | 3.2 | 0.6 |
| April | 3.4 | 1.3 |
| May | 4.0 | 1.6 |
| June | 4.1 | 2.1 |
| July | 4.1 | 2.0 |
| August | 4.5 | 2.1 |
| September | 3.7 | 1.7 |
| October | 4.1 | 1.8 |
| November | 4.0 | 1.5 |
| December | 4.4 | 1.8 |
| 2011 | ||
| January | 4.1 | 1.9 |
| February | 3.4 | 1.8 |
| March | 3.2 | 1.8 |
| April | 3.3 | 1.6 |
| May | 2.6 | 1.4 |
| June | 2.8 | 1.2 |
| July | 3.4 | 1.4 |
| August | 3.6 | 1.5 |
| September | 3.9 | 1.7 |
| October | 3.4 | 1.4 |
| November | 3.0 | 1.2 |
| December | 2.8 | 1.2 |
| 2012 | ||
| January | 2.4 | 0.7 |
| February | 2.3 | 0.7 |
| March | 2.2 | 1.1 |
| April | 2.6 | 1.5 |
| May | 3.0 | 1.4 |
| June | 2.6 | 1.3 |
| July | 2.1 | 1.0 |
| August | 1.4 | 1.2 |
| September | 1.1 | 1.3 |
| October | 1.1 | 1.5 |
| November | 1.4 | 1.7 |
| December | 0.9 | 1.8 |
| 2013 | ||
| January | 1.6 | 2.0 |
| February | 2.2 | 2.2 |
| March | 2.3 | 1.5 |
| April | 2.1 | 1.1 |
| May | 2.2 | 1.5 |
| June | 1.8 | 1.4 |
| July | 2.2 | 1.5 |
| August | 2.8 | 1.4 |
| September | 3.1 | 1.2 |
| October | 3.7 | 1.2 |
| November | 3.5 | 1.0 |
| December | 3.1 | 0.7 |
| 2014 | ||
| January | 2.5 | 0.7 |
| February | 2.7 | 0.6 |
| March | 2.7 | 0.9 |
| April | 2.7 | 0.7 |
| May | 3.0 | 0.4 |
| June | 3.9 | 0.5 |
| July | 3.5 | 0.7 |
| August | 2.8 | 0.4 |
| September | 2.8 | 0.5 |
| October | 2.6 | 0.8 |
| November | 2.4 | 0.7 |
| December | 3.0 | 0.6 |
| 2015 | ||
| January | 2.5 | 0.7 |
| February | 1.9 | 0.8 |
| March | 1.5 | 0.8 |
| April | 1.3 | 0.8 |
| May | 0.6 | 1.1 |
| June | 0.4 | 1.0 |
| July | 0.5 | 0.9 |
| August | 0.9 | 1.1 |
| September | 0.1 | 0.9 |
| October | 0.0 | 0.7 |
| November | 0.1 | 0.7 |
| December | 0.0 | 0.9 |
| 2016 | ||
| January | 1.0 | 0.7 |
| February | 1.0 | 0.6 |
| March | 0.8 | 0.7 |
| April | 0.9 | 0.8 |
| May | 0.4 | 0.6 |
| June | 0.6 | 0.6 |
| July | 0.9 | 0.4 |
| August | 1.0 | 0.5 |
| September | 1.6 | 0.9 |
| October | 1.5 | 1.0 |
| November | 1.6 | 1.0 |
| December | 1.9 | 1.1 |
| 2017 | ||
| January | 1.7 | 1.5 |
| February | 2.1 | 1.6 |
| March | 2.9 | 1.5 |
| April | 3.3 | 1.6 |
| May | 4.3 | 1.8 |
| June | 4.0 | 2.0 |
| July | 3.6 | 2.2 |
| August | 3.2 | 2.1 |
| September | 3.2 | 1.8 |
| October | 3.3 | 1.7 |
| November | 3.5 | 2.1 |
| December | 3.4 | 2.3 |
| 2018 | ||
| January | 2.7 | 1.5 |
| February | 2.7 | 1.5 |
| March | 2.6 | 1.6 |
| April | 2.1 | 1.5 |
| May | 2.0 | 1.2 |
| June | 1.9 | 1.2 |
| July | 2.0 | 1.3 |
| August | 2.2 | 0.9 |
| September | 1.9 | 1.3 |
| October | 2.0 | 1.2 |
| November | 1.4 | 1.3 |
| December | 1.1 | 1.1 |
| 2019 | ||
| January | 1.6 | 1.8 |
| February | Note ..: not available for a specific reference period | 2.0 |
| March | Note ..: not available for a specific reference period | 1.8 |
|
.. not available for a specific reference period Sources: Statistics Canada, tables 36-10-0434-01 and 14-10-0287-01. |
||
For 2018 as a whole, real GDP in Canada increased 1.8%, following 3.0% in 2017. Increased household spending accounted for about two-thirds of economic growth in 2018, while higher goods exports also supported gains (Chart 2). In the United States, real GDP rose by 2.9% in 2018.

Data table for Chart 2
| Selected components | 2017 | 2018 |
|---|---|---|
| percentage-point contributions | ||
| Imports—services | -0.157 | -0.080 |
| Imports—goods | -1.256 | -0.847 |
| Exports—services | 0.178 | 0.208 |
| Exports—goods | 0.181 | 0.800 |
| Investment in inventories | 0.821 | -0.204 |
| Business investment—machinery and equipment | 0.175 | 0.214 |
| Business investment—non-residential structures | 0.063 | -0.049 |
| Business investment—residential structures | 0.186 | -0.175 |
| Household final consumption expenditure | 2.041 | 1.178 |
| Gross domestic product at market prices | 2.979 | 1.834 |
|
Notes: Data on gross domestic product (GDP) are annual growth rates; all other data are percentage-point contributions to the annual growth rates in real GDP. For additional data on these contributions, see the table noted below. Source: Statistics Canada, table 36-10-0128-01. |
||
Household spending slowed as outlays on consumer durables fell
The pace of economic growth slowed in the second half of 2018, as business investment contracted and household spending slowed.Note 1 Real GDP rose 0.1% in the fourth quarter, the smallest quarterly increase since the most recent decline in GDP in the second quarter of 2016. Investment in housing continued to decline in the second half of the year, while exports weighed on growth in the fourth quarter. In the United States, real GDP growth slowed to 2.2% (annualized) in the fourth quarter, after 3.4% in the third.
Consumers contributed to growth throughout 2018 although the pace of spending slowed (Chart 3). Household final expenditures rose 0.2% in the fourth quarter and 0.3% in the third. Outlays on consumer durables decreased throughout the second half as households spent less on autos.Note 2 Outlays on services increased in the second half, supported by higher spending on life insurance and financial services late in the year.
For 2018, household final expenditures rose by 2.1%, down from 3.6% in 2017.

Data table for Chart 3
| Selected aggregates | Household expenditure | Government current expenditure | Non-residential business investment | Goods exports | Housing |
|---|---|---|---|---|---|
| index (first quarter of 2010 = 100) | |||||
| 2010 | |||||
| First quarter | 100.0 | 100.0 | 100.0 | 100.0 | 100.0 |
| Second quarter | 100.8 | 99.9 | 104.8 | 104.0 | 98.8 |
| Third quarter | 101.7 | 100.2 | 108.7 | 103.7 | 97.0 |
| Fourth quarter | 102.6 | 100.9 | 114.1 | 106.5 | 96.3 |
| 2011 | |||||
| First quarter | 102.8 | 101.0 | 117.3 | 106.9 | 98.2 |
| Second quarter | 103.2 | 101.4 | 120.2 | 104.5 | 98.1 |
| Third quarter | 103.7 | 101.8 | 120.6 | 111.1 | 100.6 |
| Fourth quarter | 104.3 | 102.1 | 124.2 | 112.4 | 101.6 |
| 2012 | |||||
| First quarter | 104.9 | 102.2 | 127.1 | 112.1 | 106.1 |
| Second quarter | 105.1 | 101.9 | 131.1 | 112.0 | 105.5 |
| Third quarter | 105.7 | 102.6 | 131.4 | 111.3 | 104.6 |
| Fourth quarter | 106.3 | 102.5 | 134.3 | 110.9 | 104.6 |
| 2013 | |||||
| First quarter | 106.9 | 101.4 | 136.7 | 113.1 | 103.7 |
| Second quarter | 107.9 | 101.0 | 138.1 | 115.2 | 105.3 |
| Third quarter | 108.7 | 101.5 | 139.0 | 113.7 | 104.6 |
| Fourth quarter | 109.4 | 102.1 | 141.0 | 115.7 | 104.5 |
| 2014 | |||||
| First quarter | 109.8 | 102.4 | 142.5 | 114.7 | 103.2 |
| Second quarter | 110.8 | 102.0 | 143.9 | 122.3 | 105.6 |
| Third quarter | 111.6 | 102.0 | 145.9 | 124.5 | 108.0 |
| Fourth quarter | 112.4 | 101.7 | 148.8 | 124.8 | 108.3 |
| 2015 | |||||
| First quarter | 112.6 | 103.1 | 136.2 | 123.1 | 109.1 |
| Second quarter | 113.2 | 103.2 | 130.6 | 125.1 | 109.2 |
| Third quarter | 114.0 | 103.8 | 125.7 | 128.1 | 111.3 |
| Fourth quarter | 114.8 | 103.5 | 122.6 | 126.7 | 111.8 |
| 2016 | |||||
| First quarter | 115.1 | 104.3 | 117.4 | 129.3 | 113.5 |
| Second quarter | 115.5 | 105.7 | 115.7 | 122.7 | 114.4 |
| Third quarter | 116.4 | 105.4 | 118.0 | 126.6 | 114.1 |
| Fourth quarter | 117.3 | 105.9 | 112.7 | 127.3 | 114.9 |
| 2017 | |||||
| First quarter | 118.5 | 106.5 | 116.2 | 127.6 | 117.2 |
| Second quarter | 119.9 | 107.2 | 118.0 | 129.5 | 115.9 |
| Third quarter | 120.9 | 107.7 | 119.5 | 125.1 | 115.6 |
| Fourth quarter | 121.7 | 108.8 | 121.8 | 127.0 | 119.1 |
| 2018 | |||||
| First quarter | 122.1 | 109.4 | 123.8 | 126.7 | 116.1 |
| Second quarter | 122.6 | 110.1 | 123.4 | 132.0 | 116.3 |
| Third quarter | 123.0 | 110.5 | 119.9 | 133.5 | 114.6 |
| Fourth quarter | 123.2 | 111.1 | 116.5 | 133.0 | 110.2 |
| Source: Statistics Canada, table 36-10-0104-01. | |||||
Export volumes slowed in the third quarter before declining 0.1% in the fourth on lower exports of forestry products, building materials, and metal products. Exports of passenger cars and light trucks also declined throughout the second half, while energy exports edged down in the fourth quarter on lower shipments of refined petroleum products.Note 3 Imports edged down 0.3% in the fourth quarter following a 2.2% decline in the third. Lower imports of basic and industrial chemicals and motor vehicles and parts contributed to declines throughout the second half. Energy imports were unchanged in the fourth quarter, following an 8.7% decline in the third.Note 4
The terms of trade declined in the fourth quarter on notable reductions in the price of crude oil exports.Note 5 Real gross domestic income, a measure of the purchasing power of domestic production, decreased 1.1% in fourth quarter. At the same time, nominal GDP fell 0.7%, the first quarterly decline in economy-wide income in three years.
For 2018, export volumes rose 3.3%, following a 1.1% increase in 2017. Import volumes rose 2.9% in 2018, after advancing 4.2% in 2017.
Lower business investment in non-residential structures and M&E
Non-residential business investment contracted during the second half of 2018 after trending higher during 2017 and early 2018 (Chart 4). Combined outlays on non-residential structures and machinery and equipment (M&E) were down 2.9% in the fourth quarter following a similar decline in the third. Business spending on these non-residential assets in the fourth quarter was down 4% from levels in late 2017, and 22% below levels observed in late 2014.

Data table for Chart 4
| Total business gross fixed capital formation | Residential structures | Non-residential structures | Machinery and equipment | Intellectual property products | |
|---|---|---|---|---|---|
| index (first quarter of 2014 = 100) | |||||
| 2014 | |||||
| First quarter | 100.0 | 100.0 | 100.0 | 100.0 | 100.0 |
| Second quarter | 101.2 | 102.3 | 100.8 | 101.4 | 98.5 |
| Third quarter | 102.7 | 104.7 | 102.0 | 103.3 | 97.9 |
| Fourth quarter | 104.2 | 105.0 | 103.9 | 105.5 | 100.9 |
| 2015 | |||||
| First quarter | 98.6 | 105.7 | 93.6 | 99.4 | 92.9 |
| Second quarter | 95.8 | 105.9 | 89.2 | 96.4 | 87.2 |
| Third quarter | 94.3 | 107.9 | 85.1 | 94.3 | 85.3 |
| Fourth quarter | 93.3 | 108.4 | 81.8 | 94.1 | 86.2 |
| 2016 | |||||
| First quarter | 91.6 | 110.0 | 78.1 | 90.6 | 84.6 |
| Second quarter | 91.2 | 110.9 | 75.3 | 92.4 | 84.5 |
| Third quarter | 91.7 | 110.6 | 80.0 | 88.3 | 81.4 |
| Fourth quarter | 89.8 | 111.4 | 74.6 | 87.6 | 80.6 |
| 2017 | |||||
| First quarter | 92.2 | 113.6 | 75.9 | 92.0 | 83.6 |
| Second quarter | 92.5 | 112.4 | 77.0 | 93.6 | 84.1 |
| Third quarter | 93.1 | 112.1 | 78.7 | 93.6 | 84.1 |
| Fourth quarter | 95.0 | 115.4 | 79.6 | 96.4 | 83.5 |
| 2018 | |||||
| First quarter | 95.2 | 112.5 | 79.2 | 101.4 | 86.8 |
| Second quarter | 95.0 | 112.7 | 78.6 | 101.8 | 86.8 |
| Third quarter | 93.0 | 111.1 | 76.9 | 97.8 | 85.2 |
| Fourth quarter | 90.7 | 106.8 | 73.9 | 96.6 | 90.4 |
| Source: Statistics Canada, table 36-10-0108-01. | |||||
Business investment in non-residential structures declined 4.0% in the fourth quarter, following a 2.1% decline in the third. Lower outlays on non-residential buildings and engineering structures contributed to declines late in the year. Investment in M&E fell 1.2% in the fourth quarter following a 3.9% decline in the third, as businesses spent less on industrial M&E. Business investment in intellectual property rose 6.1% in the fourth quarter, supported by higher spending on mineral exploration and evaluation. Outlays on research and development and software also increased in the fourth quarter. Overall business spending on intellectual property in the fourth quarter was 8% higher than in late 2017, but about 10% below levels reported in late 2014.
For 2018, non-residential business investment rose 1.7% following a 2.5% increase in 2017.
Going forward, private sector organizations anticipate spending 2.8% more on non-residential tangible assets in 2019, following a 0.7% increase in 2018 (Chart 5).Note 6 Private-sector outlays are expected to increase in Quebec, British Columbia and Ontario and decrease in Alberta. Oil and gas extraction industries anticipate spending $36.7 billion on capital assets in 2019, matching reported outlays in 2018. Oil and gas producers in Alberta expect to spend $25.9 billion, down 3% from outlays in 2018. Manufacturing industries expect to spend $19.1 billion in 2019, a 4.9% increase over 2018 levels. Higher intentions among chemical producers supported the gain, while manufacturers of transportation equipment and petroleum and coal products anticipate lower outlays. Manufacturing intentions rose in Quebec and Alberta and declined in Ontario and British Columbia.

Data table for Chart 5
| 2010 | 2011 | 2012 | 2013 | 2014 | 2015 | 2016 | 2017 | 2018 | 2019 | |
|---|---|---|---|---|---|---|---|---|---|---|
| index (2010=100) | ||||||||||
| Total | 100.0 | 107.7 | 114.2 | 117.3 | 124.7 | 115.2 | 105.4 | 110.0 | 112.7 | 115.5 |
| Private sector organizations | 100.0 | 113.1 | 121.8 | 127.9 | 138.6 | 120.8 | 107.3 | 108.8 | 109.6 | 112.6 |
| Public sector organizations | 100.0 | 97.4 | 99.6 | 97.2 | 98.0 | 104.4 | 101.7 | 112.1 | 118.7 | 121.1 |
|
Note: Data for 2018 are preliminary actual estimates; data for 2019 are intentions. Source: Statistics Canada, table 34-10-0037-01. |
||||||||||
Investment in housing contracted in the second half
Investment in residential structures contracted during the second half of 2018. Outlays on housing fell 3.9% in the fourth quarter, following a 1.4% decline in the third. Spending on new construction and renovations declined in both quarters. Ownership transfer costs, which reflect the volume of activity in resale markets, were down in the fourth quarter after advancing in the third. Spending on ownership transfer costs in the fourth quarter was down 13% from levels in late 2017, prior to the introduction of the new minimum qualifying rate for uninsured mortgages which took effect in January 2018.
For 2018, investment in housing fell 2.3% following a 2.4% increase in 2017.Note 7
Lower labour productivity in late 2018
Business sector labour productivity declined by 0.4% in the fourth quarter, following two consecutive quarterly increases. Declines in construction, agriculture and forestry and wholesale trade weighed on labour productivity late in the year. Industrial capacity utilization also fell in the fourth quarter, reflecting declines in manufacturing and construction. For 2018 as a whole, business sector labour productivity was unchanged, after increasing by 1.9% in 2017.
Declines in construction contributed to lower goods output
Goods output contracted during the second half of 2018. Broad-based declines in construction activity contributed to lower goods production in the third and fourth quarters, along with declines in support activities for mining and oil and gas extraction. Lower manufacturing output weighed on goods production in the fourth quarter, following gains in the third (Chart 6).

Data table for Chart 6
| Mining, quarrying, and oil and gas | Construction | Manufacturing | Professional, scientific and technical services | |
|---|---|---|---|---|
| index (January 2010=100) | ||||
| 2010 | ||||
| January | 100.0 | 100.0 | 100.0 | 100.0 |
| February | 103.1 | 100.5 | 101.3 | 100.0 |
| March | 104.5 | 100.9 | 102.9 | 100.4 |
| April | 104.0 | 101.3 | 102.8 | 100.5 |
| May | 109.2 | 101.1 | 103.3 | 100.3 |
| June | 108.5 | 101.6 | 104.6 | 100.4 |
| July | 108.3 | 101.8 | 104.6 | 101.2 |
| August | 107.9 | 102.4 | 104.5 | 101.0 |
| September | 106.2 | 102.7 | 103.8 | 101.3 |
| October | 110.0 | 103.1 | 103.7 | 101.9 |
| November | 111.4 | 103.4 | 103.1 | 102.5 |
| December | 114.0 | 103.6 | 104.8 | 103.2 |
| 2011 | ||||
| January | 111.4 | 104.6 | 105.8 | 103.8 |
| February | 110.9 | 105.0 | 104.9 | 104.3 |
| March | 113.4 | 104.4 | 105.7 | 104.6 |
| April | 114.2 | 104.2 | 105.7 | 104.7 |
| May | 110.0 | 104.0 | 105.1 | 105.0 |
| June | 111.9 | 105.1 | 105.5 | 105.9 |
| July | 115.3 | 105.8 | 107.1 | 105.9 |
| August | 119.3 | 106.5 | 106.9 | 106.4 |
| September | 119.5 | 107.0 | 108.1 | 107.0 |
| October | 117.5 | 107.1 | 108.3 | 107.6 |
| November | 116.6 | 107.6 | 108.9 | 108.0 |
| December | 116.9 | 108.7 | 110.7 | 108.5 |
| 2012 | ||||
| January | 116.7 | 109.6 | 110.2 | 108.3 |
| February | 113.6 | 110.8 | 108.3 | 108.4 |
| March | 113.4 | 112.1 | 108.8 | 108.2 |
| April | 114.6 | 113.9 | 109.6 | 108.4 |
| May | 114.5 | 113.9 | 109.3 | 108.6 |
| June | 112.4 | 114.1 | 109.3 | 108.6 |
| July | 110.5 | 114.5 | 109.3 | 109.5 |
| August | 108.4 | 115.0 | 108.7 | 109.5 |
| September | 109.6 | 115.6 | 107.5 | 109.6 |
| October | 110.5 | 116.7 | 106.6 | 109.3 |
| November | 112.4 | 117.1 | 107.5 | 109.1 |
| December | 113.7 | 117.5 | 106.2 | 109.5 |
| 2013 | ||||
| January | 114.8 | 117.5 | 107.3 | 109.8 |
| February | 117.7 | 118.1 | 107.6 | 109.7 |
| March | 118.2 | 118.8 | 108.1 | 110.1 |
| April | 117.5 | 119.6 | 107.3 | 110.7 |
| May | 116.4 | 120.1 | 107.4 | 111.4 |
| June | 115.3 | 117.2 | 107.3 | 111.5 |
| July | 117.3 | 119.7 | 107.1 | 111.6 |
| August | 119.3 | 120.1 | 107.7 | 112.2 |
| September | 120.2 | 119.7 | 109.1 | 113.3 |
| October | 121.6 | 120.1 | 110.4 | 113.5 |
| November | 121.7 | 120.3 | 110.0 | 114.1 |
| December | 121.0 | 119.0 | 107.7 | 114.6 |
| 2014 | ||||
| January | 121.9 | 120.1 | 108.2 | 114.1 |
| February | 124.4 | 120.8 | 109.8 | 114.7 |
| March | 127.0 | 120.3 | 109.0 | 115.5 |
| April | 129.9 | 120.0 | 109.4 | 116.2 |
| May | 130.1 | 121.6 | 111.2 | 116.7 |
| June | 131.6 | 122.2 | 112.2 | 118.3 |
| July | 128.5 | 123.2 | 113.1 | 119.5 |
| August | 125.4 | 122.8 | 111.7 | 119.8 |
| September | 128.9 | 123.2 | 112.5 | 119.2 |
| October | 130.1 | 124.7 | 112.6 | 119.0 |
| November | 130.2 | 124.9 | 111.7 | 119.5 |
| December | 128.6 | 124.3 | 113.9 | 118.9 |
| 2015 | ||||
| January | 129.3 | 122.9 | 112.5 | 118.7 |
| February | 126.7 | 121.4 | 111.2 | 118.2 |
| March | 121.8 | 120.0 | 112.3 | 117.8 |
| April | 120.1 | 119.5 | 112.1 | 117.5 |
| May | 120.5 | 120.4 | 111.9 | 117.3 |
| June | 124.6 | 119.6 | 110.8 | 116.9 |
| July | 128.0 | 119.2 | 111.4 | 116.8 |
| August | 129.5 | 119.3 | 113.1 | 116.9 |
| September | 122.7 | 118.5 | 112.0 | 116.4 |
| October | 124.0 | 118.2 | 111.7 | 116.6 |
| November | 123.8 | 117.7 | 111.7 | 116.8 |
| December | 123.1 | 117.2 | 112.4 | 116.9 |
| 2016 | ||||
| January | 123.6 | 116.9 | 113.7 | 117.1 |
| February | 121.7 | 116.5 | 112.6 | 116.9 |
| March | 118.2 | 115.2 | 112.4 | 117.2 |
| April | 115.9 | 115.0 | 112.4 | 117.1 |
| May | 108.4 | 113.8 | 110.3 | 117.3 |
| June | 113.4 | 112.9 | 112.3 | 117.3 |
| July | 119.3 | 113.1 | 112.5 | 117.5 |
| August | 120.3 | 112.2 | 113.0 | 117.4 |
| September | 123.0 | 113.1 | 113.5 | 117.9 |
| October | 124.0 | 113.2 | 112.0 | 118.1 |
| November | 127.1 | 113.8 | 113.4 | 118.1 |
| December | 128.1 | 114.6 | 114.5 | 118.2 |
| 2017 | ||||
| January | 129.3 | 115.7 | 115.3 | 118.5 |
| February | 128.3 | 116.6 | 114.9 | 119.1 |
| March | 127.3 | 116.8 | 115.7 | 119.6 |
| April | 130.0 | 118.1 | 116.1 | 120.2 |
| May | 133.5 | 117.1 | 117.2 | 120.7 |
| June | 131.8 | 119.2 | 118.5 | 120.4 |
| July | 132.4 | 119.6 | 117.8 | 120.7 |
| August | 132.5 | 119.9 | 116.4 | 121.0 |
| September | 132.7 | 121.3 | 116.8 | 121.2 |
| October | 129.0 | 122.1 | 116.6 | 121.2 |
| November | 131.1 | 122.4 | 118.7 | 121.9 |
| December | 131.9 | 122.3 | 119.4 | 122.7 |
| 2018 | ||||
| January | 131.0 | 121.9 | 118.7 | 122.3 |
| February | 134.4 | 122.8 | 119.4 | 122.8 |
| March | 138.2 | 122.4 | 119.6 | 123.1 |
| April | 139.7 | 122.2 | 119.1 | 123.6 |
| May | 140.8 | 122.4 | 118.0 | 123.8 |
| June | 138.1 | 122.0 | 119.6 | 124.3 |
| July | 138.4 | 120.4 | 120.7 | 124.7 |
| August | 138.9 | 118.9 | 120.1 | 125.0 |
| September | 137.0 | 117.7 | 119.9 | 125.4 |
| October | 136.4 | 116.7 | 120.6 | 125.8 |
| November | 135.9 | 115.7 | 120.0 | 126.4 |
| December | 135.1 | 114.7 | 119.1 | 127.2 |
| 2019 | ||||
| January | 130.8 | 116.9 | 120.9 | 127.6 |
| Source: Statistics Canada, table 36-10-0434-01. | ||||
Construction activity contracted for seven consecutive months from June to December. Construction output at year end was 6% lower than levels at mid-year, reflecting broad-based declines in residential and non-residential building construction and engineering construction.
Manufacturing declined during four of the last six months of 2018. Factory output at year end was little changed from mid-year levels (-0.4%). Declines among automotive and parts manufacturers weighed on factory output during the second half. Wood products, paper manufacturing and printing products also trended lower, while fabricated metal products and computer and electronic products strengthened.
Gains among service industries offset lower goods output during the second half of 2018. Finance and insurance and professional services contributed to growth in the third and fourth quarters, while retail trade edged down. Activities of real estate agents and brokers decreased in the fourth quarter, offsetting gains in the third. These activities declined during the last four months of 2018. At year end, the output of real estate agents and brokers was 23% below levels at the end of 2017.
Support activities for mining and oil and gas extraction trended lower
Oil and gas extraction moderated in the second half of 2018 as output levels fluctuated in response to maintenance and shutdown activities. Output in the oil sands declined in four of the last six months (Chart 7). Oil sands production in December was down slightly from levels at mid-year, but about 2% higher on a year-over-year basis. Excluding production in the oil sands, oil and gas extraction in December was 7% higher year-over-year.
Output fell sharply in the second half of 2018 among businesses that provide support activities for mining and oil and gas extraction. These activities, which include rigging and drilling services, declined in five of the last six months of the year, with a 17% decline in December. Output at year end was down 23% from levels at mid-year, and 11% below levels at the end of 2017, despite gains in the first half of 2018.

Data table for Chart 7
| Oil and gas extraction (except oil sands) | Oil sands extraction | Support activities for mining and oil and gas extraction | Crude oil and other pipeline transportation | Petroleum refineries | |
|---|---|---|---|---|---|
| index (January 2010=100) | |||||
| 2010 | |||||
| January | 100.0 | 100.0 | 100.0 | 100.0 | 100.0 |
| February | 98.6 | 111.7 | 108.4 | 99.3 | 93.7 |
| March | 100.0 | 115.9 | 99.2 | 106.9 | 93.7 |
| April | 100.2 | 118.8 | 96.4 | 104.7 | 90.6 |
| May | 102.1 | 127.3 | 108.3 | 107.3 | 93.6 |
| June | 102.1 | 128.0 | 104.4 | 107.2 | 97.4 |
| July | 103.0 | 123.3 | 104.4 | 109.6 | 94.3 |
| August | 105.8 | 119.9 | 98.3 | 109.8 | 92.9 |
| September | 104.4 | 115.9 | 89.8 | 97.8 | 96.0 |
| October | 103.6 | 122.2 | 102.9 | 100.8 | 83.2 |
| November | 103.7 | 130.8 | 103.1 | 107.1 | 88.3 |
| December | 105.7 | 134.9 | 108.4 | 106.9 | 91.2 |
| 2011 | |||||
| January | 105.7 | 128.7 | 99.1 | 119.3 | 87.3 |
| February | 103.2 | 130.5 | 98.9 | 125.2 | 86.8 |
| March | 104.8 | 129.0 | 116.1 | 121.0 | 87.8 |
| April | 105.3 | 133.2 | 113.3 | 116.1 | 89.1 |
| May | 103.9 | 119.2 | 114.4 | 115.4 | 78.1 |
| June | 102.1 | 128.0 | 114.7 | 117.8 | 82.6 |
| July | 104.9 | 132.7 | 116.7 | 123.1 | 83.3 |
| August | 107.1 | 135.4 | 137.1 | 129.6 | 86.0 |
| September | 107.5 | 136.6 | 137.1 | 129.7 | 94.2 |
| October | 106.6 | 133.1 | 136.9 | 129.7 | 90.3 |
| November | 105.1 | 133.3 | 136.1 | 127.1 | 88.5 |
| December | 105.2 | 134.5 | 132.2 | 129.2 | 87.6 |
| 2012 | |||||
| January | 104.7 | 139.4 | 131.2 | 135.8 | 86.6 |
| February | 102.8 | 136.8 | 130.5 | 133.9 | 89.3 |
| March | 102.3 | 128.0 | 137.3 | 134.3 | 86.2 |
| April | 102.0 | 136.9 | 130.3 | 138.9 | 91.0 |
| May | 98.9 | 145.7 | 121.0 | 142.7 | 87.6 |
| June | 95.5 | 139.9 | 122.7 | 142.2 | 86.5 |
| July | 93.3 | 141.3 | 118.5 | 140.4 | 90.5 |
| August | 91.4 | 140.7 | 115.9 | 138.7 | 88.9 |
| September | 91.6 | 141.2 | 120.6 | 135.2 | 87.0 |
| October | 96.3 | 139.9 | 116.0 | 126.6 | 93.5 |
| November | 99.7 | 134.6 | 116.8 | 134.3 | 92.7 |
| December | 97.7 | 144.0 | 121.2 | 140.6 | 92.1 |
| 2013 | |||||
| January | 98.4 | 140.2 | 131.0 | 141.7 | 93.3 |
| February | 99.3 | 142.4 | 138.0 | 143.7 | 89.1 |
| March | 100.1 | 147.1 | 131.6 | 146.1 | 90.9 |
| April | 99.6 | 146.2 | 127.8 | 143.7 | 89.0 |
| May | 101.6 | 138.6 | 123.3 | 141.1 | 80.0 |
| June | 102.4 | 142.5 | 114.6 | 142.6 | 94.0 |
| July | 103.5 | 143.8 | 120.0 | 139.5 | 88.3 |
| August | 103.9 | 153.8 | 123.1 | 145.6 | 90.8 |
| September | 103.9 | 151.3 | 126.8 | 145.8 | 94.2 |
| October | 102.6 | 153.6 | 131.0 | 150.3 | 89.0 |
| November | 103.1 | 159.1 | 122.7 | 148.4 | 94.0 |
| December | 104.5 | 159.4 | 112.4 | 140.8 | 88.9 |
| 2014 | |||||
| January | 105.2 | 157.3 | 120.9 | 141.5 | 89.6 |
| February | 107.1 | 157.5 | 126.0 | 145.6 | 95.4 |
| March | 106.6 | 166.5 | 131.8 | 144.9 | 84.3 |
| April | 106.0 | 172.6 | 140.1 | 143.9 | 87.8 |
| May | 107.0 | 173.8 | 141.0 | 152.5 | 91.4 |
| June | 108.4 | 175.9 | 136.1 | 156.5 | 102.7 |
| July | 107.4 | 173.2 | 127.6 | 152.2 | 97.7 |
| August | 103.5 | 171.7 | 121.7 | 151.5 | 93.8 |
| September | 105.7 | 177.4 | 130.0 | 151.5 | 87.7 |
| October | 106.6 | 183.4 | 127.5 | 151.6 | 90.9 |
| November | 107.4 | 180.9 | 134.0 | 153.2 | 96.5 |
| December | 105.6 | 179.5 | 132.1 | 154.2 | 97.3 |
| 2015 | |||||
| January | 106.0 | 192.0 | 108.0 | 149.6 | 94.5 |
| February | 105.0 | 197.8 | 95.2 | 154.5 | 92.4 |
| March | 102.3 | 196.2 | 77.2 | 151.0 | 95.6 |
| April | 101.1 | 191.2 | 78.3 | 162.7 | 96.6 |
| May | 99.0 | 186.3 | 89.6 | 156.9 | 96.8 |
| June | 98.6 | 197.3 | 99.9 | 160.7 | 88.9 |
| July | 98.2 | 218.8 | 95.2 | 168.8 | 89.5 |
| August | 98.9 | 221.9 | 100.9 | 177.4 | 94.4 |
| September | 99.1 | 191.2 | 93.8 | 170.6 | 91.6 |
| October | 97.6 | 203.3 | 95.7 | 164.5 | 92.0 |
| November | 99.1 | 206.3 | 92.4 | 170.4 | 88.4 |
| December | 99.7 | 207.3 | 84.1 | 175.8 | 92.1 |
| 2016 | |||||
| January | 98.9 | 208.7 | 86.5 | 179.4 | 93.6 |
| February | 100.2 | 204.7 | 77.3 | 182.0 | 92.5 |
| March | 100.7 | 206.4 | 63.5 | 174.1 | 94.6 |
| April | 101.6 | 199.2 | 58.8 | 166.2 | 95.8 |
| May | 103.0 | 146.0 | 60.4 | 159.0 | 83.1 |
| June | 102.9 | 168.6 | 62.1 | 162.8 | 92.6 |
| July | 102.9 | 209.9 | 63.7 | 168.0 | 98.5 |
| August | 105.4 | 210.0 | 64.2 | 179.6 | 94.1 |
| September | 106.3 | 219.3 | 67.2 | 179.2 | 91.0 |
| October | 102.5 | 220.9 | 73.3 | 175.9 | 83.9 |
| November | 102.4 | 229.3 | 76.2 | 181.9 | 92.2 |
| December | 99.9 | 215.9 | 90.0 | 179.6 | 91.5 |
| 2017 | |||||
| January | 102.0 | 218.9 | 89.8 | 178.2 | 91.5 |
| February | 100.5 | 224.5 | 91.3 | 179.7 | 92.7 |
| March | 104.4 | 214.9 | 92.0 | 179.3 | 95.1 |
| April | 105.2 | 209.5 | 100.1 | 179.7 | 95.9 |
| May | 108.3 | 225.7 | 95.6 | 186.8 | 98.0 |
| June | 109.4 | 220.8 | 91.4 | 185.6 | 100.1 |
| July | 108.5 | 224.0 | 89.9 | 193.2 | 97.6 |
| August | 105.2 | 230.8 | 86.3 | 189.9 | 93.5 |
| September | 108.5 | 227.7 | 85.0 | 192.5 | 100.7 |
| October | 110.1 | 209.3 | 80.8 | 189.4 | 101.4 |
| November | 109.1 | 225.8 | 84.5 | 175.3 | 96.0 |
| December | 107.9 | 238.3 | 83.8 | 181.7 | 97.5 |
| 2018 | |||||
| January | 108.4 | 224.2 | 87.6 | 185.0 | 98.5 |
| February | 110.5 | 231.0 | 91.7 | 185.4 | 98.8 |
| March | 112.5 | 240.0 | 99.4 | 191.0 | 95.7 |
| April | 114.2 | 237.8 | 110.6 | 192.1 | 74.2 |
| May | 114.6 | 252.2 | 105.1 | 194.2 | 73.6 |
| June | 115.5 | 245.7 | 97.1 | 195.5 | 91.8 |
| July | 116.4 | 236.1 | 96.8 | 194.3 | 99.0 |
| August | 117.1 | 243.0 | 93.0 | 195.8 | 97.0 |
| September | 114.2 | 234.3 | 90.9 | 193.4 | 99.4 |
| October | 115.3 | 246.5 | 87.1 | 192.7 | 100.0 |
| November | 111.6 | 244.0 | 89.6 | 193.7 | 96.9 |
| December | 115.1 | 242.9 | 74.4 | 193.2 | 93.7 |
| 2019 | |||||
| January | 113.7 | 233.0 | 71.5 | 191.0 | 98.2 |
| Source: Statistics Canada, table 36-10-0434-01. | |||||
More recently, real GDP rose 0.3% in January 2019 led by broad-based increases in manufacturing and construction. Gains in January were partly offset by lower oil and gas extraction and a continued decline in support activities for mining and oil and gas extraction.
Employment strengthened in late 2018
Total employment rose by 174,000 (+0.9%) in the last six months of 2018, led by increases among private-sector employees and core-age workers. Overall gains in the second half reflected increases in full-time and part-time work and were concentrated in services (Chart 8). Over two-thirds of the net gain in the second half reflected higher employment in British Columbia and Ontario.
The national unemployment rate edged down to a record low of 5.6% in late 2018. Ontario’s unemployment rate averaged 5.6% during the last six months of the year, compared to 5.4% in Quebec. The unemployment rates in British Columbia and Alberta averaged 4.5% and 6.7%, respectively, during this period.
For 2018, total employment rose by 196,000, about one-half of the increase observed in 2017.Note 8 All of the net increase was in full time-work and reflected gains among core-age workers. Higher employment among private-sector employees accounted for two-thirds of the net gain.Note 9

Data table for Chart 8
| Total | Full-time | Part-time | |
|---|---|---|---|
| year-over-year change (thousands of persons) | |||
| 2010 | |||
| January | 4.9 | -67.4 | 72.3 |
| February | 74.7 | 118.4 | -43.7 |
| March | 105.4 | 89.3 | 16.1 |
| April | 225.1 | 138.3 | 86.7 |
| May | 266.0 | 230.7 | 35.2 |
| June | 345.6 | 303.0 | 42.6 |
| July | 336.3 | 118.4 | 218.0 |
| August | 342.3 | 206.9 | 135.4 |
| September | 279.1 | 134.8 | 144.3 |
| October | 306.8 | 159.5 | 147.3 |
| November | 257.4 | 113.6 | 143.9 |
| December | 307.9 | 180.3 | 127.5 |
| 2011 | |||
| January | 315.4 | 209.7 | 105.6 |
| February | 294.9 | 96.4 | 198.5 |
| March | 305.4 | 260.8 | 44.5 |
| April | 265.0 | 236.1 | 28.9 |
| May | 232.9 | 193.8 | 39.2 |
| June | 210.2 | 186.6 | 23.6 |
| July | 238.8 | 382.9 | -144.1 |
| August | 250.9 | 353.2 | -102.2 |
| September | 294.5 | 360.4 | -65.8 |
| October | 239.3 | 232.8 | 6.5 |
| November | 202.6 | 269.2 | -66.7 |
| December | 200.8 | 231.2 | -30.2 |
| 2012 | |||
| January | 121.9 | 190.4 | -68.5 |
| February | 122.9 | 229.0 | -106.1 |
| March | 194.0 | 212.3 | -18.2 |
| April | 250.7 | 250.8 | -0.1 |
| May | 246.7 | 225.5 | 21.2 |
| June | 222.6 | 237.4 | -14.8 |
| July | 179.2 | 213.0 | -33.9 |
| August | 200.6 | 203.5 | -2.9 |
| September | 227.3 | 188.4 | 38.8 |
| October | 266.7 | 288.2 | -21.4 |
| November | 301.4 | 253.4 | 48.0 |
| December | 312.1 | 273.2 | 38.8 |
| 2013 | |||
| January | 351.4 | 289.5 | 62.1 |
| February | 377.6 | 327.2 | 50.4 |
| March | 253.0 | 195.4 | 57.6 |
| April | 192.9 | 183.2 | 9.7 |
| May | 253.6 | 275.1 | -21.6 |
| June | 236.1 | 199.9 | 36.3 |
| July | 255.5 | 159.2 | 96.4 |
| August | 247.4 | 153.5 | 93.8 |
| September | 216.8 | 167.6 | 49.2 |
| October | 206.6 | 172.5 | 34.1 |
| November | 183.5 | 136.4 | 47.2 |
| December | 130.9 | 52.4 | 78.5 |
| 2014 | |||
| January | 129.4 | 64.7 | 64.7 |
| February | 114.0 | 72.0 | 42.0 |
| March | 160.7 | 105.6 | 55.2 |
| April | 119.4 | 52.2 | 67.2 |
| May | 66.8 | -70.5 | 137.4 |
| June | 86.2 | 27.5 | 58.6 |
| July | 123.1 | 22.3 | 100.8 |
| August | 67.3 | -6.2 | 73.4 |
| September | 92.4 | 24.1 | 68.3 |
| October | 138.5 | 28.1 | 110.4 |
| November | 115.5 | 67.1 | 48.3 |
| December | 108.2 | 145.5 | -37.4 |
| 2015 | |||
| January | 128.3 | 116.6 | 11.7 |
| February | 136.8 | 128.7 | 8.1 |
| March | 133.8 | 126.5 | 7.2 |
| April | 136.0 | 171.9 | -35.9 |
| May | 192.2 | 234.8 | -42.6 |
| June | 174.2 | 235.2 | -61.0 |
| July | 168.8 | 273.9 | -105.1 |
| August | 199.0 | 323.8 | -124.7 |
| September | 166.3 | 196.5 | -30.2 |
| October | 130.8 | 174.3 | -43.5 |
| November | 127.2 | 202.0 | -74.8 |
| December | 152.0 | 148.9 | 3.2 |
| 2016 | |||
| January | 119.6 | 164.2 | -44.7 |
| February | 108.9 | 59.7 | 49.2 |
| March | 121.5 | 102.0 | 19.5 |
| April | 146.9 | 80.6 | 66.3 |
| May | 110.5 | 105.6 | 5.0 |
| June | 108.2 | 24.5 | 83.7 |
| July | 68.2 | -35.6 | 103.8 |
| August | 98.5 | -17.8 | 116.3 |
| September | 160.3 | 73.6 | 86.7 |
| October | 174.3 | 33.3 | 141.0 |
| November | 178.2 | -31.1 | 209.3 |
| December | 198.3 | 63.6 | 134.7 |
| 2017 | |||
| January | 276.2 | 77.1 | 199.1 |
| February | 290.0 | 253.6 | 36.4 |
| March | 275.0 | 221.9 | 53.2 |
| April | 282.9 | 192.6 | 90.3 |
| May | 328.1 | 232.5 | 95.5 |
| June | 360.9 | 263.2 | 97.7 |
| July | 391.9 | 360.4 | 31.5 |
| August | 384.0 | 225.1 | 158.8 |
| September | 325.0 | 294.2 | 30.7 |
| October | 318.1 | 405.4 | -87.3 |
| November | 384.9 | 440.1 | -55.2 |
| December | 417.4 | 386.8 | 30.6 |
| 2018 | |||
| January | 276.2 | 429.3 | -153.1 |
| February | 270.1 | 276.2 | -6.1 |
| March | 289.7 | 338.3 | -48.7 |
| April | 274.3 | 379.8 | -105.5 |
| May | 223.4 | 283.0 | -59.6 |
| June | 215.4 | 280.0 | -64.6 |
| July | 241.0 | 200.4 | 40.6 |
| August | 167.3 | 323.0 | -155.6 |
| September | 236.9 | 215.6 | 21.5 |
| October | 221.4 | 170.1 | 51.4 |
| November | 249.6 | 231.9 | 17.7 |
| December | 195.8 | 194.5 | 1.3 |
| 2019 | |||
| January | 327.2 | 165.6 | 161.7 |
| February | 369.1 | 266.0 | 103.1 |
| March | 331.6 | 203.7 | 127.8 |
| Source: Statistics Canada, table 14-10-0287-01. | |||
The national employment rate—the number of employed persons expressed as a percentage of the working-age population—edged higher in late 2018, supported by higher employment among core-aged persons (those aged 25-54). The employment rate among 25 to 54 year-olds trended higher, rising to 83.3% at year end, while their unemployment rate fell below 5% from October to December (Chart 9). The employment rate among core-aged individuals in Quebec averaged 84.8% during the last six months of the year, compared to 81.8% in Ontario. In British Columbia, 84.0% of core-age persons were employed during this period, compared to 83.7% in Alberta.
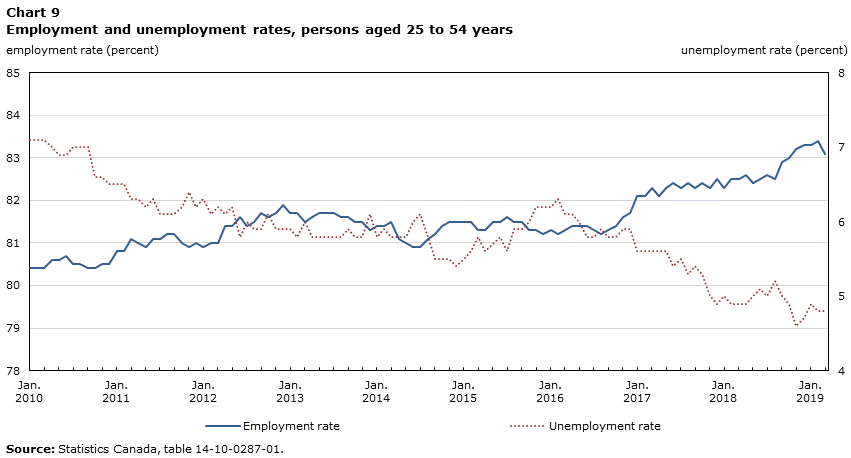
Data table for Chart 9
| Employment rate | Unemployment rate | |
|---|---|---|
| percent | ||
| 2010 | ||
| January | 80.4 | 7.1 |
| February | 80.4 | 7.1 |
| March | 80.4 | 7.1 |
| April | 80.6 | 7.0 |
| May | 80.6 | 6.9 |
| June | 80.7 | 6.9 |
| July | 80.5 | 7.0 |
| August | 80.5 | 7.0 |
| September | 80.4 | 7.0 |
| October | 80.4 | 6.6 |
| November | 80.5 | 6.6 |
| December | 80.5 | 6.5 |
| 2011 | ||
| January | 80.8 | 6.5 |
| February | 80.8 | 6.5 |
| March | 81.1 | 6.3 |
| April | 81.0 | 6.3 |
| May | 80.9 | 6.2 |
| June | 81.1 | 6.3 |
| July | 81.1 | 6.1 |
| August | 81.2 | 6.1 |
| September | 81.2 | 6.1 |
| October | 81.0 | 6.2 |
| November | 80.9 | 6.4 |
| December | 81.0 | 6.2 |
| 2012 | ||
| January | 80.9 | 6.3 |
| February | 81.0 | 6.1 |
| March | 81.0 | 6.2 |
| April | 81.4 | 6.1 |
| May | 81.4 | 6.2 |
| June | 81.6 | 5.8 |
| July | 81.4 | 6.0 |
| August | 81.5 | 5.9 |
| September | 81.7 | 5.9 |
| October | 81.6 | 6.1 |
| November | 81.7 | 5.9 |
| December | 81.9 | 5.9 |
| 2013 | ||
| January | 81.7 | 5.9 |
| February | 81.7 | 5.8 |
| March | 81.5 | 6.0 |
| April | 81.6 | 5.8 |
| May | 81.7 | 5.8 |
| June | 81.7 | 5.8 |
| July | 81.7 | 5.8 |
| August | 81.6 | 5.8 |
| September | 81.6 | 5.9 |
| October | 81.5 | 5.8 |
| November | 81.5 | 5.8 |
| December | 81.3 | 6.1 |
| 2014 | ||
| January | 81.4 | 5.8 |
| February | 81.4 | 5.9 |
| March | 81.5 | 5.8 |
| April | 81.1 | 5.8 |
| May | 81.0 | 5.8 |
| June | 80.9 | 6.0 |
| July | 80.9 | 6.1 |
| August | 81.1 | 5.8 |
| September | 81.2 | 5.5 |
| October | 81.4 | 5.5 |
| November | 81.5 | 5.5 |
| December | 81.5 | 5.4 |
| 2015 | ||
| January | 81.5 | 5.5 |
| February | 81.5 | 5.6 |
| March | 81.3 | 5.8 |
| April | 81.3 | 5.6 |
| May | 81.5 | 5.7 |
| June | 81.5 | 5.8 |
| July | 81.6 | 5.6 |
| August | 81.5 | 5.9 |
| September | 81.5 | 5.9 |
| October | 81.3 | 6.0 |
| November | 81.3 | 6.2 |
| December | 81.2 | 6.2 |
| 2016 | ||
| January | 81.3 | 6.2 |
| February | 81.2 | 6.3 |
| March | 81.3 | 6.1 |
| April | 81.4 | 6.1 |
| May | 81.4 | 6.0 |
| June | 81.4 | 5.8 |
| July | 81.3 | 5.8 |
| August | 81.2 | 5.9 |
| September | 81.3 | 5.8 |
| October | 81.4 | 5.8 |
| November | 81.6 | 5.9 |
| December | 81.7 | 5.9 |
| 2017 | ||
| January | 82.1 | 5.6 |
| February | 82.1 | 5.6 |
| March | 82.3 | 5.6 |
| April | 82.1 | 5.6 |
| May | 82.3 | 5.6 |
| June | 82.4 | 5.4 |
| July | 82.3 | 5.5 |
| August | 82.4 | 5.3 |
| September | 82.3 | 5.4 |
| October | 82.4 | 5.3 |
| November | 82.3 | 5.0 |
| December | 82.5 | 4.9 |
| 2018 | ||
| January | 82.3 | 5.0 |
| February | 82.5 | 4.9 |
| March | 82.5 | 4.9 |
| April | 82.6 | 4.9 |
| May | 82.4 | 5.0 |
| June | 82.5 | 5.1 |
| July | 82.6 | 5.0 |
| August | 82.5 | 5.2 |
| September | 82.9 | 5.0 |
| October | 83.0 | 4.9 |
| November | 83.2 | 4.6 |
| December | 83.3 | 4.7 |
| 2019 | ||
| January | 83.3 | 4.9 |
| February | 83.4 | 4.8 |
| March | 83.1 | 4.8 |
| Source: Statistics Canada, table 14-10-0287-01. | ||
Employment rose during the first quarter of 2019, led by gains in full-time work and among private sector employees. Employment among core-aged workers was little changed during the quarter, as the majority of gains reflected higher employment among youth. Higher employment in Ontario accounted for about 60% of the net increase in employment in the first quarter. The unemployment rate held steady at 5.8% from January to March.
The average annual increase in payroll earnings during the last six months of 2018 was 2.3%, down from 2.9% during the first half. After reaching the 3% mark from June to August, earnings growth fluctuated in subsequent months, edging below 2% in September and again at year end (+1.7%). Earnings growth in the goods sector moderated, as payroll earnings in construction slowed towards year end.Note 10
Merchandise trade deficits widened in late 2018
Following modest deficits from August to October, Canada’s merchandise trade deficit widened in late 2018, rising to a record $4.8 billion at year end. Lower energy exports on sharp reductions in crude oil prices contributed to larger trade deficits late in the year (Chart 10).

Data table for Chart 10
| Total | Energy | Non-energy | |
|---|---|---|---|
| billions of dollars | |||
| 2010 | |||
| January | 0.3940 | 4.5516 | -4.1576 |
| February | 0.0612 | 4.4315 | -4.3703 |
| March | -1.2558 | 3.7750 | -5.0308 |
| April | 0.1096 | 3.8102 | -3.7006 |
| May | -0.8602 | 3.9468 | -4.8070 |
| June | -1.3962 | 3.9190 | -5.3152 |
| July | -2.0710 | 3.6363 | -5.7073 |
| August | -1.7715 | 3.0390 | -4.8105 |
| September | -2.3338 | 3.4017 | -5.7355 |
| October | -1.1825 | 3.7628 | -4.9453 |
| November | -0.5128 | 3.9555 | -4.4683 |
| December | 1.1157 | 5.1043 | -3.9886 |
| 2011 | |||
| January | 0.7441 | 5.0282 | -4.2841 |
| February | -0.0485 | 4.6027 | -4.6512 |
| March | -0.9995 | 4.0568 | -5.0563 |
| April | -0.2397 | 4.5920 | -4.8317 |
| May | -1.0860 | 4.3762 | -5.4622 |
| June | -1.1145 | 4.4570 | -5.5715 |
| July | 0.1488 | 4.9600 | -4.8112 |
| August | 0.2088 | 4.7108 | -4.5020 |
| September | 1.0978 | 5.1549 | -4.0571 |
| October | -0.8401 | 4.7935 | -5.6336 |
| November | 0.5753 | 5.3149 | -4.7396 |
| December | 2.1211 | 6.3176 | -4.1965 |
| 2012 | |||
| January | -0.0347 | 6.1539 | -6.1886 |
| February | -0.0010 | 5.2140 | -5.2150 |
| March | -1.1621 | 5.1718 | -6.3339 |
| April | -0.7409 | 4.9959 | -5.7368 |
| May | -1.3866 | 4.0737 | -5.4603 |
| June | -2.3378 | 4.5044 | -6.8422 |
| July | -3.0420 | 3.8128 | -6.8548 |
| August | -1.0763 | 4.3878 | -5.4641 |
| September | -1.0511 | 4.7454 | -5.7965 |
| October | -0.3793 | 4.7582 | -5.1375 |
| November | -1.6733 | 4.6945 | -6.3678 |
| December | -0.4040 | 4.8585 | -5.2625 |
| 2013 | |||
| January | -0.8826 | 4.6380 | -5.5206 |
| February | -0.6904 | 5.1546 | -5.8450 |
| March | -0.1831 | 5.4548 | -5.6379 |
| April | -0.1531 | 5.3767 | -5.5298 |
| May | -0.8204 | 5.5301 | -6.3505 |
| June | -0.4440 | 5.3081 | -5.7521 |
| July | -1.6565 | 6.0635 | -7.7200 |
| August | -0.7976 | 6.5426 | -7.3402 |
| September | -0.0351 | 6.8405 | -6.8756 |
| October | -0.3717 | 6.4780 | -6.8497 |
| November | -1.2676 | 5.8469 | -7.1145 |
| December | -0.8433 | 6.2695 | -7.1128 |
| 2014 | |||
| January | -0.8764 | 7.0811 | -7.9575 |
| February | 0.5745 | 8.1240 | -7.5495 |
| March | 1.5233 | 8.6208 | -7.0975 |
| April | 0.3225 | 6.9584 | -6.6359 |
| May | 0.5675 | 7.5547 | -6.9872 |
| June | 1.6283 | 7.4378 | -5.8095 |
| July | 1.6949 | 7.0638 | -5.3689 |
| August | 0.9228 | 7.2639 | -6.3411 |
| September | 0.5855 | 6.8634 | -6.2779 |
| October | -0.1913 | 6.7952 | -6.9865 |
| November | -0.7962 | 6.1013 | -6.8975 |
| December | -1.2825 | 5.1985 | -6.4810 |
| 2015 | |||
| January | -2.4234 | 4.6408 | -7.0642 |
| February | -1.7219 | 5.1430 | -6.8649 |
| March | -3.4135 | 4.4895 | -7.9030 |
| April | -2.3809 | 4.4647 | -6.8456 |
| May | -2.6508 | 4.7351 | -7.3859 |
| June | -0.4176 | 4.9514 | -5.3690 |
| July | -0.4595 | 4.7942 | -5.2537 |
| August | -1.6078 | 4.2877 | -5.8955 |
| September | -2.0076 | 4.1832 | -6.1908 |
| October | -2.4134 | 4.1005 | -6.5139 |
| November | -3.1499 | 3.6657 | -6.8156 |
| December | -1.9895 | 3.4819 | -5.4714 |
| 2016 | |||
| January | -1.3591 | 3.4036 | -4.7627 |
| February | -3.1932 | 2.7842 | -5.9774 |
| March | -3.2488 | 2.7967 | -6.0455 |
| April | -3.1030 | 3.2194 | -6.3224 |
| May | -3.6522 | 3.1468 | -6.7990 |
| June | -3.8449 | 3.1083 | -6.9532 |
| July | -1.4968 | 3.5260 | -5.0228 |
| August | -1.5631 | 3.9994 | -5.5625 |
| September | -3.9846 | 4.2137 | -8.1983 |
| October | -1.3140 | 4.3895 | -5.7035 |
| November | 0.9768 | 5.1943 | -4.2175 |
| December | 0.2589 | 6.1102 | -5.8513 |
| 2017 | |||
| January | -0.1487 | 5.4312 | -5.5799 |
| February | -1.4328 | 5.3192 | -6.7520 |
| March | -1.0704 | 5.9121 | -6.9825 |
| April | -0.8936 | 5.5780 | -6.4716 |
| May | -1.3712 | 5.7266 | -7.0978 |
| June | -3.4594 | 4.7928 | -8.2522 |
| July | -2.7101 | 4.7278 | -7.4379 |
| August | -2.8614 | 5.1667 | -8.0281 |
| September | -3.2947 | 4.7613 | -8.0560 |
| October | -1.3786 | 5.1769 | -6.5555 |
| November | -2.9417 | 5.3464 | -8.2881 |
| December | -3.0816 | 5.4655 | -8.5471 |
| 2018 | |||
| January | -1.8461 | 6.3015 | -8.1476 |
| February | -2.3720 | 5.6075 | -7.9795 |
| March | -3.7124 | 6.1342 | -9.8466 |
| April | -1.5801 | 6.4000 | -7.9801 |
| May | -2.8578 | 5.8849 | -8.7427 |
| June | -0.7702 | 6.9110 | -7.6812 |
| July | 0.0162 | 7.1579 | -7.1417 |
| August | -0.3843 | 6.8770 | -7.2613 |
| September | -0.7692 | 6.9446 | -7.7138 |
| October | -0.6186 | 6.2272 | -6.8458 |
| November | -2.1995 | 5.3106 | -7.5101 |
| December | -4.8043 | 3.1084 | -7.9127 |
| 2019 | |||
| January | -3.0862 | 5.5084 | -8.5946 |
| February | -2.8948 | 6.3881 | -9.2829 |
| Source: Statistics Canada, table 12-10-0121-01. | |||
Despite larger monthly deficits late in the year, the cumulative merchandise trade deficit in the second half of 2018, at $8.8 billion, was smaller than in the first half of the year ($13.1 billion). A smaller deficit on non-energy products contributed to the decrease. For 2018, Canada’s merchandise trade deficit narrowed to $21.9 billion, down from $24.6 billion in 2017.
Total merchandise exports in the second half of 2018 were 2.3% higher than in the first six months of the year, reflecting higher shipments of non-energy products. Increases in metal ores and non-metallic minerals and consumer products contributed to higher exports, while lower exports of crude and crude bitumen offset gains (Chart 11). While the cumulative value of exports rose in the second half of 2018, monthly export flows trended lower, posting five consecutive declines from August to December. Lower energy exports contributed substantially to these declines, particularly during the last three months of the year. Energy exports in December were $6.3 billion, down from $10.0 billion in June, as exports of crude oil and crude bitumen at year end were down over 50% from levels at mid-year.
More recently, merchandise exports rose 5.3% in January 2019, bolstered by higher crude oil prices. Despite continued support from higher crude prices in February, exports fell 1.3% on widespread declines in non-energy products.

Data table for Chart 11
| Total | Energy | Non-energy | |
|---|---|---|---|
| 2010 | |||
| January | 100.0 | 100.0 | 100.0 |
| February | 102.3 | 98.1 | 103.6 |
| March | 101.1 | 94.5 | 103.2 |
| April | 101.7 | 91.8 | 104.7 |
| May | 104.3 | 93.6 | 107.7 |
| June | 103.2 | 88.4 | 107.8 |
| July | 102.2 | 89.9 | 105.9 |
| August | 104.9 | 88.7 | 109.9 |
| September | 102.9 | 87.0 | 107.8 |
| October | 105.8 | 88.3 | 111.1 |
| November | 107.4 | 94.0 | 111.5 |
| December | 113.0 | 110.8 | 113.7 |
| 2011 | |||
| January | 116.0 | 114.6 | 116.5 |
| February | 110.2 | 107.2 | 111.2 |
| March | 112.3 | 111.2 | 112.7 |
| April | 113.8 | 116.1 | 113.1 |
| May | 113.3 | 114.8 | 112.8 |
| June | 112.2 | 110.4 | 112.8 |
| July | 116.4 | 111.5 | 118.0 |
| August | 119.7 | 111.6 | 122.2 |
| September | 123.3 | 120.7 | 124.1 |
| October | 120.8 | 119.4 | 121.3 |
| November | 124.1 | 127.4 | 123.1 |
| December | 129.2 | 132.2 | 128.3 |
| 2012 | |||
| January | 122.6 | 133.1 | 119.4 |
| February | 122.5 | 127.0 | 121.0 |
| March | 118.5 | 117.8 | 118.7 |
| April | 119.3 | 116.1 | 120.3 |
| May | 119.1 | 109.6 | 122.0 |
| June | 118.1 | 108.6 | 121.0 |
| July | 116.0 | 104.0 | 119.7 |
| August | 117.4 | 110.4 | 119.6 |
| September | 117.0 | 111.7 | 118.6 |
| October | 118.4 | 116.0 | 119.1 |
| November | 118.9 | 117.1 | 119.5 |
| December | 119.0 | 116.1 | 119.8 |
| 2013 | |||
| January | 119.3 | 118.5 | 119.6 |
| February | 122.1 | 121.9 | 122.1 |
| March | 123.8 | 124.7 | 123.5 |
| April | 125.4 | 123.4 | 126.0 |
| May | 122.5 | 122.0 | 122.7 |
| June | 122.2 | 121.2 | 122.5 |
| July | 119.5 | 124.3 | 118.0 |
| August | 125.7 | 138.0 | 122.0 |
| September | 126.9 | 141.2 | 122.5 |
| October | 124.6 | 132.9 | 122.1 |
| November | 124.1 | 121.8 | 124.9 |
| December | 125.3 | 133.4 | 122.8 |
| 2014 | |||
| January | 125.0 | 141.9 | 119.8 |
| February | 133.5 | 160.5 | 125.2 |
| March | 137.4 | 167.4 | 128.1 |
| April | 135.1 | 142.4 | 132.8 |
| May | 139.9 | 149.8 | 136.8 |
| June | 139.5 | 148.8 | 136.7 |
| July | 140.1 | 146.5 | 138.1 |
| August | 138.4 | 142.5 | 137.1 |
| September | 139.0 | 139.2 | 138.9 |
| October | 139.1 | 131.3 | 141.6 |
| November | 134.9 | 126.4 | 137.5 |
| December | 134.6 | 111.3 | 141.8 |
| 2015 | |||
| January | 130.7 | 95.8 | 141.4 |
| February | 132.4 | 104.2 | 141.1 |
| March | 133.4 | 97.1 | 144.6 |
| April | 132.6 | 99.2 | 142.9 |
| May | 131.4 | 99.9 | 141.1 |
| June | 138.6 | 103.0 | 149.6 |
| July | 140.9 | 98.2 | 154.0 |
| August | 138.4 | 92.1 | 152.6 |
| September | 137.1 | 88.0 | 152.2 |
| October | 134.0 | 85.1 | 149.1 |
| November | 133.1 | 80.0 | 149.5 |
| December | 137.6 | 75.7 | 156.6 |
| 2016 | |||
| January | 140.6 | 73.6 | 161.3 |
| February | 133.9 | 61.7 | 156.2 |
| March | 128.2 | 66.2 | 147.3 |
| April | 128.3 | 68.5 | 146.8 |
| May | 126.3 | 72.3 | 143.0 |
| June | 126.8 | 75.5 | 142.6 |
| July | 133.2 | 79.7 | 149.7 |
| August | 136.6 | 86.4 | 152.1 |
| September | 136.1 | 86.4 | 151.5 |
| October | 137.2 | 92.2 | 151.1 |
| November | 142.8 | 100.4 | 155.8 |
| December | 142.0 | 109.9 | 151.9 |
| 2017 | |||
| January | 144.1 | 109.5 | 154.8 |
| February | 141.0 | 110.7 | 150.3 |
| March | 144.5 | 112.6 | 154.3 |
| April | 145.9 | 110.0 | 157.0 |
| May | 149.9 | 111.9 | 161.7 |
| June | 141.6 | 98.5 | 154.9 |
| July | 135.2 | 94.4 | 147.8 |
| August | 135.8 | 97.0 | 147.7 |
| September | 134.9 | 100.4 | 145.5 |
| October | 138.2 | 104.2 | 148.6 |
| November | 143.1 | 106.6 | 154.3 |
| December | 144.5 | 114.3 | 153.8 |
| 2018 | |||
| January | 141.9 | 121.0 | 148.3 |
| February | 143.6 | 115.8 | 152.2 |
| March | 149.0 | 122.6 | 157.1 |
| April | 151.5 | 127.0 | 159.0 |
| May | 151.2 | 124.0 | 159.6 |
| June | 157.1 | 131.1 | 165.2 |
| July | 158.5 | 136.6 | 165.3 |
| August | 156.8 | 134.9 | 163.6 |
| September | 154.8 | 132.1 | 161.8 |
| October | 154.5 | 123.2 | 164.2 |
| November | 147.9 | 105.9 | 160.9 |
| December | 142.7 | 83.0 | 161.1 |
| 2019 | |||
| January | 150.3 | 109.3 | 162.9 |
| February | 148.3 | 122.1 | 156.4 |
| Source: Statistics Canada, table 12-10-0121-01. | |||
Petroleum, chemicals and fabricated metals bolstered manufacturing sales
Total manufacturing sales in the second half of 2018 were 1.9% higher than in the first six months of the year, supported by increases in petroleum and coal products, chemical products and fabricated metals. Total sales at auto and parts manufacturers were similar in the first and second halves of the year.
Measured on a monthly basis, manufacturing sales trended lower during the second half of 2018 on declines late in the year. Lower sales of petroleum and coal products contributed to decreases in November and December as both prices and refinery volumes declined.
For 2018, manufacturing sales rose 5.4% supported by higher sales of petroleum and coal products, primary and fabricated metals and machinery products. Higher sales of paper products, food products and chemical products also contributed to the gain. Annual sales at auto and parts manufacturers declined in 2018, reflecting lower sales at assembly plants. More recently, manufacturing sales rose 0.8% in January 2019 on higher sales of food products, machinery and electrical equipment. Sales edged down 0.2% in February.
Slower retail sales on lower gas prices
Total retail sales were 1.4% higher in the second half of 2018 than during the first six months of the year, supported by higher sales at food and beverage stores and motor vehicle and parts dealers. Sales at general merchandise stores also contributed to the increase in retail spending, while lower receipts at gasoline stations moderated gains. Higher sales in Ontario accounted for three-quarters of the net increase in retail spending.
Measured on a monthly basis, retail spending levelled off during the second half of 2018 as price-led declines at gasoline stations weighed on spending late in the year. Sales at auto and parts dealers bolstered sales in August, October and December, while receipts at building materials and garden equipment suppliers declined from July to November before strengthening at year end.
For 2018, retail sales rose 2.9% as auto sales moderated. Higher spending in Ontario accounted for over one-half of the annual gain. More recently, retail sales declined 0.4% in January 2019 on lower receipts at gasoline stations. Retail sales rebounded in February (+0.8%) led by higher sales at auto dealers.
Home prices continued to soften as prices declined in Vancouver
Home prices, measured year-over-year, continued to moderate in the second half of 2018 as prices declined in Vancouver (Chart 12). Based on estimates from the Aggregate Composite MLS Home Price Index, overall home prices were 1.6% higher at year end than at the end of 2017. Price growth continued to moderate in early 2019, slowing to 0.8% in January before declining on a year-over-year basis in February and March.Note 11
Home prices in Greater Vancouver softened during the second half of 2018 as prices declined month-over-month from July to December. Measured on a year-over-year basis, price growth in Greater Vancouver slowed from 9.5% in June to 1.0% in October prior to outright declines in November and December. Home prices in Greater Vancouver continued to decline on a year-over-year basis in early 2019, and were down 7.7% in March.
After declines from March to July, home prices in Greater Toronto edged higher on a year-over-year basis during the second half of 2018, rising to 3.0% at year end. Annual price increases in Greater Toronto moderated slightly in early 2019, before edging up to 2.6% in March. Meanwhile, annual home price inflation in Montreal has been around 6% during the second half of 2018, and continued at this pace into early 2019.

Data table for Chart 12
| Aggregate | Greater Vancouver | Calgary | Greater Toronto | Greater Montreal | |
|---|---|---|---|---|---|
| index (January 2010=100) | |||||
| 2010 | |||||
| January | 100.0 | 100.0 | 100.0 | 100.0 | 100.0 |
| February | 101.3 | 101.1 | 101.4 | 101.4 | 101.6 |
| March | 102.5 | 102.4 | 103.0 | 102.6 | 102.8 |
| April | 103.1 | 103.2 | 103.7 | 103.3 | 103.7 |
| May | 103.3 | 103.0 | 104.4 | 103.3 | 104.3 |
| June | 103.0 | 102.6 | 104.4 | 102.8 | 104.8 |
| July | 102.5 | 101.5 | 103.7 | 102.1 | 105.1 |
| August | 102.0 | 100.9 | 102.3 | 101.8 | 105.4 |
| September | 101.8 | 100.6 | 101.3 | 101.9 | 105.5 |
| October | 101.6 | 100.4 | 100.3 | 102.0 | 105.7 |
| November | 101.5 | 100.6 | 99.4 | 102.4 | 106.0 |
| December | 101.4 | 100.5 | 98.8 | 102.9 | 106.4 |
| 2011 | |||||
| January | 102.0 | 101.6 | 98.4 | 103.7 | 107.2 |
| February | 103.0 | 102.5 | 99.0 | 105.4 | 108.4 |
| March | 104.2 | 104.4 | 99.5 | 106.5 | 109.3 |
| April | 105.2 | 106.7 | 100.1 | 107.6 | 109.8 |
| May | 105.9 | 107.8 | 100.5 | 108.7 | 109.9 |
| June | 106.2 | 108.5 | 101.2 | 109.0 | 109.8 |
| July | 106.5 | 108.9 | 101.1 | 109.5 | 109.8 |
| August | 106.6 | 109.1 | 100.8 | 110.1 | 110.1 |
| September | 106.6 | 108.7 | 100.3 | 110.4 | 110.1 |
| October | 106.6 | 108.4 | 99.8 | 110.9 | 110.4 |
| November | 106.4 | 108.1 | 99.4 | 111.2 | 110.1 |
| December | 106.2 | 107.5 | 98.6 | 111.6 | 108.9 |
| 2012 | |||||
| January | 106.6 | 107.7 | 98.4 | 111.9 | 109.6 |
| February | 107.5 | 108.7 | 99.1 | 113.3 | 110.1 |
| March | 108.8 | 110.0 | 99.9 | 115.1 | 111.6 |
| April | 109.9 | 110.7 | 100.8 | 116.4 | 112.4 |
| May | 110.6 | 111.2 | 101.9 | 117.5 | 112.6 |
| June | 110.8 | 110.4 | 102.6 | 117.7 | 113.0 |
| July | 110.6 | 109.5 | 102.9 | 117.3 | 112.6 |
| August | 110.5 | 108.4 | 102.9 | 117.1 | 112.6 |
| September | 110.3 | 107.8 | 103.0 | 117.1 | 112.7 |
| October | 110.0 | 107.3 | 102.7 | 116.9 | 112.6 |
| November | 109.6 | 106.4 | 102.6 | 116.6 | 112.2 |
| December | 109.3 | 105.3 | 102.5 | 116.3 | 112.3 |
| 2013 | |||||
| January | 109.7 | 104.9 | 103.0 | 116.2 | 112.5 |
| February | 110.5 | 105.3 | 104.0 | 117.0 | 113.3 |
| March | 111.6 | 105.8 | 105.1 | 118.6 | 114.2 |
| April | 112.7 | 106.7 | 106.5 | 119.9 | 114.6 |
| May | 113.6 | 106.6 | 107.6 | 121.0 | 116.4 |
| June | 113.9 | 107.3 | 108.3 | 121.5 | 115.6 |
| July | 114.1 | 107.3 | 109.0 | 121.6 | 115.4 |
| August | 114.2 | 107.2 | 109.4 | 121.8 | 115.3 |
| September | 114.4 | 107.4 | 109.8 | 122.1 | 115.3 |
| October | 114.5 | 107.2 | 111.0 | 122.4 | 115.2 |
| November | 114.7 | 107.6 | 111.6 | 123.2 | 115.1 |
| December | 114.6 | 107.5 | 112.0 | 123.4 | 114.8 |
| 2014 | |||||
| January | 114.9 | 108.2 | 112.6 | 124.4 | 114.6 |
| February | 116.1 | 108.9 | 114.0 | 125.6 | 116.1 |
| March | 117.3 | 109.9 | 115.5 | 127.2 | 116.4 |
| April | 118.4 | 110.6 | 117.2 | 128.5 | 116.4 |
| May | 119.4 | 111.6 | 119.0 | 129.6 | 116.5 |
| June | 120.0 | 112.1 | 120.2 | 130.9 | 116.5 |
| July | 120.2 | 112.2 | 120.7 | 131.2 | 116.0 |
| August | 120.2 | 112.6 | 121.1 | 131.0 | 115.6 |
| September | 120.4 | 113.0 | 121.5 | 131.3 | 115.4 |
| October | 120.7 | 113.6 | 121.8 | 132.1 | 115.6 |
| November | 120.8 | 113.8 | 121.6 | 132.7 | 115.4 |
| December | 120.9 | 114.1 | 121.5 | 133.0 | 115.1 |
| 2015 | |||||
| January | 121.1 | 114.5 | 121.8 | 133.5 | 115.2 |
| February | 122.1 | 115.9 | 121.4 | 135.2 | 115.8 |
| March | 123.5 | 118.0 | 121.1 | 137.2 | 116.9 |
| April | 124.7 | 120.0 | 120.2 | 139.4 | 117.5 |
| May | 125.7 | 122.1 | 120.2 | 141.2 | 117.5 |
| June | 126.7 | 123.7 | 120.6 | 142.7 | 117.8 |
| July | 127.2 | 124.9 | 120.5 | 143.6 | 118.0 |
| August | 127.5 | 126.4 | 120.5 | 144.1 | 117.3 |
| September | 128.1 | 128.7 | 120.5 | 145.0 | 117.1 |
| October | 128.4 | 130.9 | 120.0 | 145.5 | 117.1 |
| November | 129.1 | 133.9 | 119.4 | 146.1 | 117.1 |
| December | 129.2 | 135.5 | 118.6 | 146.5 | 117.2 |
| 2016 | |||||
| January | 130.1 | 138.1 | 117.7 | 147.1 | 116.8 |
| February | 132.0 | 142.2 | 117.0 | 149.8 | 117.7 |
| March | 134.4 | 145.9 | 116.2 | 153.2 | 118.7 |
| April | 137.1 | 151.1 | 115.9 | 157.0 | 119.2 |
| May | 140.8 | 158.6 | 115.7 | 162.2 | 119.7 |
| June | 143.1 | 163.5 | 115.9 | 165.1 | 120.0 |
| July | 144.5 | 165.7 | 115.8 | 167.0 | 120.0 |
| August | 145.5 | 166.2 | 115.8 | 168.7 | 120.3 |
| September | 146.3 | 165.3 | 115.8 | 170.8 | 120.1 |
| October | 147.2 | 163.9 | 115.6 | 173.9 | 120.2 |
| November | 147.6 | 162.3 | 115.0 | 175.3 | 120.6 |
| December | 147.9 | 160.1 | 114.8 | 177.0 | 121.0 |
| 2017 | |||||
| January | 149.9 | 160.0 | 114.7 | 180.4 | 121.2 |
| February | 153.0 | 161.8 | 114.5 | 186.0 | 121.6 |
| March | 158.8 | 164.7 | 114.8 | 197.3 | 122.9 |
| April | 163.5 | 168.7 | 115.1 | 206.4 | 123.8 |
| May | 165.1 | 173.3 | 116.1 | 208.5 | 124.2 |
| June | 164.9 | 176.6 | 116.6 | 206.9 | 124.8 |
| July | 162.2 | 180.3 | 117.0 | 197.3 | 125.8 |
| August | 160.8 | 182.0 | 116.8 | 192.8 | 125.8 |
| September | 160.9 | 183.2 | 116.5 | 191.9 | 126.3 |
| October | 160.6 | 183.9 | 115.9 | 190.9 | 127.0 |
| November | 160.3 | 184.8 | 115.2 | 190.1 | 127.1 |
| December | 160.4 | 185.6 | 114.3 | 189.8 | 127.6 |
| 2018 | |||||
| January | 160.9 | 186.8 | 114.1 | 189.7 | 127.4 |
| February | 162.8 | 189.4 | 114.7 | 191.9 | 129.0 |
| March | 164.8 | 191.6 | 115.2 | 194.2 | 130.4 |
| April | 165.8 | 192.8 | 115.2 | 195.6 | 131.6 |
| May | 166.8 | 193.2 | 115.4 | 197.1 | 132.5 |
| June | 166.5 | 193.2 | 115.4 | 197.1 | 132.9 |
| July | 166.0 | 192.2 | 115.1 | 196.1 | 132.9 |
| August | 165.1 | 189.5 | 114.1 | 195.6 | 133.1 |
| September | 164.6 | 187.3 | 113.4 | 195.7 | 134.0 |
| October | 164.4 | 185.8 | 112.9 | 196.0 | 134.9 |
| November | 163.6 | 182.3 | 111.9 | 195.3 | 135.0 |
| December | 162.9 | 180.6 | 110.7 | 195.4 | 135.2 |
| 2019 | |||||
| January | 162.2 | 178.4 | 109.7 | 194.8 | 135.5 |
| February | 162.7 | 177.8 | 109.6 | 196.4 | 137.0 |
| March | 164.0 | 176.9 | 109.5 | 199.2 | 138.7 |
|
Note: Data for the time period above are MLS home price index values expressed using January 2010 as the base period. Source: The Canadian Real Estate Association. |
|||||
Monthly housing starts averaged 207,000 units (seasonally adjusted an annual rates) during the second half of 2018, down from 221,000 in the first six months of the year. Average starts in Ontario and Quebec edged down in the second half. Ground-breaking on new homes in Quebec declined in the third quarter on lower apartment starts, before rebounding in the fourth. Urban single-detached starts in Ontario continued to edge lower during the second half of the year, while ground-breaking on multi-family units rose in the fourth quarter on increases in Toronto. More recently, average housing starts slowed to 187,000 annualized units in the first quarter of 2019.
Residential building permits edged lower during the second half 2018. Permits in the second half totalled $30.8 billion, down from $32.0 billion in the first. Lower permits for single-detached dwellings accounted for the decline.
Headline consumer inflation slowed on declines in gasoline prices
After rising to 3.0% in July, consumer price inflation moderated in the second half of 2018, slowing to 1.7% in November before edging up to 2.0% at year end. Changes in gasoline prices along with transitory changes in the prices for air transportation and travel tours contributed to movements in the headline rate.
Gasoline prices, measured year-over-year, moderated sharply in the second half of 2018, as annual price increases slowed from 25% at mid-year to 12% in October. Gasoline prices declined on a year-over-year basis late in the year and were down 8.6% in December. Higher prices for air transportation and travel tours contributed to increases in the headline rate during the summer months and again in December. In these months, the services index rose above 3% on a year-over-year basis. Food prices, measured year-over-year, increased towards year end, accelerating to 2.9% in December.
The homeowners’ replacement cost index, which in part reflects changes in new housing prices, moderated in the second half of the year, slowing to 0.2% at year end. In contrast, the mortgage interest cost index continued to increase during the second half of 2018. Mortgage interest costs in December were 7.5% higher on a year-over-year basis.
All of the Bank of Canada’s preferred measures of core inflation (CPI-common CPI-trim, and CPI-median) edged below the 2% mark in late 2018. At year end, the three core measures ranged from 1.8% to 1.9%.Note 12
Movements in headline consumer inflation tracked year-over-year changes in average weekly earnings during the second half of 2018, as both slowed towards the end of the year following larger increases in the summer months. More recently, headline consumer inflation decelerated to 1.4% in January 2019 on downward pressure from lower gas prices. Consumer inflation edged up to 1.5% in February before accelerating to 1.9% in March.
Equities declined on broad-based losses
Toronto stock prices (S&P/TSX composite index) fell sharply in the second half of 2018, following little net change over the first six months of the year. The composite index closed at 14,323 at year end, down 12% from June, following sizable losses in the fourth quarter. The Canadian energy index fell by 33% in the second half, posting double-digit losses in October and November. Financials, industrials and consumer discretionary stocks also posted losses in the second half, reflecting large declines in December. The gold index strengthened towards year end, following declines in the third quarter.
More recently, the S&P/TSX composite index rose by 9% in January and 3% in February as energy, financial, industrial and consumer stocks strengthened. Equity prices continued to increase in March, as the composite index closed at 16,102 at month end.
Borrowing costs increased as the debt service ratio edged higher
Yields on benchmark Government of Canada five-year bonds rose from July to October, before edging lower late in the year. Five-year yields were at 1.93% at year end, down from a recent high of 2.42% in October. The spread between two- and ten-year yields narrowed late in 2018 as ten-year yields edged below 2%.
In October, the Bank of Canada raised the target for the overnight rate by 25 basis points to 1.75%, following a 25 basis point increase in July. October’s increase marked the fifth increase since mid-2017. Canada’s major banks announced on October 24th that they had increased their prime lending rates by a further 25 basis points to 3.95%.
The debt service ratio for the household sector—the total obligated payments of principal and interest on household credit market debt as a share of disposable income—continued to edge higher during the second half of 2018. The debt service ratio rose to 14.9% in the fourth quarter after increasing to 14.7% in the third. As of the fourth quarter, the household debt service ratio was at its highest level since the last quarter of 2007.
Commodity prices fell as the dollar weakened
The value of the Canadian dollar trended lower in the second half of 2018, as offsetting movements in the third quarter gave way to declines in the fourth. After trading as high as 78.1 cents U.S. at the start of October, the dollar depreciated towards year end, closing at 73.3 cents U.S. at the end of December.Note 13 More recently, the Canadian dollar strengthened in early 2019, trading at 76.1 cents U.S. at the end of January. The dollar trended lower during February and March, closing at 74.8 cents U.S. at the end of the first quarter.
Commodity prices declined during the second half of 2018, offsetting gains earlier in the year. Commodity prices at year end were down 19% from levels at mid-year. Declines were-broad based across commodities, as prices for energy, metals and minerals, agricultural products and forestry products all fell.
Overall, commodity prices at year end were down 7% from price levels at the end of 2017. More recently, commodity prices advanced from January to March, led by a 16% increase in energy prices.
Lower household wealth on declines in equities and housing
The net worth of households fell 2.8% in the fourth quarter after edging down (-0.2%) in the third (Chart 13). The decline in late 2018 was the largest quarterly decrease in household net worth in ten years. The value of household equity and investment funds assets was down 7.5% in the fourth quarter, while lower values for residential real estate also detracted from household net worth. Total household assets at the end of 2018 were valued at $12.98 trillion, while total financial liabilities amounted to $2.24 trillion.

Data table for Chart 13
| Net worth | Non-financial assets | Financial assets | Financial liabilities | |
|---|---|---|---|---|
| billions of dollars | ||||
| 2010 | ||||
| First quarter | 140.2 | 87.3 | 63.6 | -10.8 |
| Second quarter | -2.1 | 62.0 | -30.3 | -33.7 |
| Third quarter | 226.7 | 35.7 | 212.3 | -21.3 |
| Fourth quarter | 165.8 | 49.0 | 138.7 | -21.9 |
| 2011 | ||||
| First quarter | 200.7 | 91.8 | 111.1 | -2.1 |
| Second quarter | 86.2 | 85.9 | 32.2 | -31.9 |
| Third quarter | -58.4 | 72.6 | -106.1 | -24.9 |
| Fourth quarter | 135.8 | 48.3 | 109.5 | -22.1 |
| 2012 | ||||
| First quarter | 243.9 | 102.7 | 146.2 | -5.1 |
| Second quarter | 62.5 | 98.8 | -10.0 | -26.3 |
| Third quarter | 176.3 | 58.1 | 142.7 | -24.5 |
| Fourth quarter | 119.4 | 38.8 | 93.5 | -12.9 |
| 2013 | ||||
| First quarter | 208.0 | 70.7 | 147.4 | -10.2 |
| Second quarter | -7.8 | 87.8 | -70.6 | -25.0 |
| Third quarter | 166.9 | 89.9 | 102.7 | -25.6 |
| Fourth quarter | 262.5 | 63.7 | 214.0 | -15.1 |
| 2014 | ||||
| First quarter | 240.1 | 71.2 | 175.7 | -6.9 |
| Second quarter | 216.4 | 96.3 | 147.6 | -27.5 |
| Third quarter | 97.7 | 60.5 | 65.8 | -28.6 |
| Fourth quarter | 158.2 | 44.3 | 130.0 | -16.1 |
| 2015 | ||||
| First quarter | 279.5 | 53.3 | 237.0 | -10.7 |
| Second quarter | 22.8 | 105.4 | -46.8 | -35.8 |
| Third quarter | -13.4 | 86.2 | -67.7 | -31.8 |
| Fourth quarter | 204.2 | 118.7 | 108.1 | -22.6 |
| 2016 | ||||
| First quarter | 185.6 | 142.9 | 56.3 | -13.7 |
| Second quarter | 202.2 | 85.6 | 155.9 | -39.3 |
| Third quarter | 245.9 | 65.9 | 208.3 | -28.3 |
| Fourth quarter | 135.2 | 118.6 | 41.1 | -24.4 |
| 2017 | ||||
| First quarter | 261.0 | 142.0 | 130.6 | -11.6 |
| Second quarter | 38.7 | 18.8 | 59.6 | -39.8 |
| Third quarter | -9.9 | 9.3 | 9.8 | -28.9 |
| Fourth quarter | 232.7 | 52.6 | 202.9 | -22.8 |
| 2018 | ||||
| First quarter | 65.1 | 72.0 | -0.8 | -6.1 |
| Second quarter | 101.4 | 28.6 | 105.0 | -32.2 |
| Third quarter | -17.8 | -24.0 | 31.2 | -25.0 |
| Fourth quarter | -304.3 | -60.8 | -224.4 | -19.0 |
|
Note: Negative values indicate a decline in the value of assets or an increase in the value of liabilities. Source: Statistics Canada, table 36-10-0580-01. |
||||
After slowing during the first two quarters of 2018, household borrowing edged higher during the second half of the year.Note 14 Total credit market borrowing among households—which includes mortgage loans, non-mortgage loans, and consumer credit—was $21.2 billion in the fourth quarter, up from $20.9 billion in the third. All of the increase late in the year reflected higher mortgage borrowing, which rose to $12.3 billion. Nonetheless, mortgage borrowing in the fourth quarter remained over 20% below levels in late 2017, before the new minimum qualifying rate for uninsured mortgages took effect in January 2018.
The ratio of household credit market debt to disposable income, measured on a seasonally-adjusted basis, rose to 178.5% in the fourth quarter, while the household debt-to-asset ratio edged up to 17.3%. While the debt-to-asset ratio rose in both the third and fourth quarters, it has generally trended lower since the 2008-2009 recession.
References
Gellatly, G. and R. Morissette. 2017. Non-resident Ownership of Residential Properties in Toronto and Vancouver: Initial data from the Canadian Housing Statistics Program. Economic Insights, no. 78. Statistics Canada Catalogue no. 11-626-X. Ottawa Statistics Canada.
Gellatly, G. and R. Morissette. 2018. Immigrant Ownership of Residential Properties in Toronto and Vancouver. Economic Insights, no. 87. Statistics Canada Catalogue no. 11-626-X. Ottawa Statistics Canada.
Gellatly, G. and E. Richards. 2018. Recent Developments in the Canadian Economy: Fall 2018. Economic Insights, no. 85. Statistics Canada Catalogue no. 11-626-X. Ottawa Statistics Canada.
Gellatly, G. and E. Richards. 2019. Indebtedness and Wealth Among Canadian Households. Economic Insights, no. 89. Statistics Canada Catalogue no. 11-626-X. Ottawa Statistics Canada.
Heisz, A. and E. Richards. 2019. Economic Well-being Across Generations of Young Canadians. Are Millennials Better or Worse Off? Economic Insights, no. 92. Statistics Canada Catalogue no. 11-626-X. Ottawa Statistics Canada.
Patterson, M. M. Hazel and D. Saunders. 2019. Annual review of the labour market, 2018. Labour Statistics: Research Papers. Catalogue no. 75-004-M-2019002. Ottawa: Statistics Canada.
Statistics Canada. Bank of Canada’s preferred measures of core inflation. Last updated November 18, 2016. (accessed March 22, 2016). Available at: http://www23.statcan.gc.ca/imdb-bmdi/document/2301_D63_T9_V1-eng.htm (accessed March 22, 2016).
- Date modified: