
Economic Insights
Indebtedness and Wealth Among Canadian Households

Archived Content
Information identified as archived is provided for reference, research or recordkeeping purposes. It is not subject to the Government of Canada Web Standards and has not been altered or updated since it was archived. Please "contact us" to request a format other than those available.
by Guy Gellatly and ,Elizabeth Richards Analytical Studies Branch, Statistics Canada
This article in the Economic Insights series examines data on the financial conditions of Canadian households, focusing on recent trends related to indebtedness and net worth. Aggregate leverage indicators are examined for the household sector as a whole, followed by a more detailed analysis of households with different income profiles in selected urban areas. This study highlights the extent to which indebtedness and household wealth differ across the country and for different income groups.
Introduction
Household debt-to-income levels in Canada and the United States have trended in opposite directions over the last decade, reflecting inter alia differences in the impact of the financial crisis and Great Recession on household balance sheets in the two countries. U.S. households were more severely affected by these events as sharp reductions in the value of household assets resulted in substantial deleveraging.Note Debt-to-income levels for U.S. households have fallen sharply over the last decade, and are currently about 25% below pre-recession levels. By contrast, debt-to-income levels among Canadian households continued to edge higher in the years following the recession, before rising sharply in 2015 and 2016 when income growth slowed as the economy adjusted to lower oil prices. Currently, Canadian debt-to-income levels are over 20% higher than in late 2007 (Chart 1).
Levels of household indebtedness in Canada have also garnered much attention in recent years, in part because household spending has been a consistent source of economic growth, compared with less-even contributions to growth from investment spending and exports. The gradual onset of higher borrowing costs since mid-2017 coupled with increased house prices has brought about a renewed focus on the ability of households to manage their existing debt liabilities, particularly in view of slower wage growth.
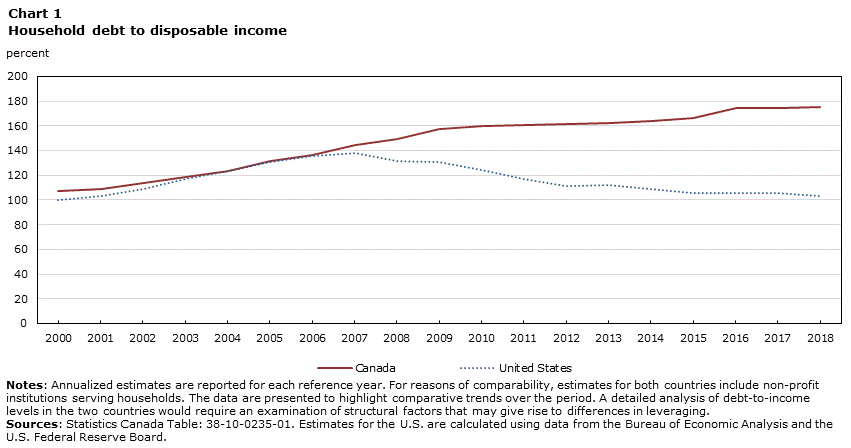
Data table for Chart 1
| Year | Canada | United States |
|---|---|---|
| percent | ||
| 2000 | 106.93 | 99.88 |
| 2001 | 109.08 | 103.37 |
| 2002 | 113.30 | 108.69 |
| 2003 | 118.18 | 116.72 |
| 2004 | 123.67 | 123.20 |
| 2005 | 131.43 | 130.63 |
| 2006 | 136.44 | 135.29 |
| 2007 | 144.20 | 137.93 |
| 2008 | 149.03 | 131.69 |
| 2009 | 157.53 | 130.91 |
| 2010 | 159.43 | 124.06 |
| 2011 | 160.93 | 117.13 |
| 2012 | 161.45 | 111.37 |
| 2013 | 162.18 | 112.38 |
| 2014 | 164.00 | 108.56 |
| 2015 | 166.54 | 105.53 |
| 2016 | 174.65 | 105.88 |
| 2017 | 174.24 | 105.23 |
| 2018 | 174.94 | 103.07 |
|
Notes: Annualized estimates are reported for each reference year. For reasons of comparability, estimates for both countries include non-profit institutions serving households. The data are presented to highlight comparative trends over the period. A detailed analysis of debt-to-income levels in the two countries would require an examination of structural factors that may give rise to differences in leveraging. Sources: Statistics Canada Table: 38-10-0235-01. Estimates for the U.S. are calculated using data from the Bureau of Economic Analysis and the U.S. Federal Reserve Board. |
||
Perspectives on household leverage
The Canadian Economic Accounts publishes a range of financial indicators aimed at monitoring financial conditions in the household sector.Note Chief among these is the ratio of credit-market debt to disposable income. It compares the stock of all household credit market debt—the current value of all existing mortgage loan liabilities, non-mortgage loan liabilities, and household lines of credit — to the level of after-tax disposable income that households earn from current economic activity. A stock-to-flow indicator,Note it measures the ability of households to manage their existing debt liabilities out of current income flows, and closely tracks the annualized debt to income series reported in Chart 1 – pointing to a gradual build-up of household leveraging during the years that followed the recession, followed by larger increases in 2015 and 2016.Note
One limitation of debt-to-income ratios as a potential measure of financial risk is that they do not take into account changes in the value of the stock of household assets, which along with liabilities, determine changes in household net worth. To this end, debt-to-asset ratios provide an alternate indicator of household leverage—tracking the proportion of assets that is currently being financed by debt (Chart 2). Debt-to-asset ratios also measure the ability of households to manage their debt liabilities, assuming that they are able to liquidate assets to meet their existing financial obligations.
Data table for Chart 2
| Year | Credit market debt to disposable income (LHS) | Debt to total assets (RHS) |
|---|---|---|
| percent | ||
| 2000 | ||
| Q1 | 105.00 | 13.99 |
| Q2 | 105.08 | 13.91 |
| Q3 | 105.37 | 14.02 |
| Q4 | 104.71 | 14.38 |
| 2001 | ||
| Q1 | 103.36 | 14.64 |
| Q2 | 104.24 | 14.76 |
| Q3 | 105.19 | 15.22 |
| Q4 | 105.95 | 15.01 |
| 2002 | ||
| Q1 | 106.75 | 14.91 |
| Q2 | 108.10 | 15.40 |
| Q3 | 109.44 | 15.82 |
| Q4 | 110.19 | 15.78 |
| 2003 | ||
| Q1 | 110.30 | 16.04 |
| Q2 | 111.26 | 15.91 |
| Q3 | 113.51 | 16.05 |
| Q4 | 115.43 | 15.91 |
| 2004 | ||
| Q1 | 116.17 | 15.81 |
| Q2 | 119.32 | 16.10 |
| Q3 | 120.81 | 16.35 |
| Q4 | 122.16 | 16.41 |
| 2005 | ||
| Q1 | 123.71 | 16.36 |
| Q2 | 126.25 | 16.39 |
| Q3 | 128.38 | 16.40 |
| Q4 | 129.70 | 16.51 |
| 2006 | ||
| Q1 | 129.60 | 16.20 |
| Q2 | 131.41 | 16.45 |
| Q3 | 133.25 | 16.59 |
| Q4 | 134.63 | 16.49 |
| 2007 | ||
| Q1 | 135.86 | 16.35 |
| Q2 | 138.86 | 16.53 |
| Q3 | 141.26 | 16.81 |
| Q4 | 142.55 | 17.17 |
| 2008 | ||
| Q1 | 144.34 | 17.24 |
| Q2 | 146.49 | 17.27 |
| Q3 | 147.24 | 18.33 |
| Q4 | 147.48 | 19.06 |
| 2009 | ||
| Q1 | 147.78 | 19.31 |
| Q2 | 150.74 | 19.04 |
| Q3 | 153.63 | 18.77 |
| Q4 | 155.80 | 18.86 |
| 2010 | ||
| Q1 | 154.56 | 18.64 |
| Q2 | 156.24 | 18.99 |
| Q3 | 157.34 | 18.68 |
| Q4 | 157.68 | 18.52 |
| 2011 | ||
| Q1 | 156.51 | 18.10 |
| Q2 | 157.80 | 18.22 |
| Q3 | 158.48 | 18.58 |
| Q4 | 158.87 | 18.50 |
| 2012 | ||
| Q1 | 157.86 | 18.05 |
| Q2 | 159.11 | 18.16 |
| Q3 | 159.76 | 18.03 |
| Q4 | 159.49 | 17.92 |
| 2013 | ||
| Q1 | 159.01 | 17.62 |
| Q2 | 159.82 | 17.84 |
| Q3 | 160.38 | 17.76 |
| Q4 | 160.03 | 17.42 |
| 2014 | ||
| Q1 | 159.55 | 17.07 |
| Q2 | 160.51 | 16.94 |
| Q3 | 161.74 | 17.01 |
| Q4 | 161.75 | 16.88 |
| 2015 | ||
| Q1 | 160.81 | 16.54 |
| Q2 | 162.27 | 16.77 |
| Q3 | 163.43 | 17.03 |
| Q4 | 164.14 | 16.89 |
| 2016 | ||
| Q1 | 165.89 | 16.72 |
| Q2 | 169.46 | 16.71 |
| Q3 | 171.53 | 16.57 |
| Q4 | 172.67 | 16.55 |
| 2017 | ||
| Q1 | 172.04 | 16.29 |
| Q2 | 173.52 | 16.50 |
| Q3 | 173.77 | 16.70 |
| Q4 | 173.22 | 16.55 |
| 2018 | ||
| Q1 | 171.69 | 16.50 |
| Q2 | 172.62 | 16.58 |
| Q3 | 173.62 | 16.76 |
| Q4 | 174 | 17.28 |
|
Notes: Quarterly data, unadjusted for seasonality. LHS: left-hand side axis. RHS: right-hand side axis. Source: Statistics Canada table 38-10-0235-01. |
||
The debt liabilities of Canadian households, measured relative to the value of their total assets, trended lower in the years following the 2008-2009 recession, and continued to decline during 2015 and 2016 when credit market debt, expressed as a percentage of household income, was rising. The downward trend in the debt-to-asset ratio underscores the relative strength of household asset growth in the post-recession period. Since the end of 2009, the value of all assets held in the household sector has risen by 68% to $13.0 trillion, supported by comparable increases in the value of financial and non-financial holdings.Note The financial liabilities of households rose by 54%, to $2.2 trillion, during this nine-year period. As a result, the aggregate net worth of Canadian households (the value of all assets net of liabilities) has grown from $6.3 trillion at the end of 2009 to a current value of $10.7 trillion. Note
The above data highlight financial trends for the household sector as a whole. They are not designed to track whether potential imbalances on the household balance sheet are more likely to affect some groups of households more than others. To support the analysis of these issues, the Canadian Economic Accounts has begun publishing annual tables that track changes in the distribution of assets, liabilities and net worth among households with different income profiles and socio-demographic characteristics.
These distribution tables show that increases in household net worth have occurred broadly across the household income distribution. Between 2010 and 2017, households in every income quintile experienced increases in net worth, with gains in the value of household assets outpacing increases in financial liabilities. The net worth (or wealth) of households in the bottom income quintile grew by 88% between 2010 and 2017, as their average wealth, measured on a per household basis, rose from $124,100 to $213,800. During this period, the overall share of total household wealth accounted for by those in the lowest quintile rose from 4.9% to 5.8%.
Among households in the top-income quintile, net worth rose by 56% from 2010 to 2017, as per household wealth grew from $1,267,100 to $1,809,300. At the same time, the share of household wealth held by top-quintile households declined from 50.3% in 2010 to 49% in 2017.
In 2017, households in the lowest income quintile accounted for 13.1% of total household liabilities, while those in the top quintile accounted for 30.8%. In contrast, lowest-quintile households held 7% of total assets, compared to a 46% share among top-quintile households.Note
Household wealth and indebtedness differ substantially across the country
Detailed estimates of indebtedness and median wealth are available from the Survey of Financial Security (SFS)—and support comparisons of families with different income profiles in various parts of the country.Note The most recent reference year for the SFS is 2016.
Families living in British Columbia and Ontario exhibit higher median wealth than those living in other provinces. While the value of their total assets is higher, households in British Columbia are also more leveraged than in other areas of the country. In 2016, families in British Columbia had debt levels that, on average, were 210% of their after-tax income, compared to 172% and 174% for families in Ontario and Alberta, respectively.Note
By comparison, families in the Atlantic Provinces were the least indebted relative to levels of after-tax income, which reflects both lower rates of homeownership and lower home prices. Debt-to-income ratiosNote ranged from 107% in Prince Edward Island to 122% in Newfoundland and Labrador, below the national average of 165%. Among the remaining provinces, debt-to-income ratios ranged from 130% in Saskatchewan to 139% in Quebec and 144% in Manitoba.
Chart 3 reports debt-to-income estimates for selected census metropolitan areas. Families in Victoria, Vancouver and Toronto carry more than 200% of debt relative to their after-tax income (ranging from 210% in Toronto to 240% in Victoria). Debt to income ratios in Calgary, Hamilton and Edmonton were also higher than the national average.

Data table for Chart 3
| Canada and census metropolitan areas | Debt to after-tax family income ratio |
|---|---|
| percent | |
| Moncton | 106 |
| London | 113 |
| Fredericton | 119 |
| Kitchener | 124 |
| Quebec City | 131 |
| Saskatoon | 139 |
| Winnipeg | 144 |
| Regina | 144 |
| Ottawa-Gatineau | 149 |
| Montreal | 154 |
| Canada | 165 |
| Edmonton | 171 |
| Hamilton | 183 |
| Calgary | 189 |
| Toronto | 210 |
| Vancouver | 230 |
| Victoria | 240 |
| Source: Special tabulations, Statistics Canada, Survey of Financial Security, 2016. | |
Higher mortgage liabilities as a share of total debt
Much of the increase in household debt in the post-recession period reflects the accumulation of mortgage liabilities on the household balance sheet. The Survey of Financial Security publishes detailed estimates of family balance sheets in 2016 constant dollars to support inflation-adjusted comparisons over time. In 2016, mortgages accounted for 80.7% of the total debt carried by Canadian families, up from 77.4% in 1999. During this period, the share of debt accounted for by lines of credit also rose, while debt from student and vehicle loans and other sources declined.
Higher mortgage liabilities contributed to higher debt-to-income levels across the country. From 1999 to 2016, median levels of mortgage debt for Canada as a whole, measured in 2016 dollars, rose from $95,400 to $190,000, as the ratio of debt to after-tax family income increased from 94% to 165%.Note During this period, debt-to-income levels doubled to 210% in Toronto and rose from 148% to 230% in Vancouver.
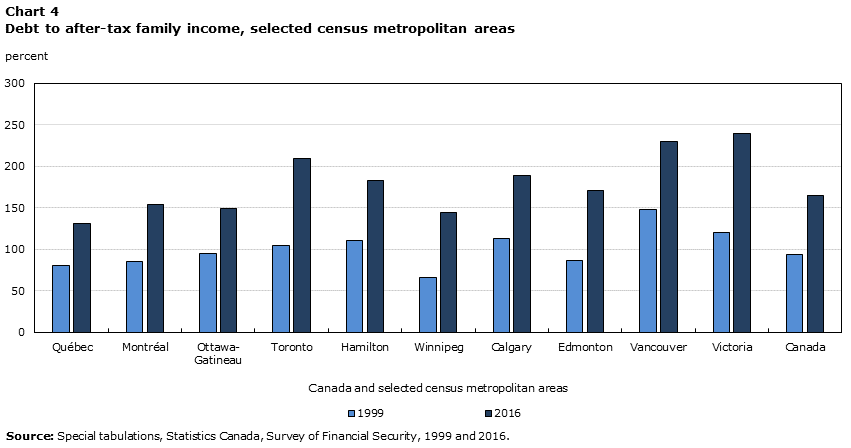
Data table for Chart 4
| Canada and census metropolitan areas | 1999 | 2016 |
|---|---|---|
| percent | ||
| Québec | 80 | 131 |
| Montréal | 85 | 154 |
| Ottawa- Gatineau |
95 | 149 |
| Toronto | 105 | 210 |
| Hamilton | 111 | 183 |
| Winnipeg | 66 | 144 |
| Calgary | 113 | 189 |
| Edmonton | 87 | 171 |
| Vancouver | 148 | 230 |
| Victoria | 120 | 240 |
| Canada | 94 | 165 |
| Source: Special tabulations, Statistics Canada, Survey of Financial Security, 1999 and 2016. | ||
Increases in housing prices bolstered median net worth in Toronto and Vancouver
As debt-to-income levels rose with higher mortgage liabilities, sizable increases in the value of residential assets strengthened household balance sheets. From 1999 to 2016, principal residences accounted for 39% of the real growth in family-owned assets for Canada as a whole, with gains in other real estate holdings accounting for an additional 12%.Note The contribution of housing to real asset growth is more pronounced in Toronto and Vancouver. In these cities, principal residences accounted for over 50% of real asset growth during this period. By contrast, principal residences in Montreal accounted for 32% of the total increase in family-held assets.
Increases in the value of family-held assets, in turn, have been accompanied by sizable increases in median net worth—a measure of economic well-being among families at the mid-point of the wealth distribution. For Canada as a whole, median net worth, measured in real terms, rose from $144,500 in 1999 to $295,100 in 2016, led by gains in Toronto and Vancouver. Median net worth in Toronto grew by 121% to $365,100, while in Vancouver it rose by 188% to $434,400. Notable increases were also apparent in Calgary and Winnipeg.
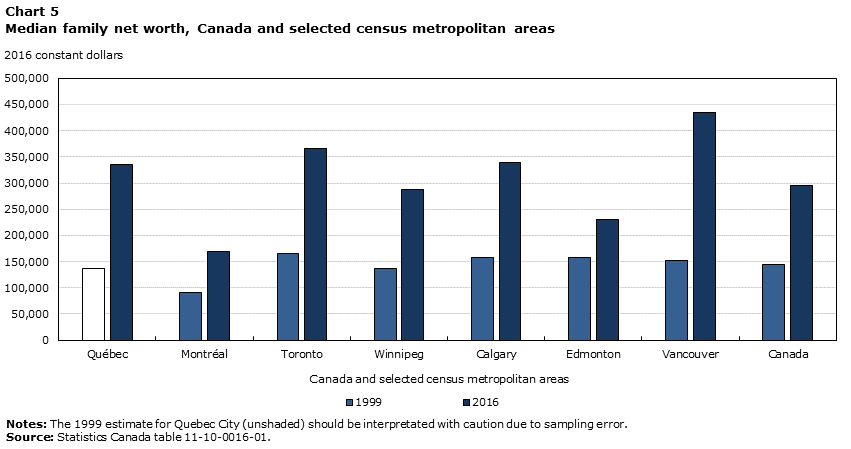
Data table for Chart 5
| Canada and census metropolitan areas | 1999 | 2016 |
|---|---|---|
| 2016 constant dollars | ||
| Québec | 137,400 | 335,100 |
| Montréal | 91,600 | 170,000 |
| Toronto | 165,300 | 365,100 |
| Winnipeg | 136,500 | 287,800 |
| Calgary | 156,900 | 339,400 |
| Edmonton | 158,300 | 230,200 |
| Vancouver | 151,100 | 434,400 |
| Canada | 144,500 | 295,100 |
|
Notes: The 1999 estimate for Quebec City (unshaded) should be interpretated with caution due to sampling error. Source: Statistics Canada table 11-10-0016-01. |
||
While families in Montreal are less indebted than those in Toronto and Vancouver, they also have lower levels of median wealth. In 2016, families in Montreal carried 154% of debt relative to the income levels. At the same time, median wealth (assets less liabilities) in Montreal was $170,000, about 60% below levels in Vancouver and 53% below levels in Toronto. Lower net worth in Montreal partly reflects differences in homeownership rates and home prices. About one in two Montreal families had principal residences as part of their asset portfolio in 2016, compared to 58% in Toronto and 55% in Vancouver. Among homeowners in Montreal, the median value of these principal residences was $300,000, compared to $850,000 in Vancouver and $700,000 in Toronto.
Lower income families in Toronto and Vancouver among the most vulnerable
The SFS balance sheet data highlight the extent to which increases in debt exposure have been accompanied by rising wealth levels, particularly in Toronto and Vancouver. This gives rise to two competing perspectives on the evolution of financial vulnerabilities in these cities—as increases in indebtedness relative to income point to increased risk exposure, while reductions in leverage relative to net assets point to lower levels of risk as balance sheets strengthen. More detailed data from the SFS can provide guidance on the extent to which patterns of indebtedness and wealth differ across family income levels.
Debt-to-income levels are much more pronounced among lower income families in Toronto and Vancouver (Chart 6). Families in the lowest income quintile in Toronto carry 420% of debt relative to their disposable income, over twice the national average for lowest-quintile families. The estimate for lowest-quintile families in Vancouver is similar (400%).

Data table for Chart 6
| Census metropolitan areas | After-tax income quintiles | Total Debt to Total after-tax income ratio |
|---|---|---|
| percent | ||
| Montreal | Lowest quintile | 105 |
| Second quintile | 101 | |
| Third quintile | 122 | |
| Fourth quintile | 172 | |
| Highest quintile | 173 | |
| Toronto | Lowest quintile | 420 |
| Second quintile | 230 | |
| Third quintile | 250 | |
| Fourth quintile | 270 | |
| Highest quintile | 162 | |
| Vancouver | Lowest quintile | 400 |
| Second quintile | 230 | |
| Third quintile | 180 | |
| Fourth quintile | 250 | |
| Highest quintile | 220 | |
| Source: Special tabulations, Survey of Financial Security, 2016. | ||
Low income families in Montreal have significantly lower levels of indebtedness. At 105%, the debt to income ratio for Montreal families in the lowest income quintile is about four times less than in Toronto or Vancouver.Note
The estimates in Chart 6 also highlight differences at the top end of the income distribution. Much of the difference in overall debt to income levels between Vancouver and Toronto reflects higher leverage among top-earning families. In Vancouver, families in the top quintile carry 220% of debt relative to their disposable income, compared to about 162% in Toronto. The ratio among top-earning families in Montreal is 173%.
Table 1 reports estimates of median wealth for each of these income groups. These wealth estimates put the debt-to-income data for lower income households in each of these three cities into better context. In 2016, families in the lowest income quintile in Vancouver (with an average debt to income ratio of 400%) had a median wealth of $19,300, while those in Toronto (with a ratio of 420%) had a median wealth of $9,000. The median wealth on lowest-quintile families in Montreal (with much lower debt to income levels) was $5,200.
These data also highlight substantial differences in wealth at the top end of the income distribution. The median net wealth of top-quintile families in Vancouver, at $1,695,000, is 43% higher than among top-earning families in Toronto, and twice as high as top-income families in Montreal.
| All families | Lowest quintile |
Second quintile | Middle quintile |
Fourth quintile |
Highest quintile | |
|---|---|---|---|---|---|---|
| 2016 dollars | ||||||
| Survey reference year: 1999 | ||||||
| Montreal | 91,600 | 2,400 | 43,400Note E: Use with caution | 103,200 | 149,800Note E: Use with caution | 417,000 |
| Toronto | 165,300 | 6,900 | 60,800Note E: Use with caution | 148,700 | 236,900 | 540,100 |
| Vancouver | 151,100 | 9,700 | 31,100Note E: Use with caution | 147,900Note E: Use with caution | 257,200 | 531,200 |
| Canada | 144,500 | 7,900 | 71,700 | 145,700 | 219,900 | 446,700 |
| Survey reference year: 2016 | ||||||
| Montreal | 170,000 | 5,200 | 86,700Note E: Use with caution | 240,300 | 221,000Note E: Use with caution | 822,600 |
| Toronto | 365,100 | 9,000 | 123,000Note E: Use with caution | 257,000Note E: Use with caution | 702,300 | 1,184,700 |
| Vancouver | 434,400 | 19,300 | 135,000Note E: Use with caution | 507,500Note E: Use with caution | 629,100Note E: Use with caution | 1,695,000 |
| Canada | 295,100 | 11,000 | 156,300 | 304,100 | 459,900 | 1,034,800 |
|
E use with caution Notes: Some estimates should be interpreted with caution due to sampling error. Quintiles are based on after-tax family income. Source: Statistics Canada table 11-10-0057-01. |
||||||
Eight percent of Canadian families have less than $500 in net worth
The leverage and wealth estimates reported above highlight the extent to which many lower income families carry on average both higher debt loads and lower levels of net wealth. One means of estimating the extent to which some families may be particularly vulnerable to financial shocks is to identify those with extremely low levels of net worth—defined here as less than $500. For Canada as a whole, 8.4% of families and unattached individuals have less than $500 in wealth. Among families in the lowest and second lowest income quintiles, this figure rises to 19% and 12% respectively. Even among middle-quintile families, about 7% had wealth levels below this threshold.

Data table for Chart 7
| Income quintiles | percent |
|---|---|
| Lowest quintile | 18.6 |
| Second quintile | 12.2 |
| Middle quintile | 7.0 |
| Fourth quintile | 2.8 |
| Highest quintile | 1.2 |
| Total | 8.4 |
|
Notes: Income quintiles are calculated based on after-tax family income. Source: Special tabulations, Statistics Canada, Survey of Financial Security, 2016. |
|
Summary
The article examines financial conditions among Canadian households, focusing on recent trends related to indebtedness and net worth.
The aggregate data for the household sector underscore differences in perceived risk depending on whether levels of indebtedness are evaluated on a cash flow basis (against household income) or on a balance sheet basis (against household assets). While the accumulation of mortgage liabilities has increased debt to income levels, increases in the value of housing have strengthened the balance sheet, contributing substantially to the growth in household net worth.
Data from the SFS highlight the extent to which leverage and wealth vary across major urban centres. While family debt to income levels are elevated in Toronto and Vancouver, proportionately large increases in the value of housing in these cities have, at the same time, translated into notable increases in median net worth. Lower levels of indebtedness and wealth are apparent in Montreal.
The SFS data also highlight differences across the family income distribution in each of these cities. Debt to income ratios are much more pronounced among low income families in Vancouver and Toronto—families with comparatively low levels of wealth.
References
Houge, R. 2018. Focus on Canada’s Household Debt. RBC Economic Research, June 21, 2018.
Majumdar, R. 2018. Have US households adequately deleveraged? Deloitte Insights. Economic Spotlight, September 2018.
Statistics Canada. 2012. Financial indicators from the National Balance Sheet Accounts. Latest Developments in the Canadian Economic Accounts. Catalogue no. 13-605, no. 4. Ottawa: Statistics Canada.
- Date modified: