
Economic Insights
Long-run Productivity Dispersion in Canadian Manufacturing

Archived Content
Information identified as archived is provided for reference, research or recordkeeping purposes. It is not subject to the Government of Canada Web Standards and has not been altered or updated since it was archived. Please "contact us" to request a format other than those available.
by Wulong Gu and Beiling Yan, Economic Analysis Division, Statistics Canada,
and Sylvie Ratté, Business Development Bank of Canada
Skip to text
Text begins
This Economic Insights article examines the changes in productivity dispersion in Canadian manufacturing—that is, the difference between the productivity performance of the most productive plants (frontier plants) and the productivity performance of all remaining plants (non-frontier plants). It examines the relationship between changes in productivity dispersion, aggregate manufacturing productivity growth and exchange rate movements. This article finds that the difference in labour productivity levels between frontier and non-frontier plants in Canadian manufacturing has increased over the period from 1973 to 2015. The productivity growth performance of average frontier plants is similar to that of manufacturing overall except in the latest years (2009 to 2015). For the period from 2009 to 2015, the average labour productivity of frontier plants remained robust while aggregate manufacturing productivity growth was weak. Finally, the article finds that the changes in productivity dispersion are found to be strongly correlated with exchange rate movements.
Introduction
Productivity growth has slowed in many developed countries since 2000. A particularly striking feature of this slowdown is robust labour productivity growth among the world’s most productive firms and an increasing productivity gap between those firms and all others (OECD 2015). Emerging evidence from official microdata—currently available for sixteen countries of the Organisation for Economic Co-operation and Development (OECD) including Canada—also points to a divergence in productivity growth between the most productive and least productive firms within those countries (OECD 2016; Berlingieri, Blanchenay and Criscuolo 2017).
This article presents estimates of plant-level productivity dispersion in the Canadian manufacturing sector for the period from 1973 to 2015. This time frame, longer than that of the OECD studies, makes it possible to examine how productivity dispersion has changed over periods of both strong and weak aggregate manufacturing productivity growth.
Divergence in labour productivity between frontier and non-frontier plants since 1973
The labour productivity estimates reported in this article are based on Statistics Canada’s Annual Survey of Manufactures (ASM) for the period from 1973 to 2012 and National Accounts Longitudinal Microdata File (NALMF) for the period from 2010 to 2015.Note 1 Labour productivity at a production unit is measured as real value-added per worker, where real value-added is nominal value-added deflated by an industry value-added deflator at the North American Industry Classification System (NAICS) three-digit level.Note 2 While the production unit represents a plant in the ASM and a firm in the NALMF, it will be called a plant in this article. Frontier plants in a particular year are defined as those in the top decile in terms of productivity levels that year.Note 3 The remaining plants are classified as non-frontier plants. The productivity estimates from the ASM and NALMF databases show a similar trend for the years 2000 to 2012 when both databases are available. They are linked to derive the long-run productivity trend for the period from 1973 to 2015.
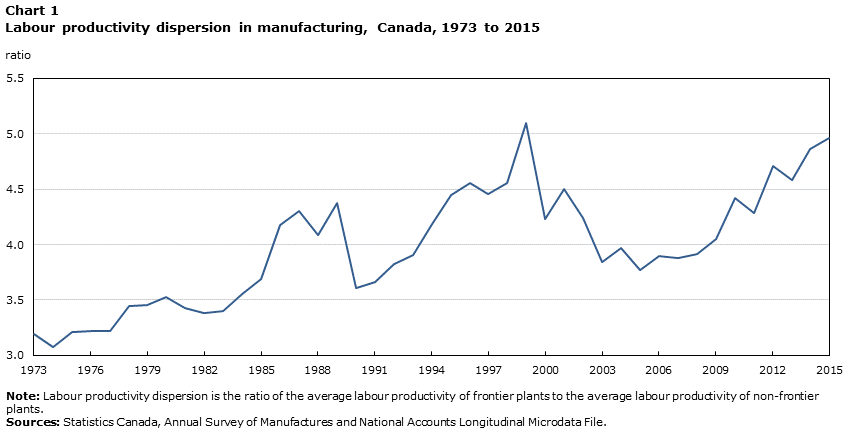
Chart 1 presents the productivity difference between the average labour productivity of frontier plants and the average labour productivity of non-frontier plants.Note 4 This difference, the productivity dispersion, increased over the 1973-to-2015 period. In 1973, the average labour productivity of frontier plants had a value-added per worker that was 3.2 times that of non-frontier plants. This advantage grew to 3.6 times by 1990, and 5.0 times by 2015. In Canada, this increasing productivity divergence between frontier and non-frontier plants is not limited to the post-2000 period. Rather, it reflects a long-run trend that began as early as 1973.Note 5
Data table for Chart 1
| Year | Labour productivity dispersion |
|---|---|
| ratio | |
| 1973 | 3.2 |
| 1974 | 3.1 |
| 1975 | 3.2 |
| 1976 | 3.2 |
| 1977 | 3.2 |
| 1978 | 3.4 |
| 1979 | 3.5 |
| 1980 | 3.5 |
| 1981 | 3.4 |
| 1982 | 3.4 |
| 1983 | 3.4 |
| 1984 | 3.6 |
| 1985 | 3.7 |
| 1986 | 4.2 |
| 1987 | 4.3 |
| 1988 | 4.1 |
| 1989 | 4.4 |
| 1990 | 3.6 |
| 1991 | 3.7 |
| 1992 | 3.8 |
| 1993 | 3.9 |
| 1994 | 4.2 |
| 1995 | 4.5 |
| 1996 | 4.6 |
| 1997 | 4.5 |
| 1998 | 4.6 |
| 1999 | 5.1 |
| 2000 | 4.2 |
| 2001 | 4.5 |
| 2002 | 4.2 |
| 2003 | 3.8 |
| 2004 | 4.0 |
| 2005 | 3.8 |
| 2006 | 3.9 |
| 2007 | 3.9 |
| 2008 | 3.9 |
| 2009 | 4.1 |
| 2010 | 4.4 |
| 2011 | 4.3 |
| 2012 | 4.7 |
| 2013 | 4.6 |
| 2014 | 4.9 |
| 2015 | 5.0 |
|
Note: Labour productivity dispersion is the ratio of the average labour productivity of frontier plants to the average labour productivity of non-frontier plants. Sources: Statistics Canada, Annual Survey of Manufactures and National Accounts Longitudinal Microdata File. |
|
The observed productivity divergence is related to the difference in the characteristics of the frontier and non-frontier plants (see Table 1). Compared with non-frontier plants, frontier plants more often exhibit the characteristics associated with faster productivity growth. Specifically, frontier plants are more likely to conduct in-house research and development (R&D) or purchase R&D, and are more likely to export and to belong to a foreign multinational.
| Non-frontier plants | Frontier plants |
Ratio of frontier plants to non-frontier plants | |
|---|---|---|---|
| thousands of constant dollars per worker | ratio | ||
| Labour productivity | 77 | 291 | 3.79 |
| percent | ratio | ||
| Exporter | 0.52 | 0.62 | 1.19 |
| Foreign multinational | 0.07 | 0.24 | 3.27 |
| Scientific research and development status | |||
| Purchases research and development | 0.13 | 0.23 | 1.72 |
| Conduct in-house research and development | 0.25 | 0.35 | 1.38 |
|
Note: For more details, see J.R. Baldwin, A. Dar-Brodeur and B. Yan, 2016, Innovation and Export-market Participation in Canadian Manufacturing, as well as J.R. Baldwin and J. Li, 2017, The Changing Importance of Foreign Control in Canadian Manufacturing. Source: Statistics Canada, authors' tabulation from the Annual Survey of Manufactures linked to other business microdata databases. |
|||
However, the long-term productivity divergence was interspersed with periods (1986 to 1990 and 1999 to 2006) where the productivity difference between frontier and non-frontier plants narrowed. The next sections examine whether the pattern of convergence and divergence is related to aggregate manufacturing labour productivity growth, and whether the average labour productivity of frontier plants remained robust during periods of weakness in aggregate manufacturing productivity growth.
Productivity dispersion and aggregate manufacturing productivity growth
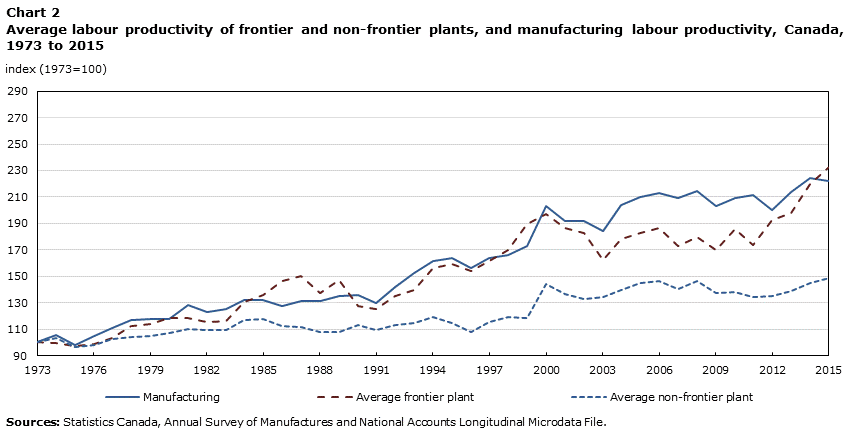
Chart 2 presents the average labour productivity of frontier and non-frontier plants, and manufacturing labour productivity for the period from 1973 to 2015. The productivity performance of average frontier plants is similar to that of manufacturing overall except in the early 2000s and in the period 2009 to 2015.
In the early 2000s and in the latest years (2009 to 2015), the productivity performance of average frontier plants diverged from that of the manufacturing sector overall. For the period 2000 to 2003, the productivity growth of the frontier plants was much lower than that of the non-frontier plants and the manufacturing sector overall. This is due to the deterioration in the productivity performance of foreign-controlled and exporting plants compared with that of the other plants in that period (Baldwin, Gu and Yan 2011).
For the 2009-to-2015 period, the average labour productivity growth of frontier plants was robust (5.4% per year) while the average labour productivity growth of non-frontier plants and the total manufacturing sector was weak. Labour productivity increased 1.3% per year in non-frontier plants and it rose 1.5% per year in the total manufacturing sector.
Data table for Chart 2
| Year | Manufacturing | Average frontier plant | Average non-frontier plant |
|---|---|---|---|
| index (1973=100) | |||
| 1973 | 100 | 100 | 100 |
| 1974 | 106 | 100 | 104 |
| 1975 | 98 | 97 | 97 |
| 1976 | 105 | 99 | 98 |
| 1977 | 111 | 103 | 102 |
| 1978 | 117 | 112 | 104 |
| 1979 | 118 | 114 | 105 |
| 1980 | 118 | 118 | 107 |
| 1981 | 128 | 118 | 110 |
| 1982 | 123 | 116 | 109 |
| 1983 | 125 | 116 | 109 |
| 1984 | 132 | 130 | 117 |
| 1985 | 132 | 136 | 118 |
| 1986 | 128 | 147 | 112 |
| 1987 | 131 | 150 | 111 |
| 1988 | 131 | 137 | 107 |
| 1989 | 135 | 148 | 108 |
| 1990 | 136 | 127 | 113 |
| 1991 | 130 | 125 | 109 |
| 1992 | 142 | 135 | 113 |
| 1993 | 152 | 140 | 114 |
| 1994 | 162 | 156 | 120 |
| 1995 | 164 | 159 | 114 |
| 1996 | 156 | 154 | 108 |
| 1997 | 164 | 162 | 116 |
| 1998 | 166 | 170 | 119 |
| 1999 | 173 | 189 | 119 |
| 2000 | 203 | 197 | 144 |
| 2001 | 192 | 186 | 137 |
| 2002 | 191 | 182 | 133 |
| 2003 | 185 | 162 | 134 |
| 2004 | 204 | 178 | 139 |
| 2005 | 210 | 183 | 145 |
| 2006 | 213 | 187 | 147 |
| 2007 | 210 | 173 | 141 |
| 2008 | 214 | 180 | 146 |
| 2009 | 203 | 170 | 138 |
| 2010 | 209 | 186 | 138 |
| 2011 | 212 | 173 | 135 |
| 2012 | 200 | 193 | 135 |
| 2013 | 214 | 198 | 139 |
| 2014 | 225 | 220 | 145 |
| 2015 | 222 | 233 | 148 |
| Sources: Statistics Canada, Annual Survey of Manufactures and National Accounts Longitudinal Microdata File. | |||
OECD (2015, 2016) and Andrews, Criscuolo and Gal (2016), explain that the 2000s were a unique period marked by digitalization, the increasing complexity of technologies, and the rising importance of tacit knowledge. Andrews, Criscuolo and Gal (2016) argue that digitalization has enabled the development of a winner-take-all dynamic (see Brynjolfsson and McAfee 2011) where technology leaders can capture most of the market share because they can replicate their provision of information goods and business processes at a low cost around the globe.
Also relevant for firms in the manufacturing sector are the increasingly complex technologies that need to be tacitly combined with complementary investments in intangibles, such as innovative property and economic competencies (Baldwin, Gu and Macdonald 2012), for the technologies to be successfully introduced into the production process. The growing importance of tacit knowledge may inhibit technology diffusion from technology leaders to other firms in the economy, and may also act as a barrier to entry into the market. This slows the introduction of innovative ideas into the economy by new firms, which conditional on survival would experience faster productivity growth than incumbents on average (Liu and Tang 2017), reinforcing the lower productivity growth among non-frontier plants.
Productivity dispersion and exchange rate movements
The factors behind the relationship between the changes in productivity dispersion and manufacturing labour productivity growth remain to be explored. Chart 2 indicates that the short-term changes in productivity dispersion are driven mainly by changes in the labour productivity of frontier plants. These plants have more international exposure either because they are more likely to export or because they are more likely to be part of a foreign multinational.
Data table for Chart 3
| Year | Productivity dispersion | Canada–United States nominal exchange rate |
|---|---|---|
| index (1973=100) | ||
| 1973 | 100 | 100 |
| 1974 | 96 | 98 |
| 1975 | 100 | 102 |
| 1976 | 101 | 99 |
| 1977 | 101 | 106 |
| 1978 | 108 | 114 |
| 1979 | 108 | 117 |
| 1980 | 110 | 117 |
| 1981 | 107 | 120 |
| 1982 | 106 | 123 |
| 1983 | 107 | 123 |
| 1984 | 111 | 129 |
| 1985 | 115 | 137 |
| 1986 | 131 | 139 |
| 1987 | 135 | 133 |
| 1988 | 128 | 123 |
| 1989 | 137 | 118 |
| 1990 | 113 | 117 |
| 1991 | 115 | 115 |
| 1992 | 120 | 121 |
| 1993 | 122 | 129 |
| 1994 | 131 | 137 |
| 1995 | 139 | 137 |
| 1996 | 143 | 136 |
| 1997 | 140 | 138 |
| 1998 | 142 | 148 |
| 1999 | 160 | 149 |
| 2000 | 132 | 149 |
| 2001 | 141 | 155 |
| 2002 | 133 | 157 |
| 2003 | 120 | 140 |
| 2004 | 124 | 130 |
| 2005 | 118 | 121 |
| 2006 | 122 | 113 |
| 2007 | 121 | 107 |
| 2008 | 122 | 107 |
| 2009 | 127 | 114 |
| 2010 | 138 | 103 |
| 2011 | 134 | 99 |
| 2012 | 147 | 100 |
| 2013 | 143 | 103 |
| 2014 | 152 | 110 |
| 2015 | 155 | 128 |
|
Note: Labour productivity dispersion is the ratio of the average labour productivity of frontier plants to the average labour productivity of non-frontier plants. Sources: Statistics Canada, Annual Survey of Manufactures and National Accounts Longitudinal Microdata File. |
||
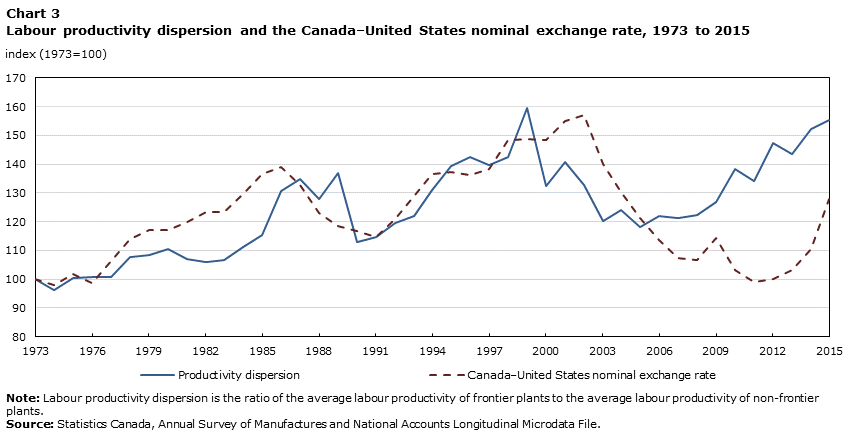
Chart 3 shows that before 2009, the productivity gap between the frontier and non-frontier plants was found to be correlated with movements in the nominal exchange rate. The periods in which the average labour productivity of frontier plants grew strongly and productivity dispersion increased—1973 to 1986 and 1990 to 1999—were also marked by a depreciating exchange rate. The periods in which productivity dispersion narrowed—1986 to 1990 and 1999 to 2006—also had an appreciating exchange rate and a weak average labour productivity for frontier plants.
After 2009, the productivity gap between the frontier and non-frontier plants was not correlated with movements in the Canada-United States exchange rate. The gap increased despite large swings in the exchange rate in that period.
A possible explanation for the correlation between short-run changes in the productivity dispersion and the exchange rate is the pricing-to-market behaviour (see Krugman 1987) of frontier plants, which are more likely to be exporters. In the pricing-to-market framework, exporters charge different prices for the same good sold in the domestic and export markets. When examining the pricing behaviour of Canadian exporters, Schembri (1989) found that when the Canadian dollar depreciated, Canadian exporters largely maintained their U.S.-dollar prices, thus increasing the Canadian price they received. Baldwin and Yan (2007) also found that Canadian-dollar output prices of export-intensive manufacturing industries were more affected by fluctuations in the exchange rate. This is consistent with Canadian exports being priced closely to the U.S. market, and with exporters adjusting to the changing competitive pressures from exchange rate movements by squeezing or swelling their profit margins and changing their price-cost markups. A depreciation in the exchange rate leads to an increase in the price received by frontier plants (which are more likely to be exporters) relative to non-frontier plants (which are less likely to be exporters). Because a common price deflator is used to calculate the labour productivity for both frontier plants and non-frontier plants in the same industry, this gives rise to an increase in labour productivity dispersion between frontier and non-frontier plants.
Conclusion
This article finds that the difference in labour productivity levels between frontier and non-frontier plants in Canadian manufacturing has grown over the period from 1973 to 2015. This increasing productivity dispersion in recent years is consistent with findings from other member countries of the Organisation for Economic Co-operation and Development. In these countries, slow aggregate labour productivity growth is accompanied by robust labour productivity growth in firms at the frontier, and by a widening productivity gap between frontier and non-frontier firms. The specific factors behind these developments in Canada remain to be determined and are the subject of future research. However, other international studies suggest that digitalization, complex technologies and the rising importance of intangibles may have led to slower technology diffusion from frontier to non-frontier firms, as well as higher barriers to entry that impede the introduction of innovations by non-frontier firms.
The changes in productivity dispersion are found to be strongly correlated with exchange rate movements and likely reflect the pricing-to-market behaviour of frontier plants, which are more likely to export than non-frontier plants.
References
Andrews, D., C. Criscuolo, and P.N. Gal. 2016. The Best Versus the Rest: The Global Productivity Slowdown, Divergence Across Firms and the Role of Public Policy. OECD Productivity Working Paper, no. 5. Paris: Organisation for Economic Co-operation and Development (OECD).
Baldwin, J.R., A. Dar-Brodeur, and B. Yan. 2016. Innovation and Export-market Participation in Canadian Manufacturing. Analytical Studies Branch Research Paper Series, no. 386. Statistics Canada Catalogue no. 11F0019M. Ottawa: Statistics Canada.
Baldwin, J.R., W. Gu, and R. Macdonald. 2012. Intangible Capital and Productivity Growth in Canada. The Canadian Productivity Review, no. 29. Statistics Canada Catalogue no. 15-206-X. Ottawa: Statistics Canada.
Baldwin, J.R., W. Gu and B. Yan. 2011. Export Growth, Capacity Utilization and Productivity Growth: Evidence from Canadian Manufacturing Plants. Economic Analysis Research Paper Series, no. 75. Statistics Canada Catalogue no. 11F0027M. Ottawa: Statistics Canada.
Baldwin, J.R., and J. Li. 2017. The Changing Importance of Foreign Control in Canadian Manufacturing. Analytical Studies Branch Research Paper Series, no. 387. Statistics Canada Catalogue no. 11F0019M. Ottawa: Statistics Canada.
Baldwin, J.R., and B. Yan. 2007. “Exchange rate cycles and Canada/US manufacturing prices.” Review of World Economics 143 (3): 508–533.
Berlingieri, G., P. Blanchenay, and C. Criscuolo. 2017. The Great Divergence(s). OECD Science, Technology and Innovation Policy Papers, no. 39. Paris: OECD Publishing.
Brynjolfsson, E., and A. McAfee. 2011. Race Against the Machine: How the Digital Revolution Is Accelerating Innovation, Driving Productivity, and Irreversibly Transforming Employment and the Economy.Lexington, Massachusetts: Digital Frontier Press.
Krugman, P.R. 1987. “Pricing to market when the exchange rate changes.” In Real-Financial Linkages among Open Economies, ed. S.W. Arndt and J.D. Richardson. Cambridge, Massachusetts: MIT Press Books.
Liu, H., and J. Tang. 2017. “Age-productivity profiles of entrants and exits: Evidence from Canadian manufacturing.” Structural Change and Economic Dynamics 40: 26–36.
OECD (Organisation for Economic Co-operation and Development). 2015. The Future of Productivity. Paris: OECD Publishing.
OECD (Organisation for Economic Co-operation and Development). 2016. The Productivity-Inclusiveness Nexus: Preliminary Version. Paris: OECD Publishing.
Rollin, A.M. 2014. “Developing a Longitudinal Structure for the National Accounts Longitudinal Microdata File (NALMF).” In Proceedings – Symposium 2013: Producing Reliable Estimates from Imperfect Frames, Ottawa, Canada, October 16–18, 2013. Statistics Canada Catalogue no. 11-522-X. Ottawa: Statistics Canada.
Schembri, L.L. 1989. “Exchange rates and export prices: An industry approach.” In Trade Policy for International Competitiveness, ed. R.C. Feenstra. Chicago: University of Chicago Press.
- Date modified: