
Economic Insights
Recent Developments in the Canadian Economy: Spring 2016

Archived Content
Information identified as archived is provided for reference, research or recordkeeping purposes. It is not subject to the Government of Canada Web Standards and has not been altered or updated since it was archived. Please "contact us" to request a format other than those available.
by Guy Gellatly, Analytical Studies Branch
Start of text box
This article in the Economic Insights series provides users with an integrated summary of recent changes in output, employment, household demand, international trade and prices. Organized as a statistical summary of major indicators, the report is designed to inform about recent developments in the Canadian economy, highlighting major changes in the economic data during late 2015 and early 2016. Unless otherwise noted, the tabulations presented in this report are based on seasonally adjusted data available in CANSIM on May 10, 2016.
End of text box
Overview
The economy strengthened during the second half of 2015 as household spending and exports supported growth. However, business investment continued to weigh on growth as outlays on non-residential structures, machinery and equipment and intellectual property declined. The output of goods industries strengthened towards year end as oil and gas extraction and manufacturing advanced. Non-conventional oil producers increased production in late 2015 as the volume of energy exports increased into the new year. Similarly, automotive manufacturers expanded output in late 2015 as exports of motor vehicles and parts advanced.
Lower energy prices reduced the value of export sales during the second half of 2015. Canada’s annual energy exports, measured in current dollars, were $44.8 billion lower in 2015 than in 2014.
Employment gains were modest in the second half of 2015 as the growth in full-time work slowed. Employment increased in health care and social assistance industries and in professional, scientific and technical industries. Employment in manufacturing edged up late in the year.
Economic activity in Alberta moderated in the second half of 2015 as the economy continued to adjust to lower oil prices. Retail sales, wholesale sales, and manufacturing shipments in Alberta all trended lower. Employment in resource industries contracted. Unemployment rose during the second half of the year as average weekly earnings, measured year-over-year, declined.
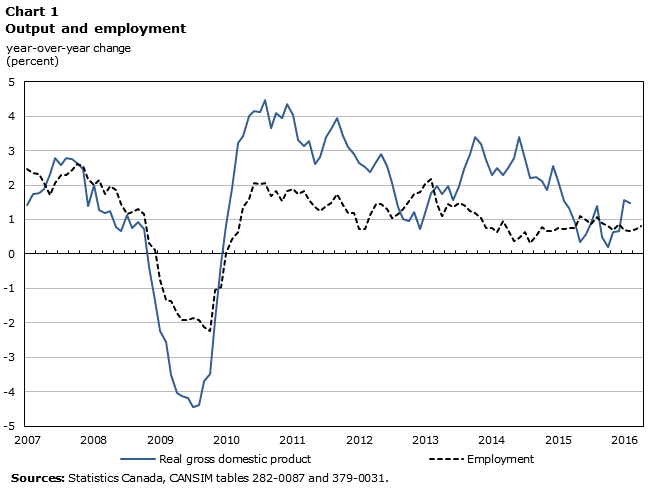
At the national level, output growth began to outpace employment growth in the second half of 2015 as production in the goods sector advanced.
Description for Chart 1
| Real gross domestic product | Employment | |
|---|---|---|
| January 2007 | 1.4 | 2.5 |
| February 2007 | 1.7 | 2.4 |
| March 2007 | 1.8 | 2.3 |
| April 2007 | 1.9 | 2.1 |
| May 2007 | 2.3 | 1.7 |
| June 2007 | 2.8 | 2.0 |
| July 2007 | 2.6 | 2.3 |
| August 2007 | 2.8 | 2.3 |
| September 2007 | 2.7 | 2.4 |
| October 2007 | 2.6 | 2.6 |
| November 2007 | 2.5 | 2.5 |
| December 2007 | 1.4 | 2.2 |
| January 2008 | 2.0 | 2.0 |
| February 2008 | 1.3 | 2.1 |
| March 2008 | 1.2 | 1.8 |
| April 2008 | 1.2 | 2.0 |
| May 2008 | 0.8 | 1.8 |
| June 2008 | 0.7 | 1.5 |
| July 2008 | 1.1 | 1.1 |
| August 2008 | 0.7 | 1.2 |
| September 2008 | 0.9 | 1.3 |
| October 2008 | 0.7 | 1.1 |
| November 2008 | -0.4 | 0.3 |
| December 2008 | -1.4 | 0.1 |
| January 2009 | -2.2 | -0.8 |
| February 2009 | -2.6 | -1.3 |
| March 2009 | -3.5 | -1.4 |
| April 2009 | -4.0 | -1.7 |
| May 2009 | -4.1 | -1.9 |
| June 2009 | -4.2 | -1.9 |
| July 2009 | -4.4 | -1.9 |
| August 2009 | -4.4 | -1.9 |
| September 2009 | -3.7 | -2.1 |
| October 2009 | -3.5 | -2.2 |
| November 2009 | -1.9 | -1.1 |
| December 2009 | -0.3 | -1.0 |
| January 2010 | 0.8 | 0.0 |
| February 2010 | 1.9 | 0.4 |
| March 2010 | 3.2 | 0.6 |
| April 2010 | 3.4 | 1.3 |
| May 2010 | 4.0 | 1.6 |
| June 2010 | 4.1 | 2.1 |
| July 2010 | 4.1 | 2.0 |
| August 2010 | 4.5 | 2.1 |
| September 2010 | 3.7 | 1.7 |
| October 2010 | 4.1 | 1.8 |
| November 2010 | 3.9 | 1.5 |
| December 2010 | 4.4 | 1.8 |
| January 2011 | 4.0 | 1.9 |
| February 2011 | 3.3 | 1.8 |
| March 2011 | 3.1 | 1.8 |
| April 2011 | 3.3 | 1.6 |
| May 2011 | 2.6 | 1.4 |
| June 2011 | 2.8 | 1.2 |
| July 2011 | 3.4 | 1.4 |
| August 2011 | 3.6 | 1.5 |
| September 2011 | 3.9 | 1.7 |
| October 2011 | 3.4 | 1.4 |
| November 2011 | 3.1 | 1.2 |
| December 2011 | 2.9 | 1.2 |
| January 2012 | 2.6 | 0.7 |
| February 2012 | 2.5 | 0.7 |
| March 2012 | 2.4 | 1.1 |
| April 2012 | 2.7 | 1.5 |
| May 2012 | 2.9 | 1.4 |
| June 2012 | 2.6 | 1.3 |
| July 2012 | 2.1 | 1.0 |
| August 2012 | 1.4 | 1.2 |
| September 2012 | 1.0 | 1.3 |
| October 2012 | 1.0 | 1.5 |
| November 2012 | 1.2 | 1.7 |
| December 2012 | 0.7 | 1.8 |
| January 2013 | 1.2 | 2.0 |
| February 2013 | 1.8 | 2.2 |
| March 2013 | 2.0 | 1.5 |
| April 2013 | 1.7 | 1.1 |
| May 2013 | 2.0 | 1.5 |
| June 2013 | 1.6 | 1.4 |
| July 2013 | 2.0 | 1.5 |
| August 2013 | 2.5 | 1.4 |
| September 2013 | 2.9 | 1.2 |
| October 2013 | 3.4 | 1.2 |
| November 2013 | 3.2 | 1.0 |
| December 2013 | 2.7 | 0.7 |
| January 2014 | 2.3 | 0.7 |
| February 2014 | 2.5 | 0.6 |
| March 2014 | 2.3 | 1.0 |
| April 2014 | 2.5 | 0.7 |
| May 2014 | 2.8 | 0.4 |
| June 2014 | 3.4 | 0.5 |
| July 2014 | 2.8 | 0.6 |
| August 2014 | 2.2 | 0.3 |
| September 2014 | 2.2 | 0.5 |
| October 2014 | 2.1 | 0.8 |
| November 2014 | 1.8 | 0.7 |
| December 2014 | 2.5 | 0.7 |
| January 2015 | 2.1 | 0.7 |
| February 2015 | 1.5 | 0.7 |
| March 2015 | 1.3 | 0.8 |
| April 2015 | 0.9 | 0.7 |
| May 2015 | 0.3 | 1.1 |
| June 2015 | 0.6 | 1.0 |
| July 2015 | 0.9 | 0.9 |
| August 2015 | 1.4 | 1.1 |
| September 2015 | 0.5 | 0.9 |
| October 2015 | 0.2 | 0.8 |
| November 2015 | 0.6 | 0.7 |
| December 2015 | 0.7 | 0.9 |
| January 2016 | 1.6 | 0.7 |
| February 2016 | 1.5 | 0.7 |
| March 2016 | 0.7 | |
| April 2016 | 0.8 |
Consumer spending and exports supported growth in the second half of 2015
Output strengthened during the second half of 2015 as the economy rebounded from two consecutive quarterly declines. Real GDP increased 0.2% in the fourth quarter, following a 0.6% gain in the third. For 2015 as a whole, the economy grew 1.2%, about half the pace of growth in 2014.
Consumer spending continued to support growth in the second half, but moderated late in the year. Household final expenditures rose 0.2% in the fourth quarter, down from 0.5% in the third, as durable spending on autos slowed. Expenditures on housing, furnishings and audio-visual equipment increased in the fourth quarter. For 2015 as a whole, household expenditures increased 1.9%, down from 2.6% in 2014. Annual expenditures on durables, supported by higher auto sales, rose 3.3%.
Export volumes contributed positively to GDP growth in the third quarter (+2.6%), but contracted late in the year (-0.6%) as energy exports declined. In contrast, exports of motor vehicles and parts, metals and non-metallic minerals, and forestry products advanced towards year end. Exports of consumer goods edged down in the fourth quarter, after a notable third-quarter gain. For 2015 as a whole, export volumes increased by 3.0%, down from an increase of 5.3% in 2014.

Description for Chart 2
| Household expenditure | Government current expenditure | Non-residential business investment | Goods exports | Housing | |
|---|---|---|---|---|---|
| first quarter 2007 | 100.0 | 100.0 | 100.0 | 100.0 | 100.0 |
| second quarter 2007 | 101.5 | 100.5 | 100.5 | 101.6 | 100.6 |
| third quarter 2007 | 102.4 | 101.9 | 100.9 | 99.7 | 100.3 |
| fourth quarter 2007 | 104.3 | 101.9 | 102.7 | 96.9 | 100.7 |
| first quarter 2008 | 105.1 | 102.8 | 106.4 | 95.5 | 99.5 |
| second quarter 2008 | 105.2 | 105.1 | 106.6 | 96.3 | 97.2 |
| third quarter 2008 | 105.3 | 105.0 | 106.6 | 95.2 | 95.0 |
| fourth quarter 2008 | 104.0 | 106.5 | 101.3 | 89.9 | 89.5 |
| first quarter 2009 | 103.7 | 106.6 | 85.7 | 81.4 | 83.7 |
| second quarter 2009 | 104.5 | 107.4 | 82.1 | 77.3 | 86.7 |
| third quarter 2009 | 105.7 | 108.0 | 82.8 | 80.1 | 90.2 |
| fourth quarter 2009 | 106.4 | 108.8 | 85.2 | 82.1 | 95.8 |
| first quarter 2010 | 107.6 | 109.8 | 89.8 | 84.0 | 98.5 |
| second quarter 2010 | 108.5 | 109.7 | 94.1 | 87.3 | 97.3 |
| third quarter 2010 | 109.4 | 110.1 | 97.6 | 87.1 | 95.5 |
| fourth quarter 2010 | 110.4 | 110.8 | 102.5 | 89.5 | 94.8 |
| first quarter 2011 | 110.6 | 110.9 | 105.4 | 89.8 | 96.8 |
| second quarter 2011 | 111.1 | 111.4 | 108.0 | 87.7 | 96.6 |
| third quarter 2011 | 111.5 | 111.8 | 108.4 | 93.3 | 99.1 |
| fourth quarter 2011 | 112.2 | 112.1 | 111.5 | 94.5 | 100.1 |
| first quarter 2012 | 112.9 | 112.2 | 114.2 | 94.1 | 104.4 |
| second quarter 2012 | 113.0 | 111.9 | 117.8 | 93.9 | 103.9 |
| third quarter 2012 | 113.7 | 112.7 | 118.1 | 93.2 | 103.1 |
| fourth quarter 2012 | 114.3 | 112.6 | 120.6 | 93.1 | 103.0 |
| first quarter 2013 | 114.9 | 112.7 | 120.9 | 95.6 | 102.3 |
| second quarter 2013 | 115.8 | 112.2 | 120.8 | 96.5 | 104.0 |
| third quarter 2013 | 116.7 | 112.7 | 120.8 | 96.0 | 103.6 |
| fourth quarter 2013 | 117.4 | 113.1 | 119.9 | 97.6 | 103.1 |
| first quarter 2014 | 117.7 | 113.0 | 119.4 | 96.9 | 102.7 |
| second quarter 2014 | 118.9 | 113.2 | 120.1 | 102.3 | 105.1 |
| third quarter 2014 | 119.8 | 113.0 | 121.4 | 104.4 | 107.7 |
| fourth quarter 2014 | 120.5 | 112.9 | 121.7 | 104.1 | 107.6 |
| first quarter 2015 | 120.7 | 114.0 | 115.3 | 103.8 | 109.1 |
| second quarter 2015 | 121.3 | 114.7 | 111.3 | 104.0 | 109.5 |
| third quarter 2015 | 121.9 | 114.7 | 108.4 | 107.1 | 110.2 |
| fourth quarter 2015 | 122.2 | 115.1 | 104.9 | 106.5 | 110.7 |
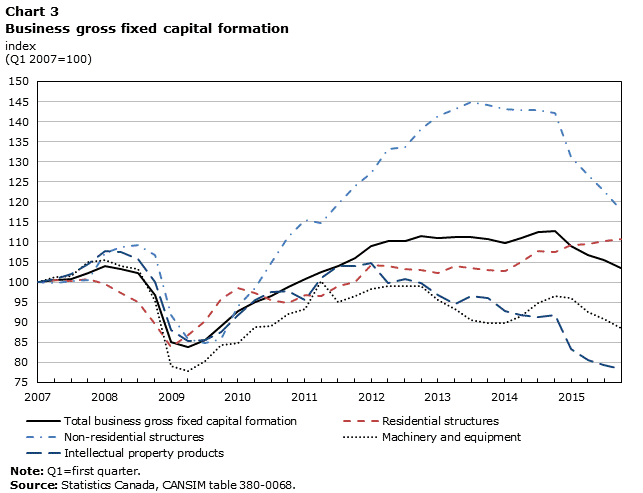
Business investment continued to contract in late 2015
Non-residential business investment continued to decline in the second half of 2015. Outlays on non-residential structures and machinery and equipment (M&E) contracted 3.3% in the fourth quarter, following a 2.6% decline in the third. Lower outlays on non-residential structures reflected declines in both engineering structures and non-residential buildings. Capital outlays on engineering structures have declined for nine consecutive quarters.
Business investment in M&E contracted 2.3% in the fourth quarter, following a 1.9% decline in the third. Reduced outlays on autos, computer equipment and communications equipment contributed to lower M&E spending late in the year. Investments in intellectual property continued to decline during the second half of the year on lower outlays on mineral exploration and evaluation. Measured year-over-year, investment spending on mineral exploration and evaluation was 50% lower than in the fourth quarter of 2014.
Capital spending on residential structures moderated the overall decline in business investment. Outlays on housing rose 0.4% in the fourth quarter, the fourth consecutive quarterly increase. Renovations and ownership transfer costs, which reflect activity in resale markets, supported growth late in 2015, offsetting lower spending on new construction. For 2015 as a whole, business investment in housing increased 3.9%, up from 2.5% in 2014.
Description for Chart 3
| Total business gross fixed capital formation | Residential structures | Non-residential structures | Machinery and equipment | Intellectual property products | |
|---|---|---|---|---|---|
| first quarter 2007 | 100.0 | 100.0 | 100.0 | 100.0 | 100.0 |
| second quarter 2007 | 100.6 | 100.6 | 99.8 | 101.3 | 100.7 |
| third quarter 2007 | 100.8 | 100.3 | 100.2 | 101.6 | 102.1 |
| fourth quarter 2007 | 102.1 | 100.7 | 100.5 | 105.0 | 104.5 |
| first quarter 2008 | 104.0 | 99.5 | 107.2 | 105.4 | 107.6 |
| second quarter 2008 | 103.3 | 97.2 | 108.7 | 104.1 | 107.6 |
| third quarter 2008 | 102.2 | 95.0 | 109.3 | 103.3 | 105.8 |
| fourth quarter 2008 | 96.8 | 89.5 | 106.6 | 95.3 | 100.1 |
| first quarter 2009 | 85.1 | 83.7 | 91.8 | 79.1 | 88.0 |
| second quarter 2009 | 83.9 | 86.7 | 85.7 | 77.9 | 85.4 |
| third quarter 2009 | 85.5 | 90.2 | 84.9 | 80.3 | 85.6 |
| fourth quarter 2009 | 89.0 | 95.8 | 85.7 | 84.3 | 87.7 |
| first quarter 2010 | 92.9 | 98.5 | 93.9 | 84.9 | 91.8 |
| second quarter 2010 | 95.1 | 97.3 | 98.6 | 88.8 | 95.6 |
| third quarter 2010 | 96.5 | 95.5 | 104.7 | 89.2 | 97.6 |
| fourth quarter 2010 | 98.8 | 94.8 | 111.2 | 92.1 | 97.7 |
| first quarter 2011 | 100.7 | 96.8 | 115.5 | 93.3 | 95.6 |
| second quarter 2011 | 102.6 | 96.6 | 114.6 | 100.2 | 101.0 |
| third quarter 2011 | 104.1 | 99.1 | 119.5 | 95.0 | 104.0 |
| fourth quarter 2011 | 106.1 | 100.1 | 124.0 | 96.5 | 104.1 |
| first quarter 2012 | 109.1 | 104.4 | 127.3 | 98.3 | 104.7 |
| second quarter 2012 | 110.3 | 103.9 | 133.1 | 99.1 | 99.8 |
| third quarter 2012 | 110.2 | 103.1 | 133.7 | 99.0 | 100.7 |
| fourth quarter 2012 | 111.4 | 103.0 | 138.1 | 99.1 | 99.7 |
| first quarter 2013 | 110.9 | 102.3 | 141.5 | 95.5 | 96.7 |
| second quarter 2013 | 111.3 | 104.0 | 143.0 | 93.2 | 94.5 |
| third quarter 2013 | 111.3 | 103.6 | 144.9 | 90.7 | 96.5 |
| fourth quarter 2013 | 110.7 | 103.1 | 144.1 | 89.8 | 96.1 |
| first quarter 2014 | 109.9 | 102.7 | 143.2 | 89.8 | 92.7 |
| second quarter 2014 | 111.0 | 105.1 | 142.9 | 91.7 | 91.8 |
| third quarter 2014 | 112.6 | 107.7 | 142.9 | 94.8 | 91.2 |
| fourth quarter 2014 | 112.7 | 107.6 | 142.1 | 96.5 | 91.8 |
| first quarter 2015 | 109.0 | 109.1 | 131.1 | 96.0 | 83.3 |
| second quarter 2015 | 106.8 | 109.5 | 126.7 | 92.5 | 80.6 |
| third quarter 2015 | 105.4 | 110.2 | 122.8 | 90.8 | 79.2 |
| fourth quarter 2015 | 103.6 | 110.7 | 118.0 | 88.7 | 78.3 |
Business sector labour productivity improved in the second half of 2015 after two consecutive quarterly declines. Labour productivity edged up (+0.1%) in the fourth quarter, following a 0.4% increase in the third. Productivity increased in mining and oil and gas extraction industries in both quarters as hours worked contracted. Manufacturing productivity also edged up in the second half of the year following declines in the first.
In the United States, real GDP slowed to 1.4% (annualized) in the fourth quarter of 2015, down from 2.0% in the third. For 2015 as a whole, U.S. real GDP increased by 2.4%, compared to 1.2% in Canada.
Oil and gas capital intentions down 26 percent
Oil and gas extraction industries anticipate spending 26.3% less on capital assets in 2016 as intentions for both structures and machinery and equipment declined. Anticipated capital outlays in oil and gas extraction amount to $36.5 billion in 2016, down from preliminary annual expenditures of $49.5 billion in 2015, and annual capital expenditures of $76.1 billion in 2014. In Alberta, oil and gas extraction industries anticipate spending $26.5 billion on capital assets in 2016, down 27.1% from preliminary actual outlays in 2015, and 54.4% from capital outlays in 2014.
Capital spending in manufacturing industries is anticipated to decline by 10.9% in 2016, following increases in the previous two years. Manufacturers in Quebec anticipate higher capital outlays in 2016, while outlays by Ontario manufacturers are anticipated to decline.
Overall, private and public organizations anticipate spending 4.4% less on non-residential construction and machinery and equipment assets in 2016. Overall capital spending in Alberta is anticipated to decline by 11.9%, while anticipated capital outlays in Quebec increased by 7.1%. Anticipated capital expenditures in Ontario are little changed from 2015 levels.
Manufacturing and oil and gas extraction strengthened into 2016
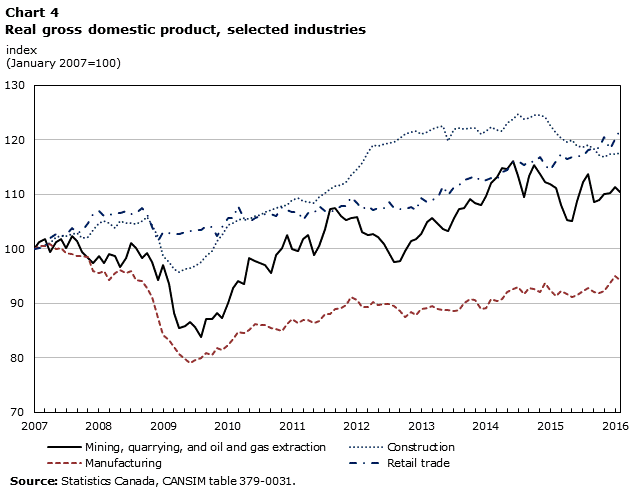
Goods-producing industries increased output from November to January, supported by manufacturing and oil and gas extraction. Manufacturing recorded three consecutive monthly gains during this period, as motor vehicle and parts manufactures increased production into the new year. Petroleum refineries and wood product manufacturers also expanded output into January.
Construction output strengthened at year end, after three consecutive declines from September to November. Residential and repair construction supported the gain. Engineering construction also increased in December, following 13 consecutive monthly declines. As of January, non-residential building construction had declined for six consecutive months.
Description for Chart 4
| Mining, quarrying, and oil and gas extraction | Construction | Manufacturing | Retail trade | |
|---|---|---|---|---|
| January 2007 | 100.0 | 100.0 | 100.0 | 100.0 |
| February 2007 | 101.2 | 100.2 | 100.5 | 100.1 |
| March 2007 | 101.8 | 100.7 | 100.5 | 100.4 |
| April 2007 | 99.4 | 101.1 | 100.8 | 102.0 |
| May 2007 | 101.2 | 102.1 | 100.0 | 102.6 |
| June 2007 | 101.7 | 102.3 | 100.2 | 102.4 |
| July 2007 | 100.2 | 102.4 | 99.3 | 102.5 |
| August 2007 | 102.4 | 102.8 | 99.0 | 103.9 |
| September 2007 | 101.5 | 102.8 | 98.7 | 102.9 |
| October 2007 | 99.3 | 102.0 | 98.7 | 103.3 |
| November 2007 | 98.4 | 102.2 | 98.5 | 104.7 |
| December 2007 | 97.4 | 103.4 | 95.9 | 106.4 |
| January 2008 | 98.7 | 104.8 | 95.6 | 107.0 |
| February 2008 | 97.4 | 105.1 | 95.9 | 106.1 |
| March 2008 | 99.0 | 104.8 | 94.3 | 106.2 |
| April 2008 | 98.6 | 103.7 | 95.6 | 106.6 |
| May 2008 | 96.7 | 105.1 | 96.1 | 106.5 |
| June 2008 | 98.3 | 104.7 | 95.5 | 106.9 |
| July 2008 | 101.0 | 104.7 | 95.9 | 106.4 |
| August 2008 | 100.2 | 104.5 | 94.2 | 106.6 |
| September 2008 | 98.4 | 105.1 | 94.2 | 107.4 |
| October 2008 | 99.2 | 105.8 | 92.8 | 106.3 |
| November 2008 | 97.5 | 104.3 | 91.2 | 104.0 |
| December 2008 | 94.2 | 102.1 | 87.2 | 101.3 |
| January 2009 | 97.0 | 98.8 | 84.1 | 103.1 |
| February 2009 | 93.5 | 97.5 | 83.2 | 102.9 |
| March 2009 | 88.2 | 96.3 | 82.0 | 102.7 |
| April 2009 | 85.4 | 95.7 | 80.7 | 102.6 |
| May 2009 | 85.8 | 96.4 | 79.7 | 103.1 |
| June 2009 | 86.6 | 96.5 | 79.0 | 103.3 |
| July 2009 | 85.5 | 96.8 | 79.6 | 103.4 |
| August 2009 | 83.9 | 97.5 | 80.0 | 103.5 |
| September 2009 | 87.0 | 98.6 | 80.9 | 104.1 |
| October 2009 | 87.0 | 99.6 | 80.5 | 104.0 |
| November 2009 | 88.2 | 101.5 | 81.8 | 102.3 |
| December 2009 | 87.2 | 102.5 | 81.4 | 104.0 |
| January 2010 | 90.0 | 104.3 | 82.3 | 105.6 |
| February 2010 | 92.8 | 104.8 | 83.4 | 105.6 |
| March 2010 | 94.0 | 105.2 | 84.7 | 107.8 |
| April 2010 | 93.6 | 105.6 | 84.6 | 105.4 |
| May 2010 | 98.3 | 105.4 | 85.0 | 105.0 |
| June 2010 | 97.7 | 105.9 | 86.1 | 105.7 |
| July 2010 | 97.5 | 106.1 | 86.1 | 106.0 |
| August 2010 | 97.1 | 106.8 | 86.0 | 106.4 |
| September 2010 | 95.5 | 107.1 | 85.4 | 106.4 |
| October 2010 | 98.9 | 107.5 | 85.3 | 106.0 |
| November 2010 | 100.1 | 107.8 | 84.8 | 107.7 |
| December 2010 | 102.4 | 108.0 | 86.2 | 107.1 |
| January 2011 | 100.0 | 109.0 | 87.0 | 106.8 |
| February 2011 | 99.5 | 109.4 | 86.3 | 106.8 |
| March 2011 | 101.8 | 108.8 | 86.9 | 105.3 |
| April 2011 | 102.5 | 108.6 | 86.9 | 106.5 |
| May 2011 | 98.8 | 108.4 | 86.4 | 106.5 |
| June 2011 | 100.5 | 109.5 | 86.8 | 107.9 |
| July 2011 | 103.6 | 110.3 | 88.1 | 106.9 |
| August 2011 | 107.3 | 111.1 | 87.9 | 106.8 |
| September 2011 | 107.6 | 111.6 | 88.9 | 107.1 |
| October 2011 | 105.9 | 111.8 | 89.1 | 107.8 |
| November 2011 | 105.2 | 112.3 | 89.6 | 107.8 |
| December 2011 | 105.6 | 113.5 | 91.1 | 109.5 |
| January 2012 | 105.8 | 114.7 | 90.7 | 108.5 |
| February 2012 | 103.1 | 115.8 | 89.3 | 107.3 |
| March 2012 | 102.6 | 117.7 | 89.3 | 107.9 |
| April 2012 | 102.8 | 119.2 | 90.2 | 107.1 |
| May 2012 | 102.2 | 118.8 | 89.7 | 107.5 |
| June 2012 | 100.9 | 119.3 | 89.8 | 107.5 |
| July 2012 | 99.1 | 119.5 | 89.8 | 108.5 |
| August 2012 | 97.5 | 119.7 | 89.5 | 107.4 |
| September 2012 | 97.8 | 120.3 | 88.5 | 107.4 |
| October 2012 | 99.5 | 121.1 | 87.5 | 107.3 |
| November 2012 | 101.5 | 121.4 | 88.5 | 107.7 |
| December 2012 | 101.7 | 121.7 | 87.9 | 107.1 |
| January 2013 | 102.8 | 121.1 | 89.0 | 109.3 |
| February 2013 | 105.0 | 121.4 | 89.2 | 108.6 |
| March 2013 | 105.6 | 122.0 | 89.4 | 109.0 |
| April 2013 | 104.6 | 122.4 | 88.9 | 109.6 |
| May 2013 | 103.6 | 122.6 | 88.7 | 111.4 |
| June 2013 | 103.3 | 119.7 | 88.7 | 109.9 |
| July 2013 | 105.7 | 122.0 | 88.5 | 111.3 |
| August 2013 | 107.3 | 122.2 | 88.7 | 111.8 |
| September 2013 | 107.5 | 121.9 | 90.1 | 112.6 |
| October 2013 | 109.1 | 122.1 | 90.7 | 113.0 |
| November 2013 | 108.4 | 122.3 | 90.6 | 113.4 |
| December 2013 | 108.1 | 121.1 | 88.9 | 112.4 |
| January 2014 | 109.7 | 121.6 | 89.2 | 112.5 |
| February 2014 | 112.0 | 122.3 | 90.8 | 113.1 |
| March 2014 | 113.3 | 121.7 | 90.3 | 112.8 |
| April 2014 | 114.8 | 121.6 | 90.8 | 114.2 |
| May 2014 | 114.6 | 123.2 | 92.0 | 114.4 |
| June 2014 | 116.1 | 123.8 | 92.5 | 116.0 |
| July 2014 | 113.3 | 124.8 | 92.9 | 116.1 |
| August 2014 | 109.5 | 123.9 | 91.8 | 115.5 |
| September 2014 | 113.4 | 124.0 | 92.8 | 116.0 |
| October 2014 | 115.3 | 124.5 | 92.6 | 116.0 |
| November 2014 | 113.7 | 124.6 | 92.1 | 116.9 |
| December 2014 | 112.3 | 124.2 | 93.7 | 115.4 |
| January 2015 | 111.9 | 122.8 | 92.4 | 114.5 |
| February 2015 | 111.2 | 121.3 | 91.3 | 116.2 |
| March 2015 | 108.0 | 120.3 | 92.1 | 117.4 |
| April 2015 | 105.3 | 119.5 | 91.7 | 116.6 |
| May 2015 | 105.1 | 120.0 | 91.1 | 116.8 |
| June 2015 | 108.9 | 118.9 | 91.5 | 117.0 |
| July 2015 | 112.3 | 118.7 | 92.3 | 117.1 |
| August 2015 | 113.7 | 119.0 | 92.8 | 118.1 |
| September 2015 | 108.5 | 118.2 | 92.0 | 118.6 |
| October 2015 | 109.0 | 117.2 | 91.8 | 118.5 |
| November 2015 | 110.1 | 116.8 | 92.2 | 120.5 |
| December 2015 | 110.3 | 117.5 | 93.6 | 118.3 |
| January 2016 | 111.3 | 117.5 | 95.0 | 120.2 |
| February 2016 | 110.5 | 117.6 | 94.2 | 121.9 |
After offsetting movements late in the year, retail trade strengthened in early 2016. As of January, motor vehicles and parts dealers had increased volumes in seven of the last eight months.
After supply disruptions affected output in September, non-conventional oil extraction increased into early 2016. For 2015 as a whole, non-conventional output increased 8.9%, offsetting a 2.9% decline in conventional extraction. Establishments that provide support activities for mining and oil and gas extraction, which include rigging and drilling services, continued to decline. Annual output for these support services was 35% lower in 2015, reflecting sizable contractions early in the year. In contrast, crude oil and other pipeline transportation strengthened late in the year. For 2015 as a whole, output in this sector was 8.8% higher than in 2014.

Description for Chart 5
| Conventional oil and gas extraction | Non-conventional oil extraction | Support activities for mining and oil and gas extraction | Crude oil and other pipeline transportation | |
|---|---|---|---|---|
| January 2007 | 100.0 | 100.0 | 100.0 | 100.0 |
| February 2007 | 100.2 | 108.1 | 98.8 | 97.7 |
| March 2007 | 100.3 | 112.5 | 95.5 | 96.6 |
| April 2007 | 103.4 | 102.3 | 80.3 | 96.8 |
| May 2007 | 103.7 | 100.0 | 88.1 | 96.1 |
| June 2007 | 105.5 | 94.4 | 95.1 | 93.2 |
| July 2007 | 99.5 | 101.6 | 100.9 | 96.6 |
| August 2007 | 100.8 | 110.6 | 94.9 | 95.3 |
| September 2007 | 101.0 | 106.4 | 94.1 | 94.8 |
| October 2007 | 99.4 | 105.1 | 90.8 | 94.0 |
| November 2007 | 98.3 | 101.8 | 93.4 | 93.6 |
| December 2007 | 97.9 | 93.2 | 91.6 | 91.7 |
| January 2008 | 95.7 | 104.9 | 94.3 | 92.3 |
| February 2008 | 94.7 | 102.5 | 92.2 | 91.7 |
| March 2008 | 95.9 | 105.7 | 93.3 | 90.6 |
| April 2008 | 97.5 | 101.6 | 89.4 | 89.4 |
| May 2008 | 95.4 | 97.9 | 90.3 | 91.7 |
| June 2008 | 93.5 | 105.2 | 106.8 | 89.4 |
| July 2008 | 97.2 | 107.9 | 111.6 | 86.8 |
| August 2008 | 94.5 | 110.9 | 111.6 | 87.6 |
| September 2008 | 94.4 | 106.3 | 108.2 | 86.1 |
| October 2008 | 95.9 | 107.3 | 112.2 | 89.8 |
| November 2008 | 93.6 | 109.4 | 110.0 | 88.1 |
| December 2008 | 91.1 | 112.9 | 89.7 | 90.7 |
| January 2009 | 92.1 | 115.1 | 91.7 | 88.3 |
| February 2009 | 91.4 | 121.6 | 86.4 | 85.2 |
| March 2009 | 88.5 | 118.2 | 64.7 | 84.3 |
| April 2009 | 85.9 | 111.9 | 69.9 | 83.2 |
| May 2009 | 82.4 | 124.7 | 68.1 | 80.7 |
| June 2009 | 85.8 | 127.2 | 67.2 | 84.3 |
| July 2009 | 86.3 | 128.8 | 62.4 | 83.4 |
| August 2009 | 81.7 | 122.8 | 68.7 | 82.8 |
| September 2009 | 82.1 | 127.7 | 72.7 | 86.4 |
| October 2009 | 81.3 | 130.1 | 70.2 | 87.3 |
| November 2009 | 82.9 | 130.4 | 80.3 | 87.8 |
| December 2009 | 81.2 | 120.8 | 92.0 | 85.7 |
| January 2010 | 83.6 | 113.8 | 90.3 | 82.0 |
| February 2010 | 82.4 | 127.1 | 98.0 | 81.4 |
| March 2010 | 83.6 | 131.8 | 89.6 | 87.6 |
| April 2010 | 83.8 | 135.1 | 87.2 | 85.8 |
| May 2010 | 85.4 | 144.8 | 97.8 | 87.9 |
| June 2010 | 85.3 | 145.7 | 94.3 | 87.8 |
| July 2010 | 86.1 | 140.3 | 94.2 | 89.8 |
| August 2010 | 88.4 | 136.5 | 88.7 | 90.0 |
| September 2010 | 87.3 | 131.9 | 81.0 | 80.1 |
| October 2010 | 86.6 | 139.0 | 92.8 | 82.6 |
| November 2010 | 86.7 | 148.9 | 92.9 | 87.7 |
| December 2010 | 88.4 | 153.5 | 97.6 | 87.6 |
| January 2011 | 88.4 | 146.5 | 89.1 | 97.8 |
| February 2011 | 86.3 | 148.5 | 88.9 | 102.6 |
| March 2011 | 87.6 | 146.8 | 104.3 | 99.2 |
| April 2011 | 88.1 | 151.6 | 101.8 | 95.2 |
| May 2011 | 86.9 | 135.6 | 102.8 | 94.5 |
| June 2011 | 85.4 | 145.7 | 103.2 | 96.5 |
| July 2011 | 87.7 | 151.0 | 105.1 | 100.9 |
| August 2011 | 89.5 | 154.0 | 123.7 | 106.1 |
| September 2011 | 89.9 | 155.4 | 123.9 | 106.2 |
| October 2011 | 89.1 | 151.4 | 124.1 | 106.2 |
| November 2011 | 87.9 | 151.7 | 123.7 | 104.0 |
| December 2011 | 88.0 | 153.1 | 120.6 | 105.7 |
| January 2012 | 87.9 | 159.9 | 121.2 | 111.1 |
| February 2012 | 86.0 | 156.4 | 123.7 | 109.6 |
| March 2012 | 85.1 | 145.7 | 127.9 | 109.4 |
| April 2012 | 84.8 | 155.0 | 118.7 | 113.7 |
| May 2012 | 82.4 | 162.0 | 110.3 | 116.3 |
| June 2012 | 79.6 | 158.9 | 110.0 | 116.0 |
| July 2012 | 78.0 | 160.8 | 104.6 | 114.8 |
| August 2012 | 76.5 | 160.3 | 102.6 | 114.1 |
| September 2012 | 76.6 | 158.9 | 106.3 | 111.1 |
| October 2012 | 80.9 | 161.4 | 102.4 | 105.5 |
| November 2012 | 83.7 | 155.6 | 105.0 | 110.0 |
| December 2012 | 82.1 | 163.5 | 104.9 | 115.0 |
| January 2013 | 83.0 | 162.6 | 111.9 | 116.4 |
| February 2013 | 83.9 | 161.9 | 116.3 | 117.1 |
| March 2013 | 84.7 | 166.4 | 109.7 | 121.3 |
| April 2013 | 84.1 | 161.8 | 109.5 | 117.6 |
| May 2013 | 86.2 | 154.5 | 104.7 | 115.6 |
| June 2013 | 87.0 | 159.6 | 100.2 | 115.8 |
| July 2013 | 88.2 | 163.0 | 105.9 | 115.8 |
| August 2013 | 88.4 | 172.6 | 111.6 | 119.9 |
| September 2013 | 88.7 | 168.8 | 113.4 | 122.4 |
| October 2013 | 86.9 | 173.3 | 116.6 | 127.0 |
| November 2013 | 86.7 | 178.6 | 109.4 | 126.1 |
| December 2013 | 87.8 | 177.7 | 105.7 | 119.7 |
| January 2014 | 87.7 | 175.9 | 121.2 | 123.5 |
| February 2014 | 88.8 | 175.7 | 125.5 | 125.3 |
| March 2014 | 88.7 | 179.5 | 130.7 | 127.8 |
| April 2014 | 88.6 | 182.1 | 138.5 | 127.6 |
| May 2014 | 89.6 | 183.1 | 135.5 | 132.1 |
| June 2014 | 91.3 | 186.2 | 129.6 | 134.3 |
| July 2014 | 90.3 | 180.2 | 122.1 | 133.5 |
| August 2014 | 86.8 | 178.3 | 113.4 | 134.0 |
| September 2014 | 89.8 | 188.1 | 114.7 | 135.1 |
| October 2014 | 90.6 | 195.0 | 115.3 | 136.4 |
| November 2014 | 90.6 | 186.4 | 117.3 | 136.7 |
| December 2014 | 89.1 | 184.4 | 114.3 | 137.1 |
| January 2015 | 89.6 | 196.4 | 94.8 | 135.8 |
| February 2015 | 88.6 | 206.3 | 79.6 | 137.4 |
| March 2015 | 87.1 | 199.9 | 65.1 | 134.3 |
| April 2015 | 86.6 | 183.0 | 73.9 | 142.2 |
| May 2015 | 85.2 | 182.4 | 81.9 | 137.4 |
| June 2015 | 85.3 | 194.5 | 85.2 | 137.2 |
| July 2015 | 85.4 | 213.2 | 81.8 | 146.6 |
| August 2015 | 86.6 | 214.7 | 85.3 | 153.0 |
| September 2015 | 87.2 | 191.7 | 78.2 | 149.9 |
| October 2015 | 85.3 | 199.2 | 80.2 | 144.3 |
| November 2015 | 86.6 | 204.3 | 80.4 | 150.8 |
| December 2015 | 86.8 | 204.8 | 77.2 | 154.3 |
| January 2016 | 87.1 | 210.1 | 78.7 | 163.2 |
| February 2016 | 87.4 | 206.5 | 74.7 | 159.2 |
Service industries supported growth through the second half of 2015, led by transportation and warehousing, real estate, and retail trade. Finance and insurance industries increased output by 4.5% in 2015, while real estate and rental and leasing increased 3.2%.
Real GDP edged down 0.1% in February on lower goods production.
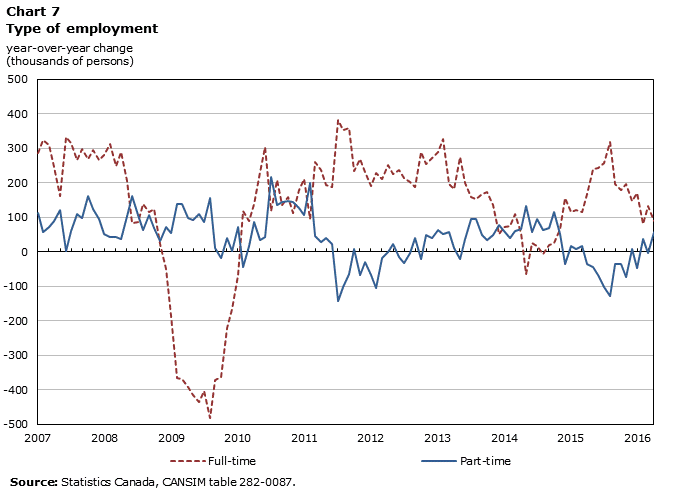
Full-time employment growth moderated
Total employment increased by 64,000 (+0.4%) in the last six months of 2015 on gains in part-time work and self employment. Full-time employment was little changed during the second half of the year after notable gains in the first six months (+123,000). Individuals aged 55 and older accounted for all of the net gain in employment from June to December, as both youth and core-age employment declined.

Description for Chart 6
| Total employed, all industries | Goods-producing sector | Services-producing sector | |
|---|---|---|---|
| January 2007 | 400.7 | 81.5 | 319.2 |
| February 2007 | 382.8 | 23.4 | 359.3 |
| March 2007 | 380.5 | 1.6 | 378.8 |
| April 2007 | 335.9 | -34.2 | 370.0 |
| May 2007 | 282.2 | -16.4 | 298.6 |
| June 2007 | 335.6 | -17.9 | 353.6 |
| July 2007 | 376.2 | 12.3 | 363.9 |
| August 2007 | 378.2 | 45.2 | 333.0 |
| September 2007 | 398.4 | 8.8 | 389.6 |
| October 2007 | 431.5 | -9.0 | 440.5 |
| November 2007 | 420.3 | -35.6 | 456.0 |
| December 2007 | 359.4 | -62.7 | 422.0 |
| January 2008 | 331.3 | -47.5 | 378.8 |
| February 2008 | 355.6 | -10.9 | 366.5 |
| March 2008 | 292.1 | 4.7 | 287.4 |
| April 2008 | 326.7 | 26.2 | 300.6 |
| May 2008 | 308.6 | 22.9 | 285.7 |
| June 2008 | 244.6 | 28.7 | 215.9 |
| July 2008 | 193.1 | 5.3 | 187.8 |
| August 2008 | 204.2 | -7.8 | 212.0 |
| September 2008 | 220.5 | 16.9 | 203.6 |
| October 2008 | 193.5 | 5.3 | 188.2 |
| November 2008 | 55.7 | -26.1 | 81.8 |
| December 2008 | 21.3 | -28.6 | 49.9 |
| January 2009 | -129.4 | -149.5 | 20.1 |
| February 2009 | -227.4 | -212.3 | -15.1 |
| March 2009 | -230.3 | -221.5 | -8.8 |
| April 2009 | -292.9 | -269.1 | -23.8 |
| May 2009 | -323.9 | -315.5 | -8.4 |
| June 2009 | -326.6 | -308.0 | -18.6 |
| July 2009 | -317.3 | -301.2 | -16.2 |
| August 2009 | -327.8 | -303.2 | -24.6 |
| September 2009 | -361.3 | -280.4 | -80.9 |
| October 2009 | -382.2 | -267.6 | -114.7 |
| November 2009 | -180.2 | -225.1 | 44.9 |
| December 2009 | -164.5 | -216.8 | 52.3 |
| January 2010 | 4.9 | -118.8 | 123.7 |
| February 2010 | 74.7 | -65.9 | 140.5 |
| March 2010 | 105.4 | -55.1 | 160.6 |
| April 2010 | 225.1 | -5.3 | 230.4 |
| May 2010 | 266.0 | 51.7 | 214.3 |
| June 2010 | 345.6 | 66.7 | 278.9 |
| July 2010 | 336.3 | 50.0 | 286.4 |
| August 2010 | 342.3 | 47.3 | 295.0 |
| September 2010 | 279.1 | 0.9 | 278.2 |
| October 2010 | 306.8 | 18.1 | 288.8 |
| November 2010 | 257.4 | 35.1 | 222.3 |
| December 2010 | 307.9 | 55.0 | 252.8 |
| January 2011 | 315.4 | 78.2 | 237.2 |
| February 2011 | 294.9 | 86.1 | 208.9 |
| March 2011 | 305.4 | 104.8 | 200.5 |
| April 2011 | 265.0 | 91.1 | 173.9 |
| May 2011 | 232.9 | 76.1 | 156.9 |
| June 2011 | 210.2 | 67.4 | 142.9 |
| July 2011 | 238.8 | 73.1 | 165.7 |
| August 2011 | 250.9 | 72.9 | 178.0 |
| September 2011 | 294.6 | 84.3 | 210.2 |
| October 2011 | 239.3 | 63.7 | 175.6 |
| November 2011 | 202.6 | 70.7 | 131.9 |
| December 2011 | 200.8 | 59.9 | 141.0 |
| January 2012 | 121.9 | 22.0 | 99.8 |
| February 2012 | 122.9 | 31.7 | 91.2 |
| March 2012 | 194.0 | 36.0 | 158.0 |
| April 2012 | 250.7 | 81.5 | 169.2 |
| May 2012 | 246.7 | 73.1 | 173.5 |
| June 2012 | 222.7 | 84.0 | 138.6 |
| July 2012 | 179.2 | 91.0 | 88.1 |
| August 2012 | 200.6 | 92.5 | 108.1 |
| September 2012 | 227.2 | 110.8 | 116.5 |
| October 2012 | 266.7 | 107.6 | 159.0 |
| November 2012 | 301.4 | 96.2 | 205.2 |
| December 2012 | 312.1 | 103.6 | 208.5 |
| January 2013 | 351.4 | 92.5 | 259.0 |
| February 2013 | 377.6 | 75.6 | 302.0 |
| March 2013 | 253.0 | 58.6 | 194.4 |
| April 2013 | 192.9 | 28.3 | 164.5 |
| May 2013 | 253.6 | 32.4 | 221.2 |
| June 2013 | 236.0 | 21.7 | 214.3 |
| July 2013 | 255.5 | 14.0 | 241.6 |
| August 2013 | 247.4 | 16.2 | 231.2 |
| September 2013 | 216.8 | -0.9 | 217.7 |
| October 2013 | 206.6 | 18.2 | 188.5 |
| November 2013 | 183.5 | -10.6 | 194.1 |
| December 2013 | 130.9 | -50.1 | 181.0 |
| January 2014 | 131.8 | 6.1 | 125.6 |
| February 2014 | 114.4 | 2.6 | 111.8 |
| March 2014 | 170.2 | 22.2 | 148.0 |
| April 2014 | 121.8 | -28.6 | 150.5 |
| May 2014 | 67.6 | -50.0 | 117.6 |
| June 2014 | 81.9 | -27.5 | 109.4 |
| July 2014 | 110.8 | -26.5 | 137.2 |
| August 2014 | 57.2 | -48.7 | 106.0 |
| September 2014 | 90.4 | -28.0 | 118.3 |
| October 2014 | 140.8 | -13.4 | 154.3 |
| November 2014 | 119.4 | -7.1 | 126.5 |
| December 2014 | 120.1 | 30.6 | 89.4 |
| January 2015 | 130.9 | 2.1 | 128.9 |
| February 2015 | 129.7 | -23.6 | 153.2 |
| March 2015 | 133.4 | -54.9 | 188.3 |
| April 2015 | 132.4 | -31.5 | 163.8 |
| May 2015 | 196.4 | 5.7 | 190.8 |
| June 2015 | 176.4 | -13.2 | 189.6 |
| July 2015 | 156.7 | -29.8 | 186.6 |
| August 2015 | 190.8 | -11.7 | 202.4 |
| September 2015 | 159.1 | -26.2 | 185.4 |
| October 2015 | 142.4 | -57.0 | 199.3 |
| November 2015 | 124.8 | -5.1 | 129.9 |
| December 2015 | 155.4 | -17.0 | 172.4 |
| January 2016 | 125.5 | -43.7 | 169.2 |
| February 2016 | 117.9 | 17.7 | 100.3 |
| March 2016 | 129.6 | 1.7 | 127.9 |
| April 2016 | 144.0 | -27.5 | 171.6 |
Employment gains during the second half of 2015 were led by increases in health care and social assistance and in professional, scientific and technical services. Employment in manufacturing edged up late in the year.
Description for Chart 7
| Full-time | Part-time | |
|---|---|---|
| January 2007 | 287.7 | 113.0 |
| February 2007 | 324.8 | 58.0 |
| March 2007 | 308.7 | 71.8 |
| April 2007 | 247.1 | 88.8 |
| May 2007 | 160.5 | 121.6 |
| June 2007 | 332.8 | 2.8 |
| July 2007 | 314.7 | 61.6 |
| August 2007 | 267.5 | 110.7 |
| September 2007 | 299.5 | 98.9 |
| October 2007 | 270.1 | 161.4 |
| November 2007 | 296.1 | 124.3 |
| December 2007 | 265.0 | 94.4 |
| January 2008 | 279.7 | 51.6 |
| February 2008 | 311.5 | 44.1 |
| March 2008 | 249.1 | 43.0 |
| April 2008 | 289.7 | 37.1 |
| May 2008 | 204.1 | 104.5 |
| June 2008 | 83.2 | 161.4 |
| July 2008 | 86.0 | 107.2 |
| August 2008 | 139.9 | 64.3 |
| September 2008 | 114.5 | 106.1 |
| October 2008 | 124.7 | 68.9 |
| November 2008 | 23.2 | 32.5 |
| December 2008 | -50.2 | 71.5 |
| January 2009 | -185.2 | 55.8 |
| February 2009 | -365.5 | 138.1 |
| March 2009 | -369.0 | 138.7 |
| April 2009 | -391.4 | 98.5 |
| May 2009 | -416.0 | 92.2 |
| June 2009 | -436.9 | 110.3 |
| July 2009 | -402.7 | 85.2 |
| August 2009 | -482.6 | 154.8 |
| September 2009 | -372.1 | 10.8 |
| October 2009 | -364.1 | -18.3 |
| November 2009 | -221.0 | 40.8 |
| December 2009 | -166.0 | 1.5 |
| January 2010 | -67.4 | 72.3 |
| February 2010 | 118.4 | -43.7 |
| March 2010 | 89.3 | 16.1 |
| April 2010 | 138.3 | 86.7 |
| May 2010 | 230.7 | 35.2 |
| June 2010 | 303.0 | 42.6 |
| July 2010 | 118.4 | 218.0 |
| August 2010 | 206.9 | 135.4 |
| September 2010 | 134.8 | 144.3 |
| October 2010 | 159.5 | 147.3 |
| November 2010 | 113.6 | 143.9 |
| December 2010 | 180.3 | 127.5 |
| January 2011 | 209.7 | 105.6 |
| February 2011 | 96.4 | 198.5 |
| March 2011 | 260.8 | 44.5 |
| April 2011 | 236.1 | 28.9 |
| May 2011 | 193.8 | 39.2 |
| June 2011 | 186.6 | 23.6 |
| July 2011 | 382.9 | -144.1 |
| August 2011 | 353.2 | -102.2 |
| September 2011 | 360.4 | -65.8 |
| October 2011 | 232.8 | 6.5 |
| November 2011 | 269.2 | -66.7 |
| December 2011 | 231.2 | -30.2 |
| January 2012 | 190.4 | -68.5 |
| February 2012 | 229.0 | -106.1 |
| March 2012 | 212.3 | -18.2 |
| April 2012 | 250.8 | -0.1 |
| May 2012 | 225.5 | 21.2 |
| June 2012 | 237.4 | -14.8 |
| July 2012 | 213.0 | -33.9 |
| August 2012 | 203.5 | -2.9 |
| September 2012 | 188.4 | 38.8 |
| October 2012 | 288.2 | -21.4 |
| November 2012 | 253.4 | 48.0 |
| December 2012 | 273.2 | 38.8 |
| January 2013 | 289.5 | 62.1 |
| February 2013 | 327.2 | 50.4 |
| March 2013 | 195.4 | 57.6 |
| April 2013 | 183.2 | 9.7 |
| May 2013 | 275.1 | -21.6 |
| June 2013 | 199.9 | 36.3 |
| July 2013 | 159.2 | 96.4 |
| August 2013 | 153.5 | 93.8 |
| September 2013 | 167.6 | 49.2 |
| October 2013 | 172.5 | 34.1 |
| November 2013 | 136.4 | 47.2 |
| December 2013 | 52.4 | 78.5 |
| January 2014 | 70.9 | 60.7 |
| February 2014 | 73.6 | 40.8 |
| March 2014 | 109.2 | 61.0 |
| April 2014 | 55.5 | 66.3 |
| May 2014 | -63.9 | 131.6 |
| June 2014 | 25.1 | 56.7 |
| July 2014 | 17.1 | 93.6 |
| August 2014 | -5.8 | 63.0 |
| September 2014 | 20.5 | 69.9 |
| October 2014 | 24.7 | 116.1 |
| November 2014 | 66.9 | 52.5 |
| December 2014 | 156.3 | -36.2 |
| January 2015 | 114.2 | 16.7 |
| February 2015 | 120.9 | 8.8 |
| March 2015 | 116.7 | 16.7 |
| April 2015 | 167.5 | -35.1 |
| May 2015 | 240.3 | -43.9 |
| June 2015 | 243.4 | -67.1 |
| July 2015 | 258.2 | -101.4 |
| August 2015 | 318.9 | -128.1 |
| September 2015 | 195.7 | -36.6 |
| October 2015 | 178.7 | -36.2 |
| November 2015 | 197.8 | -73.1 |
| December 2015 | 147.4 | 8.0 |
| January 2016 | 171.5 | -45.9 |
| February 2016 | 81.6 | 36.3 |
| March 2016 | 133.7 | -4.1 |
| April 2016 | 88.2 | 55.9 |
All of the net growth in employment during the last half of the year occurred in central Canada and British Columbia. Employment in Alberta declined by 15,000 in the second half of the year, as the province’s unemployment rate increased from 5.8% in June to 7.0%. Saskatchewan’s unemployment rate also rose during the second half and was 5.5% at year end. In January 2015, the unemployment rates in Saskatchewan and Alberta had been 4.5% and 4.6% respectively. The unemployment rate in Ontario remained under 7% throughout the year.
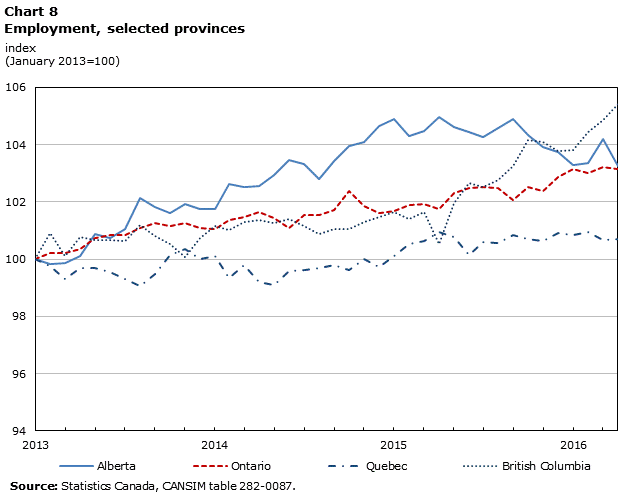
Description for Chart 8
| Alberta | Ontario | Quebec | British Columbia | |
|---|---|---|---|---|
| January 2013 | 100 | 100 | 100 | 100 |
| February 2013 | 99.8 | 100.2 | 99.8 | 100.9 |
| March 2013 | 99.9 | 100.2 | 99.3 | 100.1 |
| April 2013 | 100.1 | 100.3 | 99.7 | 100.8 |
| May 2013 | 100.9 | 100.8 | 99.7 | 100.7 |
| June 2013 | 100.7 | 100.8 | 99.5 | 100.7 |
| July 2013 | 101.0 | 100.8 | 99.3 | 100.6 |
| August 2013 | 102.2 | 101.1 | 99.1 | 101.2 |
| September 2013 | 101.8 | 101.2 | 99.5 | 100.8 |
| October 2013 | 101.6 | 101.1 | 100.1 | 100.5 |
| November 2013 | 101.9 | 101.3 | 100.3 | 100.1 |
| December 2013 | 101.7 | 101.1 | 100.0 | 100.8 |
| January 2014 | 101.7 | 101.1 | 100.1 | 101.2 |
| February 2014 | 102.6 | 101.4 | 99.3 | 101.0 |
| March 2014 | 102.5 | 101.5 | 99.8 | 101.3 |
| April 2014 | 102.5 | 101.6 | 99.2 | 101.4 |
| May 2014 | 102.9 | 101.4 | 99.1 | 101.3 |
| June 2014 | 103.5 | 101.1 | 99.6 | 101.4 |
| July 2014 | 103.3 | 101.5 | 99.6 | 101.2 |
| August 2014 | 102.8 | 101.5 | 99.7 | 100.9 |
| September 2014 | 103.4 | 101.7 | 99.8 | 101.0 |
| October 2014 | 103.9 | 102.4 | 99.6 | 101.0 |
| November 2014 | 104.1 | 101.9 | 100.0 | 101.3 |
| December 2014 | 104.6 | 101.6 | 99.7 | 101.5 |
| January 2015 | 104.9 | 101.7 | 100.1 | 101.7 |
| February 2015 | 104.3 | 101.9 | 100.5 | 101.4 |
| March 2015 | 104.5 | 101.9 | 100.6 | 101.6 |
| April 2015 | 105.0 | 101.7 | 100.9 | 100.5 |
| May 2015 | 104.6 | 102.3 | 100.8 | 102.0 |
| June 2015 | 104.4 | 102.5 | 100.1 | 102.7 |
| July 2015 | 104.3 | 102.5 | 100.6 | 102.5 |
| August 2015 | 104.6 | 102.5 | 100.6 | 102.8 |
| September 2015 | 104.9 | 102.1 | 100.8 | 103.2 |
| October 2015 | 104.3 | 102.5 | 100.7 | 104.2 |
| November 2015 | 103.9 | 102.4 | 100.6 | 104.1 |
| December 2015 | 103.7 | 102.9 | 100.9 | 103.8 |
| January 2016 | 103.3 | 103.2 | 100.8 | 103.8 |
| February 2016 | 103.4 | 103.0 | 100.9 | 104.4 |
| March 2016 | 104.2 | 103.2 | 100.7 | 104.8 |
| April 2016 | 103.3 | 103.2 | 100.7 | 105.4 |
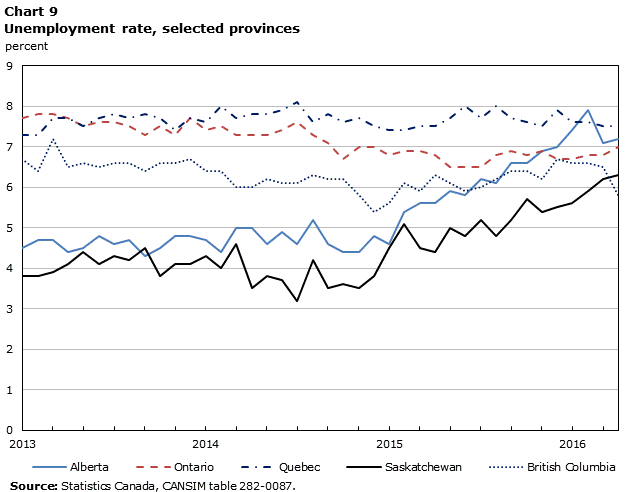
Description for Chart 9
| Alberta | Ontario | Quebec | Saskatchewan | British Columbia | |
|---|---|---|---|---|---|
| January 2013 | 4.5 | 7.7 | 7.3 | 3.8 | 6.7 |
| February 2013 | 4.7 | 7.8 | 7.3 | 3.8 | 6.4 |
| March 2013 | 4.7 | 7.8 | 7.7 | 3.9 | 7.2 |
| April 2013 | 4.4 | 7.7 | 7.7 | 4.1 | 6.5 |
| May 2013 | 4.5 | 7.5 | 7.5 | 4.4 | 6.6 |
| June 2013 | 4.8 | 7.6 | 7.7 | 4.1 | 6.5 |
| July 2013 | 4.6 | 7.6 | 7.8 | 4.3 | 6.6 |
| August 2013 | 4.7 | 7.5 | 7.7 | 4.2 | 6.6 |
| September 2013 | 4.3 | 7.3 | 7.8 | 4.5 | 6.4 |
| October 2013 | 4.5 | 7.5 | 7.7 | 3.8 | 6.6 |
| November 2013 | 4.8 | 7.3 | 7.4 | 4.1 | 6.6 |
| December 2013 | 4.8 | 7.7 | 7.7 | 4.1 | 6.7 |
| January 2014 | 4.7 | 7.4 | 7.6 | 4.3 | 6.4 |
| February 2014 | 4.4 | 7.5 | 8.0 | 4.0 | 6.4 |
| March 2014 | 5.0 | 7.3 | 7.7 | 4.6 | 6.0 |
| April 2014 | 5.0 | 7.3 | 7.8 | 3.5 | 6.0 |
| May 2014 | 4.6 | 7.3 | 7.8 | 3.8 | 6.2 |
| June 2014 | 4.9 | 7.4 | 7.9 | 3.7 | 6.1 |
| July 2014 | 4.6 | 7.6 | 8.1 | 3.2 | 6.1 |
| August 2014 | 5.2 | 7.3 | 7.6 | 4.2 | 6.3 |
| September 2014 | 4.6 | 7.1 | 7.8 | 3.5 | 6.2 |
| October 2014 | 4.4 | 6.7 | 7.6 | 3.6 | 6.2 |
| November 2014 | 4.4 | 7.0 | 7.7 | 3.5 | 5.8 |
| December 2014 | 4.8 | 7.0 | 7.5 | 3.8 | 5.4 |
| January 2015 | 4.6 | 6.8 | 7.4 | 4.5 | 5.6 |
| February 2015 | 5.4 | 6.9 | 7.4 | 5.1 | 6.1 |
| March 2015 | 5.6 | 6.9 | 7.5 | 4.5 | 5.9 |
| April 2015 | 5.6 | 6.8 | 7.5 | 4.4 | 6.3 |
| May 2015 | 5.9 | 6.5 | 7.7 | 5.0 | 6.1 |
| June 2015 | 5.8 | 6.5 | 8.0 | 4.8 | 5.9 |
| July 2015 | 6.2 | 6.5 | 7.7 | 5.2 | 6.0 |
| August 2015 | 6.1 | 6.8 | 8.0 | 4.8 | 6.2 |
| September 2015 | 6.6 | 6.9 | 7.7 | 5.2 | 6.4 |
| October 2015 | 6.6 | 6.8 | 7.6 | 5.7 | 6.4 |
| November 2015 | 6.9 | 6.9 | 7.5 | 5.4 | 6.2 |
| December 2015 | 7.0 | 6.7 | 7.9 | 5.5 | 6.7 |
| January 2016 | 7.4 | 6.7 | 7.6 | 5.6 | 6.6 |
| February 2016 | 7.9 | 6.8 | 7.6 | 5.9 | 6.6 |
| March 2016 | 7.1 | 6.8 | 7.5 | 6.2 | 6.5 |
| April 2016 | 7.2 | 7.0 | 7.5 | 6.3 | 5.8 |
For 2015 as whole, employment increased by 155,000 (+0.9%) on gains in services, in full-time work, and among workers aged 55 and older. Total employment in British Columbia increased by 52,000 in 2015 while employment in Alberta declined by 20,000.
More recently, total employment rose by 33,000 in the first quarter of 2016 on gains in British Columbia (+24,000) and Ontario (+23,000). The unemployment rate in Alberta reached 7.9% in February before declining to 7.1% in March as employment increased in services.
Total employment was unchanged in April, as declines in Alberta were offset by gains in British Columbia. Employment in manufacturing declined by 52,000 during the first four months of the year.
Stronger non-energy exports improved trade balances in late 2015
Canada continued to post merchandise trade deficits through the second half of 2015 as lower surpluses for energy products, on signficantly lower prices, continued to weigh on trade balances. For 2015 as a whole, merchandise imports exceeded exports by $22.4 billion as the trade surplus on energy products declined from $85.5 billion in 2014 to $53.1 billion in 2015. Total exports increased in the second half of 2015, supported by motor vehicles and parts and consumer goods.
Monthly exports of energy products averaged $6.4 billion during the second half of 2015, down from $7.5 billion during the first six months of the year. Lower export prices for energy accounted for the decline, as average monthly export volumes, measured in chained 2007 dollars, were similar in both six-month periods.

Description for Chart 10
| Total | Energy | Non-energy | |
|---|---|---|---|
| January 2007 | 100.0 | 100.0 | 100.0 |
| February 2007 | 98.3 | 109.9 | 96.0 |
| March 2007 | 102.1 | 110.4 | 100.4 |
| April 2007 | 102.6 | 111.0 | 100.9 |
| May 2007 | 100.6 | 110.0 | 98.7 |
| June 2007 | 97.3 | 104.4 | 95.9 |
| July 2007 | 95.9 | 98.3 | 95.4 |
| August 2007 | 96.1 | 106.0 | 94.2 |
| September 2007 | 93.7 | 109.3 | 90.6 |
| October 2007 | 92.5 | 111.1 | 88.9 |
| November 2007 | 95.1 | 115.9 | 90.9 |
| December 2007 | 91.0 | 117.4 | 85.8 |
| January 2008 | 95.0 | 128.2 | 88.4 |
| February 2008 | 98.5 | 138.8 | 90.5 |
| March 2008 | 101.4 | 150.2 | 91.7 |
| April 2008 | 103.2 | 159.9 | 92.0 |
| May 2008 | 108.7 | 170.9 | 96.4 |
| June 2008 | 110.3 | 184.0 | 95.7 |
| July 2008 | 112.5 | 185.3 | 98.1 |
| August 2008 | 108.4 | 168.2 | 96.6 |
| September 2008 | 105.5 | 158.8 | 94.9 |
| October 2008 | 105.2 | 147.6 | 96.8 |
| November 2008 | 96.7 | 120.3 | 92.0 |
| December 2008 | 85.3 | 93.5 | 83.7 |
| January 2009 | 77.2 | 88.9 | 74.8 |
| February 2009 | 81.7 | 89.9 | 80.1 |
| March 2009 | 81.0 | 91.3 | 78.9 |
| April 2009 | 76.6 | 83.6 | 75.2 |
| May 2009 | 70.3 | 79.0 | 68.5 |
| June 2009 | 74.1 | 94.4 | 70.0 |
| July 2009 | 77.6 | 95.2 | 74.1 |
| August 2009 | 74.0 | 94.7 | 69.9 |
| September 2009 | 75.9 | 96.2 | 71.9 |
| October 2009 | 78.4 | 103.5 | 73.4 |
| November 2009 | 79.6 | 108.5 | 73.9 |
| December 2009 | 81.1 | 113.0 | 74.8 |
| January 2010 | 81.7 | 113.1 | 75.5 |
| February 2010 | 83.6 | 112.3 | 77.9 |
| March 2010 | 82.6 | 108.2 | 77.6 |
| April 2010 | 83.1 | 105.0 | 78.7 |
| May 2010 | 85.2 | 107.4 | 80.8 |
| June 2010 | 84.3 | 100.2 | 81.2 |
| July 2010 | 83.5 | 101.6 | 79.9 |
| August 2010 | 85.7 | 100.8 | 82.7 |
| September 2010 | 84.0 | 99.1 | 81.1 |
| October 2010 | 86.4 | 100.5 | 83.6 |
| November 2010 | 87.7 | 106.6 | 84.0 |
| December 2010 | 92.3 | 124.2 | 86.0 |
| January 2011 | 94.8 | 129.6 | 87.9 |
| February 2011 | 90.1 | 119.3 | 84.3 |
| March 2011 | 91.8 | 125.1 | 85.2 |
| April 2011 | 93.0 | 130.5 | 85.5 |
| May 2011 | 92.6 | 128.7 | 85.4 |
| June 2011 | 91.7 | 126.4 | 84.8 |
| July 2011 | 95.1 | 126.1 | 89.0 |
| August 2011 | 97.8 | 127.6 | 91.9 |
| September 2011 | 100.7 | 138.8 | 93.2 |
| October 2011 | 98.7 | 138.1 | 90.9 |
| November 2011 | 101.4 | 147.7 | 92.2 |
| December 2011 | 105.6 | 149.3 | 96.9 |
| January 2012 | 100.2 | 149.0 | 90.5 |
| February 2012 | 100.0 | 146.3 | 90.9 |
| March 2012 | 96.8 | 134.7 | 89.3 |
| April 2012 | 97.4 | 131.9 | 90.6 |
| May 2012 | 97.3 | 126.1 | 91.6 |
| June 2012 | 96.4 | 125.4 | 90.7 |
| July 2012 | 94.7 | 118.8 | 90.0 |
| August 2012 | 95.9 | 125.7 | 90.1 |
| September 2012 | 95.6 | 127.7 | 89.3 |
| October 2012 | 96.7 | 133.5 | 89.4 |
| November 2012 | 97.2 | 136.3 | 89.4 |
| December 2012 | 97.2 | 132.3 | 90.2 |
| January 2013 | 98.3 | 136.2 | 90.8 |
| February 2013 | 99.7 | 137.1 | 92.3 |
| March 2013 | 100.5 | 140.0 | 92.7 |
| April 2013 | 102.0 | 139.1 | 94.7 |
| May 2013 | 99.8 | 139.5 | 92.0 |
| June 2013 | 100.1 | 140.5 | 92.2 |
| July 2013 | 98.4 | 145.9 | 89.0 |
| August 2013 | 103.3 | 160.5 | 92.0 |
| September 2013 | 103.8 | 160.1 | 92.7 |
| October 2013 | 102.0 | 154.7 | 91.5 |
| November 2013 | 102.0 | 146.1 | 93.3 |
| December 2013 | 102.9 | 151.6 | 93.3 |
| January 2014 | 103.4 | 164.0 | 91.4 |
| February 2014 | 108.8 | 179.7 | 94.8 |
| March 2014 | 110.5 | 183.2 | 96.1 |
| April 2014 | 109.5 | 162.3 | 99.0 |
| May 2014 | 114.2 | 175.6 | 102.0 |
| June 2014 | 113.4 | 174.0 | 101.5 |
| July 2014 | 115.4 | 176.0 | 103.4 |
| August 2014 | 113.6 | 163.5 | 103.7 |
| September 2014 | 112.7 | 158.5 | 103.6 |
| October 2014 | 112.5 | 152.5 | 104.6 |
| November 2014 | 111.0 | 152.1 | 102.8 |
| December 2014 | 110.7 | 128.0 | 107.3 |
| January 2015 | 108.2 | 114.0 | 107.1 |
| February 2015 | 108.2 | 119.9 | 105.9 |
| March 2015 | 109.1 | 109.2 | 109.1 |
| April 2015 | 108.0 | 113.2 | 107.0 |
| May 2015 | 107.6 | 115.9 | 105.9 |
| June 2015 | 113.0 | 119.1 | 111.8 |
| July 2015 | 116.1 | 113.3 | 116.6 |
| August 2015 | 112.5 | 103.7 | 114.3 |
| September 2015 | 111.2 | 97.9 | 113.9 |
| October 2015 | 109.4 | 97.1 | 111.8 |
| November 2015 | 109.7 | 90.4 | 113.5 |
| December 2015 | 113.8 | 89.3 | 118.6 |
| January 2016 | 116.4 | 85.5 | 122.5 |
| February 2016 | 108.7 | 69.5 | 116.5 |
| March 2016 | 103.5 | 66.5 | 110.8 |
After declines from August to October, total exports increased from November to January on the strength of non-energy commodities. Exports of motor vehicles and parts supported gains in each of these months, largely on higher volumes.

Description for Chart 11
| Energy - current dollars | Energy - chained 2007 dollars | Motor vehicles and parts - current dollars | Motor vehicles and parts - chained 2007 dollars | |
|---|---|---|---|---|
| January 2007 | 6.5 | 6.9 | 7.1 | 6.7 |
| February 2007 | 7.2 | 7.0 | 6.9 | 6.5 |
| March 2007 | 7.2 | 7.0 | 7.4 | 7.0 |
| April 2007 | 7.3 | 7.1 | 7.1 | 6.9 |
| May 2007 | 7.2 | 7.3 | 6.7 | 6.6 |
| June 2007 | 6.8 | 7.1 | 6.3 | 6.3 |
| July 2007 | 6.4 | 6.8 | 6.5 | 6.6 |
| August 2007 | 6.9 | 7.4 | 6.1 | 6.1 |
| September 2007 | 7.1 | 7.5 | 6.2 | 6.3 |
| October 2007 | 7.3 | 7.2 | 6.0 | 6.4 |
| November 2007 | 7.6 | 7.0 | 6.0 | 6.5 |
| December 2007 | 7.7 | 6.8 | 5.5 | 5.7 |
| January 2008 | 8.4 | 7.3 | 5.0 | 5.2 |
| February 2008 | 9.1 | 7.3 | 5.7 | 6.1 |
| March 2008 | 9.8 | 7.3 | 5.5 | 5.7 |
| April 2008 | 10.4 | 7.3 | 5.2 | 5.4 |
| May 2008 | 11.2 | 7.3 | 5.0 | 5.2 |
| June 2008 | 12.0 | 7.4 | 5.4 | 5.5 |
| July 2008 | 12.1 | 7.3 | 5.3 | 5.4 |
| August 2008 | 11.0 | 7.4 | 5.2 | 5.1 |
| September 2008 | 10.4 | 7.4 | 5.0 | 4.9 |
| October 2008 | 9.6 | 7.7 | 4.7 | 4.2 |
| November 2008 | 7.9 | 7.6 | 4.8 | 4.3 |
| December 2008 | 6.1 | 7.1 | 4.4 | 3.9 |
| January 2009 | 5.8 | 7.1 | 2.7 | 2.4 |
| February 2009 | 5.9 | 7.2 | 3.5 | 3.1 |
| March 2009 | 6.0 | 7.2 | 3.5 | 3.0 |
| April 2009 | 5.5 | 6.9 | 3.7 | 3.3 |
| May 2009 | 5.2 | 6.4 | 2.9 | 2.7 |
| June 2009 | 6.2 | 7.1 | 2.9 | 2.8 |
| July 2009 | 6.2 | 7.5 | 3.7 | 3.5 |
| August 2009 | 6.2 | 7.2 | 3.8 | 3.7 |
| September 2009 | 6.3 | 7.1 | 4.3 | 4.2 |
| October 2009 | 6.8 | 7.0 | 4.3 | 4.3 |
| November 2009 | 7.1 | 7.0 | 4.3 | 4.2 |
| December 2009 | 7.4 | 7.1 | 4.7 | 4.6 |
| January 2010 | 7.4 | 6.8 | 4.2 | 4.2 |
| February 2010 | 7.3 | 6.7 | 4.6 | 4.6 |
| March 2010 | 7.1 | 6.8 | 4.7 | 4.8 |
| April 2010 | 6.9 | 7.0 | 4.7 | 4.8 |
| May 2010 | 7.0 | 7.7 | 5.1 | 5.1 |
| June 2010 | 6.5 | 7.2 | 5.2 | 5.2 |
| July 2010 | 6.6 | 7.2 | 5.0 | 5.0 |
| August 2010 | 6.6 | 7.1 | 5.2 | 5.2 |
| September 2010 | 6.5 | 7.0 | 4.9 | 5.0 |
| October 2010 | 6.6 | 7.1 | 4.8 | 4.9 |
| November 2010 | 7.0 | 7.2 | 4.5 | 4.6 |
| December 2010 | 8.1 | 7.6 | 4.5 | 4.6 |
| January 2011 | 8.5 | 7.9 | 5.5 | 5.6 |
| February 2011 | 7.8 | 7.6 | 4.8 | 4.9 |
| March 2011 | 8.2 | 7.7 | 4.9 | 5.1 |
| April 2011 | 8.5 | 7.5 | 4.8 | 5.1 |
| May 2011 | 8.4 | 7.4 | 4.8 | 5.0 |
| June 2011 | 8.3 | 7.4 | 4.4 | 4.6 |
| July 2011 | 8.2 | 7.6 | 4.9 | 5.1 |
| August 2011 | 8.3 | 8.1 | 4.6 | 4.8 |
| September 2011 | 9.1 | 8.3 | 4.9 | 5.0 |
| October 2011 | 9.0 | 8.0 | 5.1 | 5.1 |
| November 2011 | 9.6 | 8.0 | 5.1 | 5.1 |
| December 2011 | 9.8 | 7.9 | 5.6 | 5.6 |
| January 2012 | 9.7 | 8.2 | 6.1 | 6.1 |
| February 2012 | 9.6 | 8.4 | 5.6 | 5.8 |
| March 2012 | 8.8 | 8.1 | 5.4 | 5.5 |
| April 2012 | 8.6 | 8.5 | 5.7 | 5.8 |
| May 2012 | 8.2 | 8.1 | 5.6 | 5.7 |
| June 2012 | 8.2 | 8.3 | 6.0 | 5.9 |
| July 2012 | 7.8 | 8.1 | 5.8 | 5.8 |
| August 2012 | 8.2 | 8.2 | 5.9 | 6.0 |
| September 2012 | 8.3 | 8.2 | 5.6 | 5.7 |
| October 2012 | 8.7 | 7.9 | 5.6 | 5.7 |
| November 2012 | 8.9 | 8.4 | 5.8 | 5.9 |
| December 2012 | 8.6 | 8.1 | 5.5 | 5.6 |
| January 2013 | 8.9 | 8.4 | 5.2 | 5.4 |
| February 2013 | 9.0 | 8.4 | 5.6 | 5.7 |
| March 2013 | 9.1 | 8.5 | 5.9 | 5.9 |
| April 2013 | 9.1 | 8.4 | 5.7 | 5.7 |
| May 2013 | 9.1 | 8.3 | 5.5 | 5.5 |
| June 2013 | 9.2 | 8.3 | 5.8 | 5.7 |
| July 2013 | 9.5 | 8.2 | 5.5 | 5.4 |
| August 2013 | 10.5 | 8.7 | 5.8 | 5.6 |
| September 2013 | 10.5 | 8.8 | 5.8 | 5.6 |
| October 2013 | 10.1 | 8.9 | 5.5 | 5.3 |
| November 2013 | 9.5 | 8.7 | 5.9 | 5.7 |
| December 2013 | 9.9 | 8.7 | 5.9 | 5.6 |
| January 2014 | 10.7 | 8.6 | 5.3 | 5.0 |
| February 2014 | 11.7 | 8.4 | 5.9 | 5.5 |
| March 2014 | 12.0 | 8.7 | 5.9 | 5.5 |
| April 2014 | 10.6 | 8.4 | 6.1 | 5.6 |
| May 2014 | 11.5 | 9.0 | 6.6 | 6.2 |
| June 2014 | 11.4 | 8.9 | 6.2 | 5.8 |
| July 2014 | 11.5 | 9.0 | 6.6 | 6.3 |
| August 2014 | 10.7 | 8.9 | 6.1 | 5.7 |
| September 2014 | 10.4 | 8.8 | 6.4 | 5.8 |
| October 2014 | 10.0 | 8.8 | 6.4 | 5.8 |
| November 2014 | 9.9 | 8.9 | 6.4 | 5.7 |
| December 2014 | 8.4 | 8.9 | 6.6 | 5.8 |
| January 2015 | 7.4 | 9.3 | 6.6 | 5.7 |
| February 2015 | 7.8 | 9.4 | 5.9 | 5.0 |
| March 2015 | 7.1 | 9.1 | 6.8 | 5.6 |
| April 2015 | 7.4 | 9.4 | 6.9 | 5.7 |
| May 2015 | 7.6 | 9.1 | 7.0 | 5.8 |
| June 2015 | 7.8 | 9.0 | 6.9 | 5.7 |
| July 2015 | 7.4 | 9.1 | 7.7 | 6.1 |
| August 2015 | 6.8 | 9.5 | 7.8 | 6.1 |
| September 2015 | 6.4 | 9.6 | 7.6 | 5.9 |
| October 2015 | 6.3 | 9.4 | 7.6 | 5.9 |
| November 2015 | 5.9 | 8.6 | 8.0 | 6.2 |
| December 2015 | 5.8 | 9.1 | 8.4 | 6.3 |
| January 2016 | 5.6 | 9.7 | 9.1 | 6.8 |
| February 2016 | 4.5 | 9.3 | 8.6 | 6.6 |
| March 2016 | 4.3 | 9.4 | 8.1 | 6.4 |
In February, exports fell 6.6% as both energy and non-energy exports declined. Volumes of energy products, motor vehicles and parts, forestry products and building and packaging materials, and consumer goods were all down after advancing in January. Exports declined a further 4.8% in March on broad-based declines across commodities.
Automotive shipments supported manufacturing sales in late 2015
Total manufacturing sales were 1.9% higher in the second half of 2015 than in the first half of the year, as shipments of durable goods strengthened. Transportation equipment and wood products supported the increase in durables. Sales of motor vehicle manufacturers increased from October to January, partly reflecting the production of higher value models. Sales of non-durables edged down 0.4% in the second half of the year, as gains among food manufacturers (+3.6%) were offset by lower sales from petroleum and coal product manufacturers (-10.5%).
Manufacturers in Ontario, on stronger automotive shipments, supported overall gains in manufacturing in late 2015 and into the new year. Shipments in Alberta continued to trend lower, as receipts from petroleum and coal manufacturing weighed on sales.
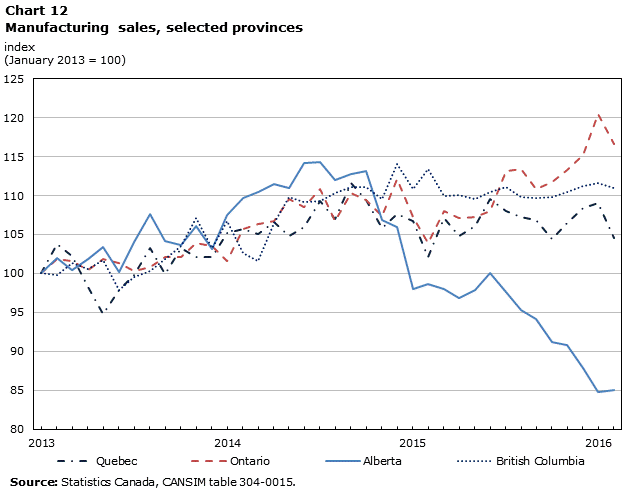
Description for Chart 12
| Quebec | Ontario | Alberta | British Columbia | |
|---|---|---|---|---|
| January 2013 | 100.0 | 100.0 | 100.0 | 100.0 |
| February 2013 | 103.7 | 101.8 | 102.0 | 99.8 |
| March 2013 | 102.2 | 101.6 | 100.4 | 101.3 |
| April 2013 | 98.3 | 100.4 | 101.9 | 100.5 |
| May 2013 | 94.8 | 101.9 | 103.4 | 101.7 |
| June 2013 | 97.9 | 101.3 | 100.2 | 97.9 |
| July 2013 | 99.8 | 100.3 | 104.0 | 99.5 |
| August 2013 | 103.2 | 100.9 | 107.6 | 100.3 |
| September 2013 | 99.9 | 102.1 | 104.2 | 101.9 |
| October 2013 | 103.3 | 102.1 | 103.6 | 103.6 |
| November 2013 | 102.1 | 103.9 | 106.0 | 107.1 |
| December 2013 | 102.1 | 103.5 | 103.2 | 103.3 |
| January 2014 | 105.2 | 101.6 | 107.6 | 106.8 |
| February 2014 | 105.7 | 105.7 | 109.6 | 102.6 |
| March 2014 | 105.1 | 106.4 | 110.5 | 101.6 |
| April 2014 | 106.7 | 106.7 | 111.5 | 106.5 |
| May 2014 | 104.9 | 109.5 | 111.0 | 109.8 |
| June 2014 | 105.9 | 108.5 | 114.2 | 109.2 |
| July 2014 | 109.3 | 110.8 | 114.3 | 109.3 |
| August 2014 | 107.1 | 106.7 | 112.0 | 110.3 |
| September 2014 | 111.6 | 110.3 | 112.8 | 111.1 |
| October 2014 | 109.4 | 109.4 | 113.2 | 111.2 |
| November 2014 | 105.9 | 107.4 | 106.8 | 109.6 |
| December 2014 | 107.7 | 112.1 | 105.9 | 114.1 |
| January 2015 | 106.8 | 107.2 | 98.0 | 110.8 |
| February 2015 | 102.1 | 104.0 | 98.6 | 113.5 |
| March 2015 | 107.1 | 108.0 | 98.0 | 109.9 |
| April 2015 | 104.8 | 107.1 | 96.9 | 110.0 |
| May 2015 | 106.1 | 107.2 | 97.8 | 109.6 |
| June 2015 | 109.5 | 108.1 | 100.0 | 110.5 |
| July 2015 | 108.1 | 113.2 | 97.6 | 111.1 |
| August 2015 | 107.3 | 113.4 | 95.3 | 109.8 |
| September 2015 | 106.8 | 110.9 | 94.2 | 109.7 |
| October 2015 | 104.4 | 111.7 | 91.1 | 109.8 |
| November 2015 | 106.5 | 113.3 | 90.8 | 110.5 |
| December 2015 | 108.4 | 115.2 | 87.9 | 111.2 |
| January 2016 | 109.0 | 120.5 | 84.7 | 111.6 |
| February 2016 | 104.6 | 116.6 | 85.0 | 111.0 |
For 2015 as a whole, Canadian manufacturing sales were down 1.5%, reflecting a 29% decline in the annual sales of petroleum and coal products manufacturers. Excluding petroleum and coal, annual manufacturing sales increased 2.7% in 2015. Shipments of motor vehicle manufactures rose 8.8% in 2015, compared to 5.7% in the previous year.
Retail sales increased in early 2016
Total retail sales were 2.7% higher in the last six months of 2015 than in the first half of the year, as sales at motor vehicle and parts dealers, food and beverage stores, and general merchandise stores supported the gain. Excluding sales at gasoline stations, retail sales increased 3.0% during the last half of the year. Sales in Ontario and British Columbia supported the growth in retail spending, while sales in Alberta and Saskatchewan remained below levels reported in mid 2014.
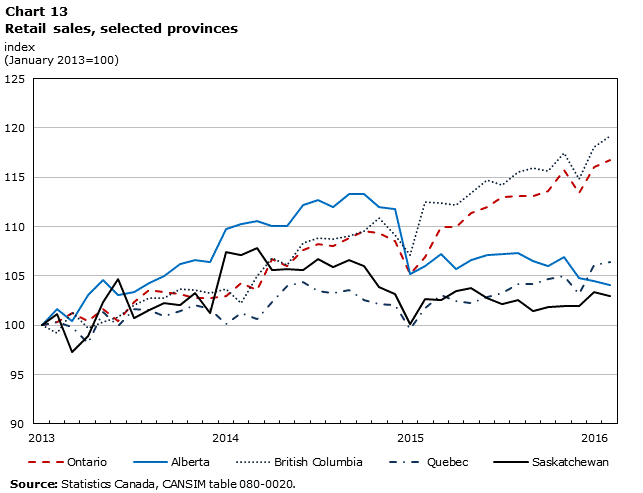
Description for Chart 13
| Ontario | Alberta | British Columbia | Quebec | Saskatchewan | |
|---|---|---|---|---|---|
| January 2013 | 100 | 100 | 100 | 100 | 100 |
| February 2013 | 100.4 | 101.7 | 99.3 | 100.3 | 101.1 |
| March 2013 | 101.3 | 100.5 | 101.3 | 99.8 | 97.3 |
| April 2013 | 100.4 | 103.1 | 99.7 | 98.2 | 98.9 |
| May 2013 | 101.6 | 104.6 | 100.4 | 101.3 | 102.4 |
| June 2013 | 100.4 | 103.1 | 100.8 | 100.0 | 104.7 |
| July 2013 | 102.4 | 103.3 | 102.1 | 101.6 | 100.8 |
| August 2013 | 103.6 | 104.2 | 102.7 | 101.5 | 101.5 |
| September 2013 | 103.3 | 105.0 | 102.7 | 101.0 | 102.2 |
| October 2013 | 103.2 | 106.2 | 103.7 | 101.5 | 102.1 |
| November 2013 | 102.8 | 106.6 | 103.6 | 102.0 | 103.3 |
| December 2013 | 102.8 | 106.4 | 103.3 | 101.7 | 101.2 |
| January 2014 | 103.0 | 109.7 | 103.7 | 100.1 | 107.4 |
| February 2014 | 104.3 | 110.3 | 102.2 | 101.3 | 107.1 |
| March 2014 | 103.6 | 110.6 | 105.0 | 100.7 | 107.9 |
| April 2014 | 106.7 | 110.0 | 106.8 | 102.4 | 105.6 |
| May 2014 | 106.0 | 110.1 | 106.1 | 104.0 | 105.7 |
| June 2014 | 107.6 | 112.2 | 108.4 | 104.4 | 105.6 |
| July 2014 | 108.3 | 112.7 | 108.8 | 103.5 | 106.7 |
| August 2014 | 108.0 | 112.0 | 108.7 | 103.3 | 105.9 |
| September 2014 | 108.8 | 113.3 | 109.0 | 103.5 | 106.6 |
| October 2014 | 109.5 | 113.3 | 109.6 | 102.5 | 106.0 |
| November 2014 | 109.3 | 112.0 | 110.9 | 102.1 | 103.9 |
| December 2014 | 108.5 | 111.7 | 109.2 | 102.0 | 103.2 |
| January 2015 | 105.2 | 105.2 | 107.1 | 99.6 | 100.2 |
| February 2015 | 106.9 | 106.0 | 112.5 | 101.8 | 102.6 |
| March 2015 | 109.9 | 107.3 | 112.4 | 103.1 | 102.6 |
| April 2015 | 110.0 | 105.7 | 112.2 | 102.4 | 103.5 |
| May 2015 | 111.3 | 106.6 | 113.4 | 102.3 | 103.8 |
| June 2015 | 112.0 | 107.2 | 114.7 | 102.9 | 102.8 |
| July 2015 | 113.0 | 107.3 | 114.3 | 103.3 | 102.1 |
| August 2015 | 113.1 | 107.3 | 115.6 | 104.2 | 102.6 |
| September 2015 | 113.1 | 106.5 | 116.0 | 104.1 | 101.4 |
| October 2015 | 113.6 | 106.0 | 115.6 | 104.7 | 101.8 |
| November 2015 | 115.8 | 106.9 | 117.5 | 105.0 | 101.9 |
| December 2015 | 113.4 | 104.8 | 114.8 | 103.1 | 101.9 |
| January 2016 | 116.0 | 104.4 | 118.1 | 106.1 | 103.4 |
| February 2016 | 116.8 | 104.1 | 119.2 | 106.4 | 103.0 |
Sales at motor vehicle and parts dealers trended higher into early 2016, and, as of February 2016, have increased in 12 of the last 13 months. Measured year-over-year, unit sales of new motor vehicles rose 8.9% in Febuary, bolstered by increases in Ontario, Quebec and British Columbia.Note 1 In Alberta, new vehicle unit sales, measured year-over-year, posted double-digit percentage declines from May to January.
Multi-family dwellings supported housing starts
Monthly housing starts averaged 203,400 units (seasonally adjusted at annual rates) in the second half of 2015, up from 183,900 during the first six months of the year. Average monthly starts during the second half increased in Ontario and Quebec and declined in Alberta.
Ground-breaking on new homes slowed into 2016 on lower multi-family starts in Ontario. Starts rebounded in February and March as apartments and apartment condominiums strengthened following modest increases during the previous two months. Gains in Toronto supported starts in February and March. Starts in Alberta continued to slow in early 2016 as apartments and apartment condominiums moderated.
Total starts edged down to 191,500 in April, from 202,400 in March.
Investments in new housing construction shifted increasingly towards apartments and apartment condominiums in the second half of 2015. Investment spending on single units, measured year-over-year, declined from June 2015 to February 2016. In the twelve months to February 2016, investment spending on single units was down 4.3%, while capital spending on double units was down 18.1%. In contrast, capital outlays on apartments and apartment condominiums increased 24.8% in the twelve months to February, and have increased in double-digits, year-over-year, for ten consecutive months.
Monthly residential building permits averaged $4.5 billion during the last six months of the year, compared to $4.4 billion in the first half of 2015. Measured year-over-year, new home prices edged up towards the end of 2015, supported by higher prices in Ontario and British Columbia. New home prices in Toronto rose 4.4% in the twelve months to February, while prices in Vancouver increased 4.0%. New home prices in Calgary, measured year-over-year, have declined since August 2015.
Consumer prices for durable goods increased in late 2015
CPI annual inflation edged up in late 2015 as the downward contribution from lower energy prices moderated. The headline Consumer Price Index (CPI), measured year over year, increased from 1.0% in October 2015 to 2.0% in January 2016. Excluding energy, annual inflation averaged 2.1% in the last half of 2015.
Food prices continued to support increases in the CPI during the second half of the year. Prices for fresh fruit and fresh vegetables increased in late 2015, up 13.2% and 13.3% respectively in the twelve months to December.
The downward contribution from lower gasoline prices, measured year-over-year, moderated in late 2015. Gasoline prices in January 2016 were 2.1% higher than in January 2015, marking the first year-over-year increase in the gasoline index since October 2014.
Prices for durable goods, measured year-over-year, increased into 2016, and were up 3.4% in the twelve months to January. Prices for passenger vehicles rose 5.0% in the twelve months to February, the largest year-over-year increase since September 2010.

Description for Chart 14
| Durable goods | Non-durable goods | Services | |
|---|---|---|---|
| January 2007 | -2.0 | -0.4 | 3.0 |
| February 2007 | -1.8 | 2.5 | 3.2 |
| March 2007 | -1.7 | 3.5 | 3.2 |
| April 2007 | -1.5 | 2.1 | 3.3 |
| May 2007 | -1.1 | 2.4 | 3.2 |
| June 2007 | -0.5 | 2.2 | 3.3 |
| July 2007 | -0.5 | 0.9 | 3.7 |
| August 2007 | -1.1 | -0.1 | 3.8 |
| September 2007 | -0.9 | 2.9 | 3.6 |
| October 2007 | -2.0 | 3.2 | 3.5 |
| November 2007 | -3.0 | 3.8 | 3.4 |
| December 2007 | -3.2 | 3.4 | 3.5 |
| January 2008 | -4.2 | 3.9 | 3.3 |
| February 2008 | -5.2 | 2.8 | 3.5 |
| March 2008 | -5.2 | 1.7 | 3.3 |
| April 2008 | -4.8 | 3.0 | 3.3 |
| May 2008 | -6.1 | 4.8 | 3.7 |
| June 2008 | -6.4 | 7.3 | 3.7 |
| July 2008 | -6.4 | 8.9 | 3.6 |
| August 2008 | -5.8 | 9.1 | 3.5 |
| September 2008 | -6.3 | 9.2 | 3.4 |
| October 2008 | -6.2 | 6.6 | 3.4 |
| November 2008 | -3.0 | 2.9 | 3.3 |
| December 2008 | -3.7 | 0.8 | 3.1 |
| January 2009 | -5.3 | 0.8 | 3.0 |
| February 2009 | -3.6 | 1.6 | 2.8 |
| March 2009 | -4.3 | 1.1 | 2.8 |
| April 2009 | -4.3 | -1.7 | 2.5 |
| May 2009 | -2.6 | -2.6 | 2.2 |
| June 2009 | -2.0 | -3.3 | 2.0 |
| July 2009 | -1.9 | -5.4 | 1.8 |
| August 2009 | -2.3 | -4.3 | 1.7 |
| September 2009 | -3.1 | -4.7 | 1.8 |
| October 2009 | -1.7 | -2.6 | 1.8 |
| November 2009 | -2.8 | 1.6 | 1.5 |
| December 2009 | -2.6 | 2.9 | 1.4 |
| January 2010 | 0.3 | 3.4 | 1.8 |
| February 2010 | 0.0 | 2.1 | 2.0 |
| March 2010 | 0.0 | 2.5 | 1.5 |
| April 2010 | 0.6 | 3.5 | 1.6 |
| May 2010 | 0.1 | 2.2 | 1.6 |
| June 2010 | -0.5 | 0.6 | 1.7 |
| July 2010 | -0.9 | 2.9 | 2.4 |
| August 2010 | -0.6 | 2.6 | 2.2 |
| September 2010 | 0.7 | 2.9 | 2.1 |
| October 2010 | 0.7 | 4.1 | 2.3 |
| November 2010 | 0.0 | 2.8 | 2.6 |
| December 2010 | -0.1 | 4.1 | 2.5 |
| January 2011 | -0.5 | 3.9 | 2.6 |
| February 2011 | -0.9 | 4.3 | 2.2 |
| March 2011 | -0.1 | 6.0 | 2.9 |
| April 2011 | -1.3 | 7.3 | 2.7 |
| May 2011 | -1.0 | 7.6 | 2.8 |
| June 2011 | -2.9 | 7.4 | 2.6 |
| July 2011 | -2.0 | 6.6 | 2.1 |
| August 2011 | -1.3 | 6.7 | 2.4 |
| September 2011 | -0.9 | 6.5 | 2.7 |
| October 2011 | -0.3 | 6.2 | 2.2 |
| November 2011 | -0.7 | 5.7 | 2.2 |
| December 2011 | -1.7 | 4.4 | 2.2 |
| January 2012 | -0.7 | 4.6 | 2.2 |
| February 2012 | -1.0 | 4.9 | 2.3 |
| March 2012 | -0.9 | 2.9 | 2.3 |
| April 2012 | 0.1 | 1.8 | 2.5 |
| May 2012 | -0.3 | 0.7 | 2.2 |
| June 2012 | 0.5 | 0.7 | 2.2 |
| July 2012 | -0.1 | 0.7 | 2.0 |
| August 2012 | -0.2 | 1.6 | 1.8 |
| September 2012 | -0.7 | 1.7 | 1.6 |
| October 2012 | -0.7 | 1.6 | 1.6 |
| November 2012 | -1.4 | 0.7 | 1.6 |
| December 2012 | -0.8 | 0.4 | 1.6 |
| January 2013 | -1.0 | -0.2 | 1.4 |
| February 2013 | 0.7 | 1.3 | 1.5 |
| March 2013 | 0.0 | 0.7 | 1.3 |
| April 2013 | -0.8 | 0.0 | 0.9 |
| May 2013 | -1.4 | 0.9 | 1.1 |
| June 2013 | 0.2 | 1.8 | 1.2 |
| July 2013 | 0.4 | 1.8 | 1.4 |
| August 2013 | -0.4 | 0.7 | 1.5 |
| September 2013 | 0.0 | 0.8 | 1.5 |
| October 2013 | 0.2 | -0.4 | 1.5 |
| November 2013 | -0.8 | 1.0 | 1.5 |
| December 2013 | 0.0 | 1.8 | 1.5 |
| January 2014 | -0.1 | 1.9 | 1.8 |
| February 2014 | -0.2 | 1.0 | 1.8 |
| March 2014 | 0.6 | 2.3 | 1.7 |
| April 2014 | 0.4 | 3.5 | 2.0 |
| May 2014 | 0.7 | 3.9 | 2.1 |
| June 2014 | 0.5 | 3.8 | 2.1 |
| July 2014 | 0.1 | 3.2 | 2.1 |
| August 2014 | 0.7 | 2.6 | 2.4 |
| September 2014 | -0.5 | 2.7 | 2.4 |
| October 2014 | -0.1 | 3.2 | 2.4 |
| November 2014 | 0.4 | 2.0 | 2.0 |
| December 2014 | 0.4 | 0.4 | 2.1 |
| January 2015 | 0.1 | -1.0 | 2.1 |
| February 2015 | -0.7 | -0.9 | 2.3 |
| March 2015 | 0.9 | -1.0 | 2.3 |
| April 2015 | 1.5 | -2.1 | 2.0 |
| May 2015 | 1.9 | -1.5 | 1.9 |
| June 2015 | 2.1 | -0.8 | 1.9 |
| July 2015 | 2.6 | -0.4 | 1.9 |
| August 2015 | 1.8 | -0.2 | 1.8 |
| September 2015 | 2.1 | -1.4 | 1.9 |
| October 2015 | 1.8 | -0.8 | 1.9 |
| November 2015 | 2.0 | 0.1 | 1.8 |
| December 2015 | 2.7 | 1.2 | 1.7 |
| January 2016 | 3.4 | 2.5 | 1.7 |
| February 2016 | 3.4 | 0.4 | 1.6 |
| March 2016 | 2.4 | 0.1 | 1.8 |
The headline all-items rate decelerated to 1.4% in February on lower gasoline prices. CPI annual inflation was 1.3% in March.
Equities declined on energy and metals
After gains early in 2015, Toronto stock prices (S&P/TSX composite index) declined throughout much of the year. Equities at year end were down 16.7% from their all-time high in August 2014. The consumer staples index advanced during 2015, while energy, diversified metals and mining, and gold declined. The Canadian energy index at year end was down about 50% from August 2014, while the diversified metals and mining index was down about 60%.
The S&P/TSX composite index declined 1.4% in January as the diversified metals, and mining and energy indexes traded lower. However, the composite index increased 0.3% in February and 4.9% in March, the largest monthly gain since October 2011. Gains in March were broad based with notable increases in the diversified metals and mining and energy indexes.
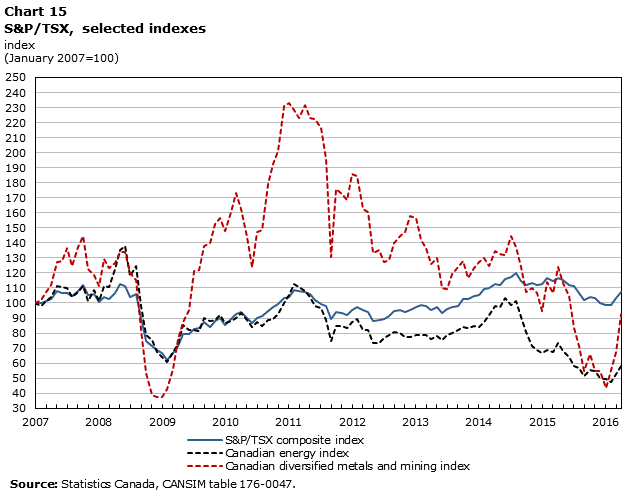
Description for Chart 15
| S&P/TSX composite index | Canadian energy index | Canadian diversified metals and mining index | |
|---|---|---|---|
| January 2007 | 100.0 | 100.0 | 100.0 |
| February 2007 | 100.1 | 98.1 | 102.2 |
| March 2007 | 101.0 | 101.2 | 107.5 |
| April 2007 | 102.9 | 103.7 | 112.2 |
| May 2007 | 107.8 | 111.1 | 127.0 |
| June 2007 | 106.7 | 110.7 | 127.7 |
| July 2007 | 106.4 | 109.8 | 136.8 |
| August 2007 | 104.8 | 104.0 | 124.3 |
| September 2007 | 108.2 | 107.4 | 137.2 |
| October 2007 | 112.2 | 111.6 | 144.4 |
| November 2007 | 105.0 | 101.5 | 122.8 |
| December 2007 | 106.1 | 108.7 | 118.6 |
| January 2008 | 100.9 | 101.1 | 111.4 |
| February 2008 | 104.2 | 111.0 | 129.6 |
| March 2008 | 102.4 | 110.9 | 123.3 |
| April 2008 | 106.9 | 122.4 | 126.7 |
| May 2008 | 112.9 | 135.5 | 133.6 |
| June 2008 | 111.0 | 137.7 | 133.8 |
| July 2008 | 104.3 | 118.1 | 120.2 |
| August 2008 | 105.7 | 124.6 | 115.5 |
| September 2008 | 90.2 | 97.9 | 82.0 |
| October 2008 | 74.9 | 78.5 | 53.6 |
| November 2008 | 71.1 | 75.6 | 38.5 |
| December 2008 | 69.0 | 67.2 | 37.5 |
| January 2009 | 66.7 | 63.7 | 37.6 |
| February 2009 | 62.3 | 61.0 | 43.0 |
| March 2009 | 66.9 | 67.2 | 55.8 |
| April 2009 | 71.5 | 72.9 | 76.0 |
| May 2009 | 79.6 | 85.0 | 87.6 |
| June 2009 | 79.6 | 82.2 | 95.6 |
| July 2009 | 82.8 | 81.7 | 121.1 |
| August 2009 | 83.4 | 81.1 | 121.7 |
| September 2009 | 87.4 | 89.7 | 138.1 |
| October 2009 | 83.7 | 87.9 | 139.9 |
| November 2009 | 87.8 | 88.7 | 152.5 |
| December 2009 | 90.1 | 92.3 | 156.6 |
| January 2010 | 85.1 | 86.4 | 148.0 |
| February 2010 | 89.2 | 87.9 | 160.3 |
| March 2010 | 92.4 | 89.7 | 173.1 |
| April 2010 | 93.7 | 93.1 | 162.7 |
| May 2010 | 90.2 | 88.8 | 143.7 |
| June 2010 | 86.7 | 84.4 | 123.8 |
| July 2010 | 89.9 | 87.6 | 147.4 |
| August 2010 | 91.4 | 84.5 | 148.2 |
| September 2010 | 94.9 | 88.4 | 179.1 |
| October 2010 | 97.3 | 89.4 | 192.5 |
| November 2010 | 99.4 | 92.6 | 201.1 |
| December 2010 | 103.1 | 100.3 | 231.2 |
| January 2011 | 104.0 | 105.6 | 233.4 |
| February 2011 | 108.5 | 112.6 | 228.2 |
| March 2011 | 108.3 | 110.8 | 222.9 |
| April 2011 | 107.0 | 107.9 | 231.5 |
| May 2011 | 105.9 | 104.3 | 223.4 |
| June 2011 | 102.0 | 98.1 | 222.5 |
| July 2011 | 99.3 | 96.4 | 216.2 |
| August 2011 | 98.0 | 88.4 | 195.8 |
| September 2011 | 89.2 | 75.0 | 130.8 |
| October 2011 | 94.0 | 84.9 | 176.1 |
| November 2011 | 93.6 | 85.0 | 172.4 |
| December 2011 | 91.7 | 83.4 | 168.4 |
| January 2012 | 95.5 | 87.5 | 185.6 |
| February 2012 | 97.0 | 89.5 | 184.2 |
| March 2012 | 95.1 | 81.9 | 162.8 |
| April 2012 | 94.3 | 82.0 | 160.7 |
| May 2012 | 88.3 | 73.1 | 133.5 |
| June 2012 | 89.0 | 73.1 | 135.4 |
| July 2012 | 89.5 | 76.6 | 127.5 |
| August 2012 | 91.7 | 78.4 | 128.7 |
| September 2012 | 94.5 | 80.6 | 139.9 |
| October 2012 | 95.3 | 80.4 | 144.7 |
| November 2012 | 93.9 | 77.4 | 147.3 |
| December 2012 | 95.4 | 77.2 | 157.6 |
| January 2013 | 97.3 | 79.0 | 156.3 |
| February 2013 | 98.4 | 78.9 | 141.9 |
| March 2013 | 97.8 | 78.6 | 136.3 |
| April 2013 | 95.6 | 76.4 | 125.8 |
| May 2013 | 97.1 | 78.4 | 129.8 |
| June 2013 | 93.1 | 75.6 | 110.0 |
| July 2013 | 95.8 | 78.9 | 109.5 |
| August 2013 | 97.1 | 80.2 | 119.3 |
| September 2013 | 98.1 | 81.9 | 124.1 |
| October 2013 | 102.5 | 84.0 | 128.1 |
| November 2013 | 102.8 | 83.1 | 116.7 |
| December 2013 | 104.5 | 84.7 | 123.5 |
| January 2014 | 105.1 | 83.9 | 127.1 |
| February 2014 | 109.0 | 87.6 | 130.2 |
| March 2014 | 110.0 | 92.1 | 124.4 |
| April 2014 | 112.4 | 98.3 | 134.5 |
| May 2014 | 112.0 | 97.3 | 132.7 |
| June 2014 | 116.2 | 103.6 | 131.9 |
| July 2014 | 117.6 | 98.6 | 144.7 |
| August 2014 | 119.9 | 101.0 | 137.2 |
| September 2014 | 114.8 | 90.8 | 124.2 |
| October 2014 | 112.1 | 80.9 | 107.2 |
| November 2014 | 113.1 | 71.5 | 110.2 |
| December 2014 | 112.3 | 68.6 | 106.7 |
| January 2015 | 112.6 | 67.1 | 94.8 |
| February 2015 | 116.9 | 68.9 | 113.7 |
| March 2015 | 114.3 | 67.5 | 106.4 |
| April 2015 | 116.8 | 73.5 | 124.0 |
| May 2015 | 115.2 | 68.3 | 113.4 |
| June 2015 | 111.7 | 63.8 | 104.7 |
| July 2015 | 111.0 | 58.1 | 83.1 |
| August 2015 | 106.3 | 56.8 | 71.5 |
| September 2015 | 102.1 | 51.7 | 55.1 |
| October 2015 | 103.8 | 55.6 | 66.4 |
| November 2015 | 103.3 | 55.0 | 54.6 |
| December 2015 | 99.8 | 50.3 | 54.6 |
| January 2016 | 98.4 | 49.3 | 43.3 |
| February 2016 | 98.7 | 47.7 | 55.7 |
| March 2016 | 103.5 | 53.0 | 67.3 |
| April 2016 | 107.0 | 58.1 | 92.6 |
The Canadian dollar continued to depreciate against the U.S dollar in late 2015, ending the year at 73.0 cents U.S.Note 2 Overall, the Canadian dollar depreciated 16% relative to the U.S. dollar during 2015. On a trade-weighted basis, the Canadian dollar was down 10% relative to other major currencies over this period.
The Canadian dollar depreciated to 70.3 cents U.S. in January as prices for crude oil declined early in the year. The dollar traded at 68.69 cents U.S. on January 19th, the lowest value for the Canadian dollar since April 2003. The Canadian dollar appreciated more recently, trading over 79 cents U.S in late April.
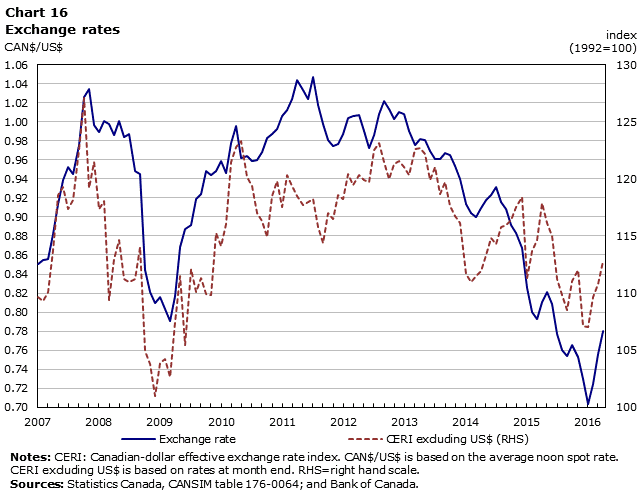
Description for Chart 16
| Exchange rate | CERI excluding US$ (RHS) | |
|---|---|---|
| CAN$/US$ | CAN$/US$ | |
| January 2007 | 0.850 | 109.68 |
| February 2007 | 0.854 | 109.32 |
| March 2007 | 0.856 | 110.11 |
| April 2007 | 0.882 | 113.74 |
| May 2007 | 0.913 | 118.59 |
| June 2007 | 0.939 | 119.26 |
| July 2007 | 0.952 | 117.35 |
| August 2007 | 0.945 | 118.12 |
| September 2007 | 0.975 | 122.63 |
| October 2007 | 1.025 | 127.11 |
| November 2007 | 1.034 | 119.20 |
| December 2007 | 0.997 | 121.49 |
| January 2008 | 0.989 | 117.37 |
| February 2008 | 1.001 | 118.06 |
| March 2008 | 0.998 | 109.43 |
| April 2008 | 0.986 | 112.99 |
| May 2008 | 1.001 | 114.64 |
| June 2008 | 0.984 | 111.23 |
| July 2008 | 0.987 | 110.94 |
| August 2008 | 0.948 | 111.27 |
| September 2008 | 0.945 | 114.01 |
| October 2008 | 0.844 | 104.92 |
| November 2008 | 0.821 | 103.79 |
| December 2008 | 0.810 | 101.03 |
| January 2009 | 0.815 | 103.86 |
| February 2009 | 0.803 | 104.25 |
| March 2009 | 0.791 | 102.69 |
| April 2009 | 0.817 | 107.46 |
| May 2009 | 0.869 | 111.51 |
| June 2009 | 0.888 | 105.43 |
| July 2009 | 0.891 | 112.14 |
| August 2009 | 0.919 | 110.11 |
| September 2009 | 0.924 | 111.28 |
| October 2009 | 0.948 | 109.93 |
| November 2009 | 0.944 | 109.85 |
| December 2009 | 0.948 | 115.30 |
| January 2010 | 0.959 | 114.11 |
| February 2010 | 0.946 | 116.02 |
| March 2010 | 0.978 | 121.50 |
| April 2010 | 0.995 | 122.82 |
| May 2010 | 0.962 | 123.32 |
| June 2010 | 0.963 | 120.15 |
| July 2010 | 0.959 | 119.34 |
| August 2010 | 0.960 | 117.02 |
| September 2010 | 0.968 | 116.27 |
| October 2010 | 0.982 | 114.95 |
| November 2010 | 0.987 | 118.47 |
| December 2010 | 0.992 | 119.83 |
| January 2011 | 1.006 | 117.49 |
| February 2011 | 1.013 | 120.31 |
| March 2011 | 1.024 | 119.38 |
| April 2011 | 1.044 | 118.53 |
| May 2011 | 1.033 | 117.69 |
| June 2011 | 1.024 | 118.01 |
| July 2011 | 1.047 | 118.21 |
| August 2011 | 1.017 | 115.76 |
| September 2011 | 0.997 | 114.38 |
| October 2011 | 0.981 | 117.03 |
| November 2011 | 0.975 | 116.46 |
| December 2011 | 0.977 | 118.55 |
| January 2012 | 0.987 | 118.19 |
| February 2012 | 1.003 | 120.43 |
| March 2012 | 1.006 | 119.44 |
| April 2012 | 1.007 | 120.30 |
| May 2012 | 0.990 | 119.87 |
| June 2012 | 0.973 | 119.74 |
| July 2012 | 0.986 | 122.48 |
| August 2012 | 1.008 | 123.16 |
| September 2012 | 1.022 | 121.44 |
| October 2012 | 1.013 | 119.96 |
| November 2012 | 1.003 | 121.26 |
| December 2012 | 1.011 | 121.58 |
| January 2013 | 1.008 | 121.05 |
| February 2013 | 0.990 | 120.32 |
| March 2013 | 0.976 | 122.64 |
| April 2013 | 0.982 | 122.67 |
| May 2013 | 0.981 | 122.17 |
| June 2013 | 0.969 | 119.87 |
| July 2013 | 0.961 | 121.07 |
| August 2013 | 0.961 | 118.65 |
| September 2013 | 0.967 | 119.73 |
| October 2013 | 0.965 | 117.65 |
| November 2013 | 0.953 | 116.74 |
| December 2013 | 0.940 | 116.14 |
| January 2014 | 0.914 | 111.70 |
| February 2014 | 0.905 | 110.95 |
| March 2014 | 0.900 | 111.53 |
| April 2014 | 0.910 | 111.96 |
| May 2014 | 0.918 | 113.35 |
| June 2014 | 0.923 | 114.85 |
| July 2014 | 0.931 | 114.33 |
| August 2014 | 0.915 | 115.76 |
| September 2014 | 0.908 | 115.98 |
| October 2014 | 0.892 | 116.38 |
| November 2014 | 0.883 | 117.53 |
| December 2014 | 0.867 | 118.41 |
| January 2015 | 0.825 | 111.31 |
| February 2015 | 0.800 | 113.64 |
| March 2015 | 0.792 | 114.61 |
| April 2015 | 0.811 | 117.86 |
| May 2015 | 0.821 | 116.16 |
| June 2015 | 0.809 | 115.00 |
| July 2015 | 0.777 | 111.23 |
| August 2015 | 0.761 | 109.82 |
| September 2015 | 0.754 | 108.54 |
| October 2015 | 0.765 | 111.07 |
| November 2015 | 0.753 | 112.01 |
| December 2015 | 0.730 | 107.13 |
| January 2016 | 0.703 | 107.06 |
| February 2016 | 0.725 | 109.67 |
| March 2016 | 0.756 | 110.76 |
| April 2016 | 0.780 | 112.85 |
Commodity prices fell in late 2015
Commodity prices fell sharply in late 2015 on broad-based declines in both energy and non-energy prices. At year end, the commodity price index was down 31% from December 2014. Excluding energy, commodity prices were down 20% during 2015, as metals and minerals, agriculture, fish, and forestry all declined.
Commodity prices fell in early 2016 before increasing 11.6% in March on higher energy prices. Prices for forestry, agriculture and metals also increased. Prices in March, however, remained 18% below prices twelve months earlier.
The commodity price index increased by 4.0 % in April.

Description for Chart 17
| Total, all commodities | Total excluding energy | Energy | |
|---|---|---|---|
| January 2007 | 100.0 | 100.0 | 100.0 |
| February 2007 | 108.6 | 102.8 | 113.1 |
| March 2007 | 107.8 | 104.3 | 110.5 |
| April 2007 | 113.1 | 108.0 | 117.1 |
| May 2007 | 113.6 | 109.3 | 116.9 |
| June 2007 | 114.2 | 107.6 | 119.5 |
| July 2007 | 112.9 | 105.6 | 118.7 |
| August 2007 | 109.8 | 101.4 | 116.6 |
| September 2007 | 112.9 | 101.6 | 122.2 |
| October 2007 | 119.2 | 102.7 | 133.3 |
| November 2007 | 125.0 | 103.1 | 144.5 |
| December 2007 | 122.9 | 101.3 | 142.0 |
| January 2008 | 127.6 | 105.0 | 148.3 |
| February 2008 | 136.4 | 117.6 | 154.2 |
| March 2008 | 145.4 | 119.3 | 169.2 |
| April 2008 | 153.7 | 118.7 | 185.6 |
| May 2008 | 165.2 | 119.3 | 207.6 |
| June 2008 | 175.6 | 119.6 | 228.4 |
| July 2008 | 171.7 | 119.8 | 220.4 |
| August 2008 | 150.2 | 116.4 | 180.9 |
| September 2008 | 138.3 | 110.4 | 163.7 |
| October 2008 | 110.2 | 95.7 | 124.2 |
| November 2008 | 94.9 | 90.3 | 101.1 |
| December 2008 | 79.3 | 84.4 | 79.1 |
| January 2009 | 81.4 | 87.7 | 80.2 |
| February 2009 | 77.6 | 87.2 | 74.3 |
| March 2009 | 83.1 | 86.9 | 83.5 |
| April 2009 | 82.3 | 87.9 | 81.5 |
| May 2009 | 90.8 | 90.4 | 94.3 |
| June 2009 | 97.9 | 92.0 | 105.8 |
| July 2009 | 92.2 | 90.3 | 96.8 |
| August 2009 | 95.9 | 90.8 | 103.1 |
| September 2009 | 92.9 | 89.0 | 99.2 |
| October 2009 | 101.1 | 90.8 | 112.8 |
| November 2009 | 103.2 | 94.7 | 113.4 |
| December 2009 | 108.4 | 96.3 | 121.7 |
| January 2010 | 114.3 | 98.1 | 131.5 |
| February 2010 | 111.8 | 98.7 | 126.1 |
| March 2010 | 113.3 | 102.4 | 125.7 |
| April 2010 | 115.5 | 106.0 | 126.9 |
| May 2010 | 108.5 | 103.5 | 116.0 |
| June 2010 | 109.3 | 99.2 | 121.0 |
| July 2010 | 109.6 | 101.0 | 120.0 |
| August 2010 | 109.3 | 104.8 | 116.4 |
| September 2010 | 107.4 | 107.4 | 111.1 |
| October 2010 | 113.6 | 109.9 | 120.2 |
| November 2010 | 117.3 | 112.3 | 125.0 |
| December 2010 | 123.7 | 117.2 | 132.8 |
| January 2011 | 126.5 | 122.2 | 134.1 |
| February 2011 | 127.0 | 125.8 | 132.2 |
| March 2011 | 138.5 | 127.2 | 151.9 |
| April 2011 | 146.3 | 129.9 | 164.3 |
| May 2011 | 138.6 | 126.4 | 152.9 |
| June 2011 | 135.3 | 126.6 | 146.5 |
| July 2011 | 137.0 | 129.4 | 147.4 |
| August 2011 | 129.5 | 127.8 | 135.2 |
| September 2011 | 128.3 | 124.3 | 135.6 |
| October 2011 | 125.6 | 119.5 | 134.5 |
| November 2011 | 131.1 | 120.0 | 144.2 |
| December 2011 | 130.7 | 119.4 | 143.9 |
| January 2012 | 128.6 | 122.0 | 137.9 |
| February 2012 | 128.5 | 126.7 | 134.2 |
| March 2012 | 130.6 | 127.6 | 137.1 |
| April 2012 | 130.6 | 126.9 | 137.7 |
| May 2012 | 125.9 | 124.6 | 131.2 |
| June 2012 | 113.6 | 122.9 | 111.2 |
| July 2012 | 119.6 | 123.0 | 121.3 |
| August 2012 | 126.1 | 122.6 | 133.0 |
| September 2012 | 129.0 | 124.3 | 136.9 |
| October 2012 | 124.3 | 123.9 | 128.9 |
| November 2012 | 118.5 | 123.5 | 119.0 |
| December 2012 | 118.8 | 125.5 | 118.3 |
| January 2013 | 121.2 | 123.5 | 123.6 |
| February 2013 | 124.9 | 124.0 | 129.6 |
| March 2013 | 125.7 | 122.2 | 132.2 |
| April 2013 | 126.3 | 120.0 | 134.9 |
| May 2013 | 125.2 | 117.9 | 134.5 |
| June 2013 | 125.8 | 115.2 | 137.5 |
| July 2013 | 129.6 | 113.1 | 146.2 |
| August 2013 | 129.3 | 113.8 | 145.1 |
| September 2013 | 127.4 | 111.8 | 143.3 |
| October 2013 | 121.6 | 110.8 | 133.4 |
| November 2013 | 115.4 | 110.1 | 122.9 |
| December 2013 | 121.9 | 108.0 | 136.2 |
| January 2014 | 123.5 | 109.6 | 137.9 |
| February 2014 | 129.7 | 110.3 | 148.4 |
| March 2014 | 129.2 | 114.6 | 144.3 |
| April 2014 | 130.8 | 115.0 | 146.9 |
| May 2014 | 130.9 | 115.6 | 146.6 |
| June 2014 | 132.8 | 115.4 | 150.0 |
| July 2014 | 129.7 | 118.3 | 142.5 |
| August 2014 | 125.0 | 116.1 | 136.0 |
| September 2014 | 123.1 | 113.3 | 134.5 |
| October 2014 | 115.6 | 112.1 | 122.7 |
| November 2014 | 108.9 | 112.3 | 111.5 |
| December 2014 | 92.1 | 111.3 | 86.2 |
| January 2015 | 80.9 | 109.3 | 69.9 |
| February 2015 | 82.7 | 107.0 | 74.2 |
| March 2015 | 79.8 | 105.8 | 70.1 |
| April 2015 | 84.3 | 105.0 | 78.7 |
| May 2015 | 89.6 | 105.9 | 87.8 |
| June 2015 | 89.4 | 105.8 | 87.5 |
| July 2015 | 81.4 | 103.6 | 74.3 |
| August 2015 | 71.9 | 98.4 | 61.3 |
| September 2015 | 73.7 | 95.3 | 66.2 |
| October 2015 | 73.2 | 95.4 | 65.3 |
| November 2015 | 69.5 | 93.1 | 60.5 |
| December 2015 | 63.6 | 89.5 | 52.8 |
| January 2016 | 59.5 | 89.3 | 45.5 |
| February 2016 | 58.9 | 91.4 | 43.1 |
| March 2016 | 65.7 | 94.2 | 52.9 |
| April 2016 | 68.3 | 94.5 | 57.6 |
Credit market debt to disposable income edged up
Household credit market debt rose 1.2% in the fourth quarter, to $1.92 trillion.Note 3 Household credit market debt to disposable income edged up to 165.4% in the fourth quarter, while the interest-only debt service ratio edged down to 6.2% of disposable income. The more comprehensive debt-service ratio, which includes household payments on both interest and principal owing, increased to 13.8% in the fourth quarter.
Household assets rose to $11.43 trillion in the fourth quarter, up from $11.26 trillion in the third. Increases in the value of mutual fund shares and foreign equity investments, as well as in life insurance and pension fund assets, supported the gain. Household net worth, measured on a per capita basis, increased 1.5% in the fourth quarter to $263,200.
- Date modified: