
Analysis in Brief
Easing revenue growth for service industries in 2024
Text begins
Acknowledgments
The authors would like to thank Jeff Fritzsche, Terilyn Ebert, James Monteith, Brett Dmitruk, Owen Vipond and Racha Mohsen for their contributions.
Introduction
The performance of Canada’s service industries is influenced by shifting economic conditions. Following the COVID-19 pandemic, many sectors experienced a significant surge in revenue in 2021 and 2022, fuelled by the reopening of the economy and pent-up demand. However, the pandemic recovery began losing momentum in 2023 and continued to weaken through 2024 as various factors, including inflationary pressures and financing conditions, slowed growth.
This study focuses on key Canadian service industries, leveraging alternative data sources such as goods and services tax revenue, which is used as an indicator for operating revenue. This method provides timely and valuable insights on business performance before annual financial business survey estimates become available.
In 2024, revenue growth slowed across most industries, compared with 2023 (Chart 1). Industries such as travel arrangement and reservation services, accommodation services, and informatics services, which led revenue growth in 2023, performed much more modestly in 2024, aligning with broader economic trends.
Chart 1 start
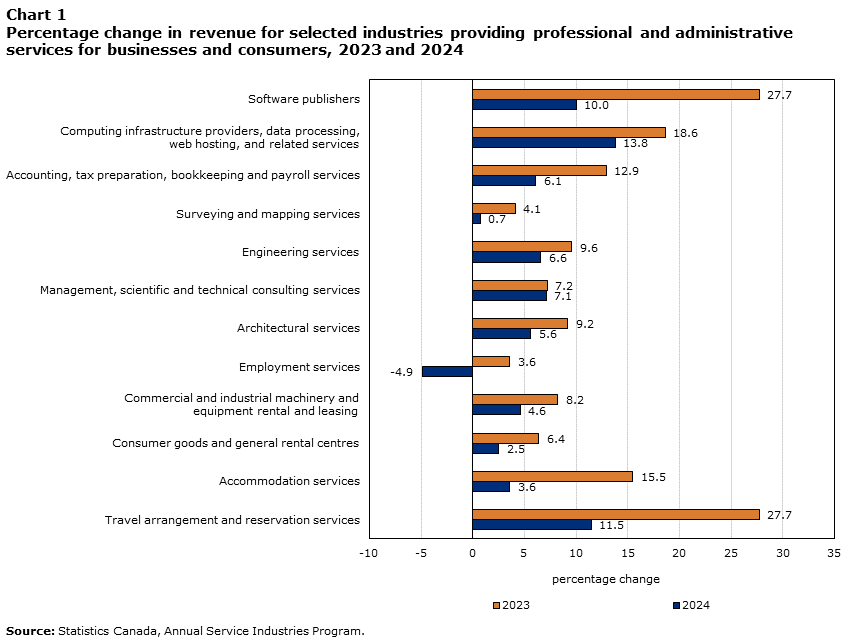
Data table for Chart 1
| 2023 | 2024 | |
|---|---|---|
| percentage change | ||
| Source: Statistics Canada, Annual Service Industries Program. | ||
| Software publishers | 27.7 | 10.0 |
| Computing infrastructure providers, data processing, web hosting, and related services | 18.6 | 13.8 |
| Accounting, tax preparation, bookkeeping and payroll services | 12.9 | 6.1 |
| Surveying and mapping services | 4.1 | 0.7 |
| Engineering services | 9.6 | 6.6 |
| Management, scientific and technical consulting services | 7.2 | 7.1 |
| Architectural services | 9.2 | 5.6 |
| Employment services | 3.6 | -4.9 |
| Commercial and industrial machinery and equipment rental and leasing | 8.2 | 4.6 |
| Consumer goods and general rental centres | 6.4 | 2.5 |
| Accommodation services | 15.5 | 3.6 |
| Travel arrangement and reservation services | 27.7 | 11.5 |
Chart 1 end
Administrative and support services
Travel arrangement and reservation services and accommodation services growth slows
Following robust expansion in 2022 and 2023 because of the easing of pandemic-related travel restrictions, travel demand returned to more moderate growth patterns in 2024. Revenue for accommodation services increased 3.6% in 2024, whereas revenue for travel arrangement and reservation services rose by 11.5%. While domestic travel in Canada has fully rebounded after the pandemic, international tourism expenditures remained below pre-pandemic levels (Chart 2), partly because of global conflicts, which have disrupted routes, availability and prices of commercial flights to Canada.Note
Chart 2 start
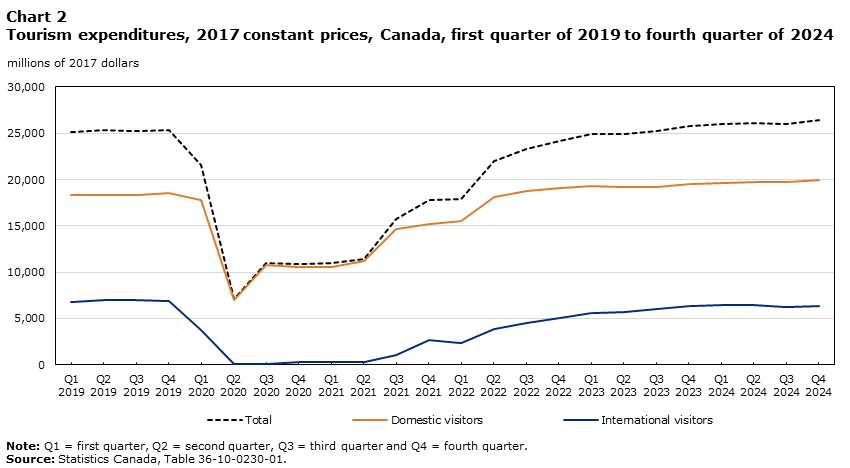
Data table for Chart 2
| Total | Domestic visitors | International visitors | |
|---|---|---|---|
| millions of 2017 dollars | |||
| Note: Q1 = first quarter, Q2 = second quarter, Q3 = third quarter and Q4 = fourth quarter.
Source: Statistics Canada, Table 36-10-0230-01. |
|||
| 2019 | |||
| Q1 | 25,092 | 18,293 | 6,799 |
| Q2 | 25,293 | 18,299 | 6,994 |
| Q3 | 25,279 | 18,314 | 6,965 |
| Q4 | 25,372 | 18,493 | 6,879 |
| 2020 | |||
| Q1 | 21,566 | 17,776 | 3,790 |
| Q2 | 7,136 | 7,043 | 93 |
| Q3 | 10,973 | 10,829 | 144 |
| Q4 | 10,872 | 10,572 | 300 |
| 2021 | |||
| Q1 | 10,951 | 10,606 | 345 |
| Q2 | 11,475 | 11,206 | 269 |
| Q3 | 15,760 | 14,686 | 1,074 |
| Q4 | 17,794 | 15,147 | 2,647 |
| 2022 | |||
| Q1 | 17,934 | 15,549 | 2,385 |
| Q2 | 22,004 | 18,089 | 3,915 |
| Q3 | 23,349 | 18,815 | 4,534 |
| Q4 | 24,189 | 19,112 | 5,077 |
| 2023 | |||
| Q1 | 24,875 | 19,319 | 5,556 |
| Q2 | 24,952 | 19,213 | 5,739 |
| Q3 | 25,221 | 19,234 | 5,987 |
| Q4 | 25,800 | 19,475 | 6,325 |
| 2024 | |||
| Q1 | 25,995 | 19,580 | 6,415 |
| Q2 | 26,111 | 19,691 | 6,420 |
| Q3 | 25,994 | 19,730 | 6,264 |
| Q4 | 26,388 | 19,987 | 6,401 |
Chart 2 end
Employment services constrained by easing labour market pressures
The performance of the employment services industry is closely tied to broader labour market trends, with the job vacancy rate serving as the key indicator for labour demand in the economy. Businesses in the employment services industry, which provide expertise in supplying temporary staff, placing applicants and providing human resource management services, mostly serve sectors such as natural resources, construction and health care. Given the industry’s reliance on revenue from successfully placing workers in open positions, periods of low vacancies can significantly constrain earnings in the employment services industry. Throughout 2024, job vacancies continued to decline from the record high reached in the second quarter of 2022 (5.6%). By the end of 2024, the job vacancy rate had fallen to 3.1%, indicating increasing slack in the labour market (Chart 3). Given the changing labour market conditions, following three years of growth, revenue in the employment services industry declined by 4.9% in 2024.
Chart 3 start

Data table for Chart 3
| Reference period | Payroll employees | Job vacancies | Job vacancy rate |
|---|---|---|---|
| thousands | percentage | ||
| Note: Q1 = first quarter, Q2 = second quarter, Q3 = third quarter and Q4 = fourth quarter.
Source: Statistics Canada, Table 14-10-0400-01. |
|||
| 2021 | |||
| Q1 | 15,182 | 603 | 3.8 |
| Q2 | 15,418 | 690 | 4.3 |
| Q3 | 15,797 | 884 | 5.3 |
| Q4 | 16,153 | 940 | 5.5 |
| 2022 | |||
| Q1 | 16,306 | 948 | 5.5 |
| Q2 | 16,567 | 984 | 5.6 |
| Q3 | 16,768 | 958 | 5.4 |
| Q4 | 16,909 | 883 | 5.0 |
| 2023 | |||
| Q1 | 17,012 | 835 | 4.7 |
| Q2 | 17,082 | 776 | 4.3 |
| Q3 | 17,165 | 709 | 4.0 |
| Q4 | 17,196 | 674 | 3.8 |
| 2024 | |||
| Q1 | 17,214 | 640 | 3.6 |
| Q2 | 17,275 | 577 | 3.2 |
| Q3 | 17,300 | 548 | 3.1 |
| Q4 | 17,325 | 548 | 3.1 |
Chart 3 end
Professional business services
Several factors influenced engineering services growth
Fuelled by rising prices for business services and ongoing major projects, engineering services experienced revenue growth of 6.6% in 2024, down from the increase of 9.6% in 2023. The price of engineering services has been rising strongly since the end of the pandemic and gained 5.2% in 2024.Note In 2022 and 2023, the top revenue-generating projects were in petroleum and petrochemical; commercial, public and institutional building engineering projects; and transportation engineering projects.Note Projects in these areas typically span several years and likely continued to drive growth in engineering services in 2024. Lower borrowing costs (Chart 4), strong growth in nominal capital expenditures in the oil and gas extraction industries (up 16.1% in 2024),Note and shifting priorities toward net-zero emissions and renewable energy solutions in new industrial building construction have also helped sustain demand for engineering services.
Chart 4 start
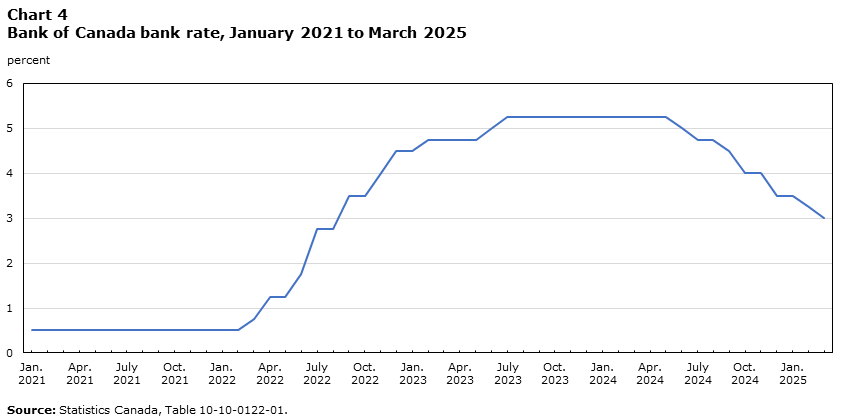
Data table for Chart 4
| Month | Percent |
|---|---|
| Source: Statistics Canada, Table 10-10-0122-01. | |
| 2021 | |
| January | 0.50 |
| February | 0.50 |
| March | 0.50 |
| April | 0.50 |
| May | 0.50 |
| June | 0.50 |
| July | 0.50 |
| August | 0.50 |
| September | 0.50 |
| October | 0.50 |
| November | 0.50 |
| December | 0.50 |
| 2022 | |
| January | 0.50 |
| February | 0.50 |
| March | 0.75 |
| April | 1.25 |
| May | 1.25 |
| June | 1.75 |
| July | 2.75 |
| August | 2.75 |
| September | 3.50 |
| October | 3.50 |
| November | 4.00 |
| December | 4.50 |
| 2023 | |
| January | 4.50 |
| February | 4.75 |
| March | 4.75 |
| April | 4.75 |
| May | 4.75 |
| June | 5.00 |
| July | 5.25 |
| August | 5.25 |
| September | 5.25 |
| October | 5.25 |
| November | 5.25 |
| December | 5.25 |
| 2024 | |
| January | 5.25 |
| February | 5.25 |
| March | 5.25 |
| April | 5.25 |
| May | 5.25 |
| June | 5.00 |
| July | 4.75 |
| August | 4.75 |
| September | 4.50 |
| October | 4.00 |
| November | 4.00 |
| December | 3.50 |
| 2025 | |
| January | 3.50 |
| February | 3.25 |
| March | 3.00 |
Chart 4 end
Architectural services affected by moderate growth in business investments
Declining interest rates in 2024 eased pressure on housing affordability; however, demand in the housing sector remained relatively weak, particularly among first-time homebuyers. Therefore, revenue growth for architectural services stood at 5.6% in 2024, slower than in 2023 (+9.2%) and 2022 (+10.7%). Architectural services comprise establishments engaged in planning and designing the construction of residential, commercial and industrial buildings, as well as the development of land for projects such as parks, highways and land subdivisions. Growth for the industry was primarily driven by residential construction investment and non-residential government investment (Chart 5). Housing starts increased by 2.1% in 2024 to 245,367 units, following declines in 2022 and 2023.Note
Chart 5 start
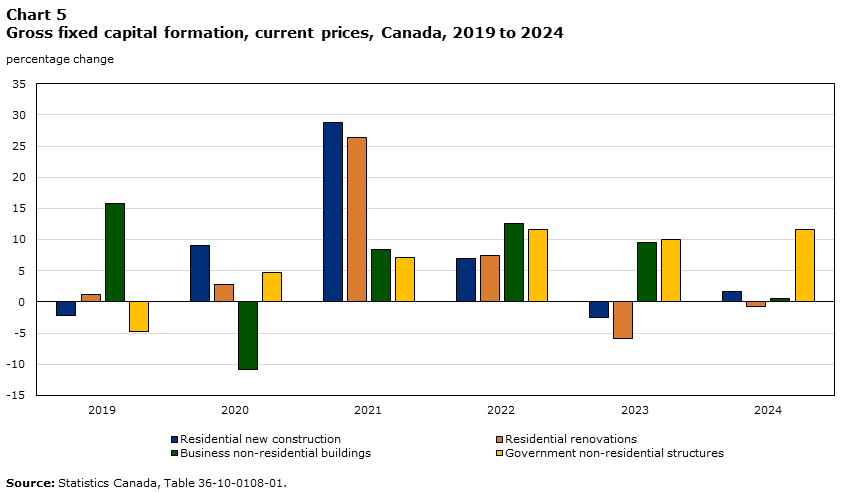
Data table for Chart 5
| 2019 | 2020 | 2021 | 2022 | 2023 | 2024 | |
|---|---|---|---|---|---|---|
| percentage change | ||||||
| Source: Statistics Canada, Table 36-10-0108-01. | ||||||
| Residential new construction | -2.2 | 9.1 | 28.7 | 6.9 | -2.5 | 1.7 |
| Residential renovations | 1.2 | 2.8 | 26.3 | 7.5 | -6.0 | -0.7 |
| Business non-residential buildings | 15.8 | -10.9 | 8.4 | 12.6 | 9.4 | 0.6 |
| Government non-residential structures | -4.8 | 4.7 | 7.1 | 11.6 | 10.0 | 11.5 |
Chart 5 end
Revenue growth in the surveying and mapping services industry has been following a similar trend through to 2024. After rising 4.1% in 2023, revenue in the industry saw more moderate growth in 2024 (+0.7%). Despite consistent demand, growth has been limited by workforce shortages because of an aging labour force in that industry, difficulties in attracting and retaining young workers,Note and mild increases in the surveying and mapping services price index.Note
Steady demand for other professional services
Businesses and governments continue to rely on consulting and accounting services to navigate financial challenges, management concerns and the growing influence of technology. Revenue for management, scientific and technical consulting services experienced growth of 7.1% in 2024, maintaining a similar pace to 2023 (+7.2%).
Revenue for accounting, tax preparation, bookkeeping and payroll services grew 6.1% in 2024, compared with a 12.9% gain in 2023.
Rental and leasing services
Slow expansion for rental and leasing services
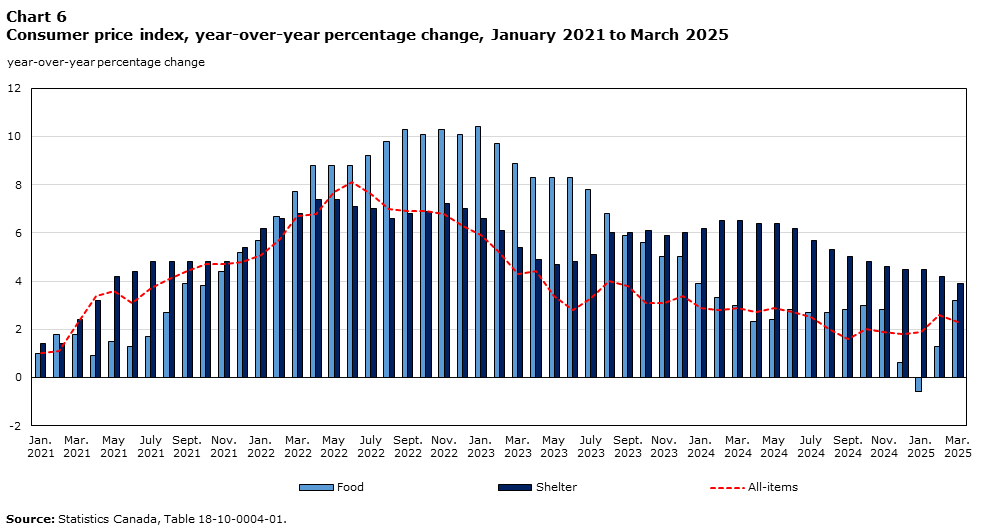
Revenue growth for consumer goods and general rental centres slowed to 2.5% in 2024, down from 6.4% in 2023 and 17.0% in 2022. Businesses in these industry groups rent and lease a range of equipment, from household appliances to party supplies. Revenue growth may have been limited by the weak increase in housing starts in 2024,Note which eased the demand for certain rental commodities, such as appliances and hot water tanks. However, lower inflationary pressures (Chart 6) may have made consumers less cautious with discretionary spending, creating some demand for non-essential rental items.
Chart 6 start
Data table for Chart 6
| Date | All-items | Food | Shelter |
|---|---|---|---|
| year-over-year percentage change | |||
| Source: Statistics Canada, Table 18-10-0004-01. | |||
| 2021 | |||
| January | 1.0 | 1.0 | 1.4 |
| February | 1.1 | 1.8 | 1.4 |
| March | 2.2 | 1.8 | 2.4 |
| April | 3.4 | 0.9 | 3.2 |
| May | 3.6 | 1.5 | 4.2 |
| June | 3.1 | 1.3 | 4.4 |
| July | 3.7 | 1.7 | 4.8 |
| August | 4.1 | 2.7 | 4.8 |
| September | 4.4 | 3.9 | 4.8 |
| October | 4.7 | 3.8 | 4.8 |
| November | 4.7 | 4.4 | 4.8 |
| December | 4.8 | 5.2 | 5.4 |
| 2022 | |||
| January | 5.1 | 5.7 | 6.2 |
| February | 5.7 | 6.7 | 6.6 |
| March | 6.7 | 7.7 | 6.8 |
| April | 6.8 | 8.8 | 7.4 |
| May | 7.7 | 8.8 | 7.4 |
| June | 8.1 | 8.8 | 7.1 |
| July | 7.6 | 9.2 | 7.0 |
| August | 7.0 | 9.8 | 6.6 |
| September | 6.9 | 10.3 | 6.8 |
| October | 6.9 | 10.1 | 6.9 |
| November | 6.8 | 10.3 | 7.2 |
| December | 6.3 | 10.1 | 7.0 |
| 2023 | |||
| January | 5.9 | 10.4 | 6.6 |
| February | 5.2 | 9.7 | 6.1 |
| March | 4.3 | 8.9 | 5.4 |
| April | 4.4 | 8.3 | 4.9 |
| May | 3.4 | 8.3 | 4.7 |
| June | 2.8 | 8.3 | 4.8 |
| July | 3.3 | 7.8 | 5.1 |
| August | 4.0 | 6.8 | 6.0 |
| September | 3.8 | 5.9 | 6.0 |
| October | 3.1 | 5.6 | 6.1 |
| November | 3.1 | 5.0 | 5.9 |
| December | 3.4 | 5.0 | 6.0 |
| 2024 | |||
| January | 2.9 | 3.9 | 6.2 |
| February | 2.8 | 3.3 | 6.5 |
| March | 2.9 | 3.0 | 6.5 |
| April | 2.7 | 2.3 | 6.4 |
| May | 2.9 | 2.4 | 6.4 |
| June | 2.7 | 2.8 | 6.2 |
| July | 2.5 | 2.7 | 5.7 |
| August | 2.0 | 2.7 | 5.3 |
| September | 1.6 | 2.8 | 5.0 |
| October | 2.0 | 3.0 | 4.8 |
| November | 1.9 | 2.8 | 4.6 |
| December | 1.8 | 0.6 | 4.5 |
| 2025 | |||
| January | 1.9 | -0.6 | 4.5 |
| February | 2.6 | 1.3 | 4.2 |
| March | 2.3 | 3.2 | 3.9 |
Chart 6 end
Revenue for commercial and industrial machinery and equipment rental and leasing rose by 4.6% in 2024, down from 8.2% growth in 2023. Operations in this industry differ from those in consumer goods and general rental centres, as this industry often serves only businesses. Growth in this industry was driven by higher investment in the oil and gas extraction industry, alongside government infrastructure projects that supported demand.Note However, the completion of major investment projects, such as the Trans Mountain Expansion Project in May 2024, may have weighed on revenue growth for the industry.Note
Informatics services
Slowing growth for software publishers and computing infrastructure providers, data processing, web hosting, and related services
In 2024, businesses reported that technology adoption was the leading driver in improving operational efficiency. Demand for informatics services has been fuelled by the growing integration of artificial intelligence (AI), especially in the information and cultural industries; professional, scientific and technical services; and finance and insurance.Note As a result, revenue for software publishers rose by 10.0% in 2024, while computing infrastructure providers, data processing, web hosting, and related services saw an increase of 13.8%. However, these growth rates were more subdued compared with 2023 (+27.7% and +18.6%, respectively).
Concluding remarks
In 2024, revenue growth in key service industries eased as the Canadian economy recovered from the pandemic’s immediate effects.
Looking forward
Trade volatility, particularly between Canada and the United States, and economic uncertainty could introduce new challenges and opportunities for many service industries in 2025. The travel industries may see shifts in demand as consumers adjust their travel habits amid policy changes between Canada and the United States. In March 2025, the number of Canadians returning from trips to the United States by automobile was down 31.9% compared with the same month of 2024,Note while the number of those returning by air also declined significantly.
Amid these uncertainties, many Canadian businesses maintain a somewhat positive outlook on their future expectations. According to the second quarter of 2025 Canadian Survey on Business Conditions, 70.0% of businesses are either very optimistic or somewhat optimistic about their outlook over the next 12 months, down from 73.1% in the first quarter of 2025 survey. This is the lowest percentage observed since the first quarter of 2024. When asked about the most challenging obstacle they will face in the next three months, businesses reported inflation, cost of inputs and recruiting skilled employees.Note
- Date modified: