
Analysis in Brief
Analysis on interprovincial trade in Canada, third quarter of 2023
Skip to text
Text begins
In July 2017, the Canadian Free Trade Agreement (CFTA) came into force. The main objective of the CFTA is to reduce and eliminate, to the greatest extent possible, barriers to the free movement of labour, goods, services, and investments within Canada and to establish an open, efficient, and stable domestic marketNote . Interprovincial trade represents roughly one-fifth of the country’s annual gross domestic productNote . Despite the implementation of this agreement, some obstacles still exist and hinder the ability of businesses to circulate goods or services from one Canadian jurisdiction to another.
From the beginning of July to early August 2023, Statistics Canada conducted the Canadian Survey on Business Conditions to better understand the current environment in which businesses in Canada are operating and their expectations moving forward. For this iteration of the survey, data were collected from businesses in Canada who sold or purchased goods or services across provincial and territorial borders and the obstacles they faced when conducting interprovincial trade. The reasons behind businesses deciding not to purchase or sell goods or services across provincial and territorial borders were also captured in this iteration. The key findings are presented in this article.
In general, the likelihood of businesses conducting interprovincial trade over the last 12 months differs by business characteristics such as sector, number of employees, and location. Among businesses that conducted interprovincial trade, transportation cost and availability was reported as the top obstacle encountered. Meanwhile, among businesses that did not purchase or sell goods or services across provincial or territorial borders over the last 12 months, the local nature of the business and a lack of interest were reported as the main reasons that businesses did not engage in interprovincial trade.
Likelihood of conducting interprovincial trade differs by sector, size of business and location
While nearly one in four businesses purchased goods or services from suppliers (24.9%) or sold goods or services to customers (22.0%) in another province or territory over the last 12 months, the likelihood of a business conducting interprovincial trade varied by sector and number of employees. More than three in five businesses in wholesale trade (62.2%) purchased goods or services from suppliers in another province or territory, followed by just over half (51.0%) in manufacturing and more than two in five (42.0%) in retail trade. Businesses in wholesale trade (63.0%) and manufacturing (46.7%) were also most likely to have sold goods or services to customers in another province or territory over the last 12 months, followed by 39.5% in information and cultural industries.
| Business purchased goods or services from suppliers in another province or territory | |
|---|---|
| Industry | % of businesses |
| Wholesale trade | 62.2 |
| Manufacturing | 51.0 |
| Retail trade | 42.0 |
| Information and cultural industries | 36.4 |
| Arts, entertainment and recreation | 29.6 |
| Source: Canadian Survey on Business Conditions, third quarter of 2023 (Table 33-10-0695-01) | |
| Business sold goods or services to customers in another province or territory | |
|---|---|
| Industry | % of businesses |
| Wholesale trade | 63.0 |
| Manufacturing | 46.7 |
| Information and cultural industries | 39.5 |
| Professional, scientific and technical services | 31.5 |
| Transportation and warehousing | 30.8 |
| Source: Canadian Survey on Business Conditions, third quarter of 2023 (Table 33-10-0695-01) | |
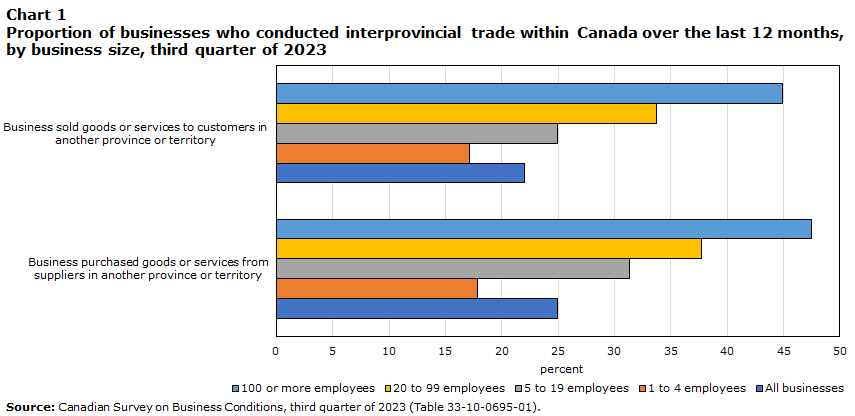
The larger the business, the more likely it was to conduct interprovincial trade. Nearly half (47.5%) of businesses with 100 or more employees purchased goods or services from suppliers in another province or territory over the last 12 months, compared to under one in five (17.8%) businesses with 1 to 4 employees. The same trend can be observed for businesses who sold goods or services to customers in another province or territory over the same period, with businesses with 100 or more employees (44.9%) being more likely to do so than businesses with 1 to 4 employees (17.1%).
Chart 1 start
Data table for Chart 1
| Business purchased goods or services from suppliers in another province or territory | Business sold goods or services to customers in another province or territory | |
|---|---|---|
| percent | ||
| All businesses | 24.9 | 22.0 |
| 1 to 4 employees | 17.8 | 17.1 |
| 5 to 19 employees | 31.3 | 24.9 |
| 20 to 99 employees | 37.7 | 33.7 |
| 100 or more employees | 47.5 | 44.9 |
| Source: Canadian Survey on Business Conditions, third quarter of 2023 (Table 33-10-0695-01). | ||
Chart 1 end
The likelihood of businesses conducting interprovincial trade over the last 12 months also differed by location. Businesses in the Northwest Territories (28.9%) and New Brunswick (27.8%) were most likely to sell goods or services to customers in another province or territory while those in Nunavut (18.2%) and Newfoundland and Labrador (17.7%) were the least likely. Given the nature of their respective economies, territories and smaller provinces relied more heavily on purchasing goods or services from suppliers located outside their jurisdiction compared to larger provinces. For instance, close to half of businesses in the Northwest Territories (51.0%) and Nunavut (50.5%) purchased goods or services from suppliers in another province or territory compared to nearly one in five businesses in Quebec (21.7%) and Ontario (20.6%) who reported the same.
| Business purchased goods or services from suppliers in another province or territory | Business sold goods or services to customers in another province or territory | |
|---|---|---|
| % of businesses | ||
| Canada | 24.9 | 22.0 |
| Newfoundland and Labrador | 32.4 | 17.7 |
| Prince Edward Island | 42.1 | 25.3 |
| Nova Scotia | 38.4 | 25.6 |
| New Brunswick | 33.8 | 27.8 |
| Quebec | 21.7 | 18.4 |
| Ontario | 20.6 | 21.6 |
| Manitoba | 34.1 | 25.8 |
| Saskatchewan | 34.8 | 25.6 |
| Alberta | 27.3 | 24.8 |
| British Columbia | 29.0 | 22.6 |
| Yukon | 41.3 | 21.5 |
| Northwest Territories | 51.0 | 28.9 |
| Nunavut | 50.5 | 18.2 |
| Source: Canadian Survey on Business Conditions, third quarter of 2023 (Table 33-10-0695-01) | ||
Transportation cost and availability top obstacle for businesses conducting interprovincial trade
Among businesses that sold goods or services to customers or purchased goods or services from suppliers in another province or territory over the last 12 months, over half (52.1%) reported that they encountered some obstacles. More than two in five (41.3%) businesses cited transportation cost and availability as a challenge, by far the most commonly faced obstacle, followed by distance between point of origin and destination reported by 10.9% of businesses. In fact, transportation cost and availability was the most commonly faced obstacle for businesses engaged in interprovincial trade across all industries, with over half of businesses in construction (57.6%); agriculture, forestry, fishing and hunting (53.3%); retail trade (52.6%) as well as in wholesale trade (51.8%) experiencing this challenge over the last 12 months. On the other hand, nearly half (47.9%) of all businesses reported that they did not encounter any obstacles when conducting interprovincial trade.
Of businesses who reported transportation cost and availability as an obstacle when conducting interprovincial trade over the last 12 months, one-quarter (25.4%) reported it as a major obstacle. Meanwhile, over one in four businesses (26.5%) described it as a minor obstacle and close to half (46.1%) reported it as a moderate obstacle.
Businesses with 100 or more employees (35.6%) were less likely than all businesses (41.3%) to have experienced transportation cost and availability as an obstacle when purchasing or selling goods or services across provincial and territorial borders over the last 12 months. Meanwhile, businesses with 5 to 19 employees (45.0%) were the most likely to report this obstacle, followed by businesses with 20 to 99 employees (43.6%) and businesses with 1 to 4 employees (37.8%).
When looking at the level of impact challenges related to transportation cost and availability had on the ability of businesses to conduct interprovincial trade, nearly three in four (71.5%) businesses reported it as a major or moderate obstacle. Businesses with 1 to 4 employees (74.1%) were the most likely to cite transportation cost and availability as a major or moderate obstacle. On the other hand, businesses with 20 to 99 employees (64.5%) were the least likely to report this challenge as having a major or moderate impact on their ability to purchase or sell goods or services across provincial and territorial borders.
| Major impact | Moderate impact | Minor impact | No impact at all | |
|---|---|---|---|---|
| % of businesses | ||||
| All businesses | 25.4 | 46.1 | 26.5 | 2.0 |
| 1 to 4 employees | 25.8 | 48.3 | 22.3 | 3.6 |
| 5 to 19 employees | 24.2 | 47.8 | 26.9 | 1.0 |
| 20 to 99 employees | 28.4 | 36.1 | 34.9 | 0.7 |
| 100 or more employees | 16.8 | 53.7 | 27.7 | 1.9 |
|
Note: Respondents were asked if the business or organization sold goods or services to customers, or purchased goods or services from suppliers in another province or territory over the last 12 months. If they reported either, they were asked which obstacles were experienced when purchasing or selling goods or services across provincial and territorial borders. If the respondent reported at least one obstacle, with the exception of "Distance between point of origin and destination", they were asked to report the level of impact each of the obstacles had. Source: Canadian Survey on Business Conditions, third quarter of 2023 (Table 33-10-0697-01) |
||||
Majority of businesses not conducting interprovincial trade due to local nature of business and lack of interest
Among Canadian businesses, nearly two in three (65.2%) businesses did not purchase or sell goods or services across provincial and territorial borders over the last 12 months. Three-fifths (59.7%) of these businesses reported that the local nature of the business was the reason they did not conduct any interprovincial trade activities. Businesses in health care and social assistance (70.3%) were most likely to report the local nature of their business as the reason for not purchasing or selling goods or services across provincial and territorial borders, followed by manufacturing (69.3%); finance and insurance (63.8%); arts, entertainment and recreation (63.1%); and accommodation and food services (63.0%).
Moreover, nearly one in three (31.7%) businesses cited having no interest as the reason for not engaging in interprovincial trade. Businesses in professional, scientific and technical services (37.9%), construction (36.8%) and transportation and warehousing (34.4%) were the most likely to report a lack of interest in purchasing or selling goods or services across provincial and territorial borders.
| Industry | Local nature of the business | No interest in purchasing or selling across provincial and territorial borders |
|---|---|---|
| % of businesses | ||
| All businesses | 59.7 | 31.7 |
| Agriculture, forestry, fishing and hunting | 57.7 | 30.2 |
| Mining, quarrying, and oil and gas extraction | 50.1 | 29.9 |
| Construction | 57.9 | 36.8 |
| Manufacturing | 69.3 | 16.2 |
| Wholesale trade | 57.2 | 27.9 |
| Retail trade | 54.9 | 30.9 |
| Transportation and warehousing | 51.0 | 34.4 |
| Information and cultural industries | 61.3 | 32.2 |
| Finance and insurance | 63.8 | 31.2 |
| Real estate and rental and leasing | 60.7 | 29.3 |
| Professional, scientific and technical services | 53.4 | 37.9 |
| Administrative and support, waste management and remediation services | 60.4 | 31.8 |
| Health care and social assistance | 70.3 | 25.7 |
| Arts, entertainment and recreation | 63.1 | 27.9 |
| Accommodation and food services | 63.0 | 31.3 |
| Other services (except public administration) | 60.7 | 29.6 |
|
Note: Respondents were asked if the business or organization sold goods or services to customers in another province or territory, or purchased goods or services from suppliers in another province or territory over the last 12 months. If they reported that they did not, they were asked the reasons why. Source: Canadian Survey on Business Conditions, third quarter of 2023 (Table 33-10-0698-01) |
||
Furthermore, businesses with 20 to 99 employees (70.0%) and those with 100 or more employees (66.9%) were more likely to report the local nature of their business as the reason for not conducting interprovincial trade over the last 12 months. On the other hand, smaller businesses were more likely to report having no interest in purchasing or selling across provincial and territorial borders, with nearly one in three businesses with 1 to 4 employees (33.9%) and businesses with 5 to 19 employees (29.4%) citing this reason.
| Business size | Local nature of the business | No interest in purchasing or selling across provincial and territorial borders |
|---|---|---|
| % of businesses | ||
| All businesses | 59.7 | 31.7 |
| 1 to 4 employees | 57.7 | 33.9 |
| 5 to 19 employees | 60.7 | 29.4 |
| 20 to 99 employees | 70.0 | 24.7 |
| 100 or more employees | 66.9 | 25.3 |
|
Note: Respondents were asked if the business or organization sold goods or services to customers in another province or territory, or purchased goods or services from suppliers in another province or territory over the last 12 months. If they reported that they did not, they were asked the reasons why. Source: Canadian Survey on Business Conditions, third quarter of 2023 (Table 33-10-0698-01) |
||
Methodology
From July 4 to August 8, 2023, representatives from businesses across Canada were invited to complete an online questionnaire about business conditions and business expectations moving forward. The Canadian Survey on Business Conditions uses a stratified random sample of business establishments with employees. Data is available at the national, provincial and territorial levels by industrial sector, employment size, type of business and majority ownership. An estimation of proportions is conducted using calibrated weights to calculate the population totals in the domains of interest. The total sample size for this iteration of the survey is 30,634 and the results are based on responses from a total of 15,224 businesses or organizations.
References
Statistics Canada. 2023. Canadian Survey on Business Conditions, third quarter of 2023.
- Date modified: