
Analysis in Brief
Analysis on labour challenges in Canada, second quarter of 2023
Skip to text
Text begins
Signs of the labour market easing in Canada have been seen in the recent reports on job vacancies and the employment rate. Employment rose by 41,000 (0.2%) in April 2023, driven by part time work.Note 1 The number of vacant jobs decreased to 815,295 in March 2023, the lowest level seen since July 2021.Note 2 Meanwhile, the unemployment rate has remained unchanged at 5.0% since December 2022.Note 1 Average weekly earnings increased 1.8% year-over-year in February 2023Note 3, while the Consumer Price Index increased 4.4% in April 2023, year-over-year.Note 4
From the beginning of April to early May 2023, Statistics Canada conducted the Canadian Survey on Business Conditions (CSBC) to better understand the current environment that businesses in Canada are operating in and their expectations moving forward. This article provides insights on labour-related challenges faced by businesses across Canada and how these businesses plan to move forward given these challenges.
Based on CSBC results, rising inflation, shortage of labour force, and retaining and recruiting skilled employees are the leading challenges businesses expect to face short term. In turn, businesses plan on increasing the hours of work for management and current employees to mitigate these labour obstacles.
Rising inflation is the leading obstacle expected by businesses
Almost three-fifths (56.0%) of businesses in Canada expected rising inflation to be an obstacle over the next three months. With the Consumer Price Index rising to 4.4% year over year in April 2023, after a 4.3% increase in March 2023Note 4, businesses are faced with the challenges inflation brings. Businesses with 5 to 19 employees (63.5%) were most likely to expect rising inflation to be an obstacle for their business, followed by businesses with 20 to 99 employees (55.2%) and 1 to 4 employees (52.4%). Larger businesses with 100 or more employees were least likely to expect obstacles related to rising inflation (44.2%).
Average hourly wages rose 5.2% in April 2023, making the average rate $33.38 an hour.Note 1 Nearly half (47.6%) of businesses in Canada plan to raise wages of existing employees over the next year, an increase from the first quarter of 2023 (42.5%).
Over two-thirds (68.5%) of businesses in manufacturing and nearly three-fifths of businesses in administrative and support, waste management and remediation services (59.9%) and accommodation and food services (58.2%) plan to increase the wages of their existing employees over the next year.
When considering businesses that expect rising inflation to be an obstacle over the next three months, businesses in accommodation and food services (68.4%) were the most likely to anticipate this as a challenge, followed by over three-fifths of businesses in agriculture, forestry, fishing and hunting (65.7%) and retail trade (63.8%).
| Sector | Businesses that expect rising inflation to be an obstacle over the next three months | Businesses that plan to increase wages offered to existing employees over the next year |
|---|---|---|
| percent | ||
| Agriculture, forestry, fishing and hunting | 65.7 | 39.3 |
| Mining, quarrying, and oil and gas extraction | 60.1 | 27.5 |
| Construction | 51.3 | 42.0 |
| Manufacturing | 59.3 | 68.5 |
| Wholesale trade | 60.8 | 47.1 |
| Retail trade | 63.8 | 50.9 |
| Transportation and warehousing | 60.2 | 29.4 |
| Information and cultural industries | 51.6 | 34.5 |
| Finance and insurance | 30.6 | 42.2 |
| Real estate and rental and leasing | 52.3 | 42.3 |
| Professional, scientific and technical services | 45.4 | 43.8 |
| Administrative and support, waste management and remediation services | 62.5 | 59.9 |
| Health care and social assistance | 52.8 | 47.6 |
| Arts, entertainment and recreation | 54.7 | 54.1 |
| Accommodation and food services | 68.4 | 58.2 |
| Other services (except public administration) | 60.5 | 55.8 |
|
Note: Respondents were asked from April 3 to May 8, 2023 their expectations on various obstacles over the next three months. Therefore, the three month period could range from April 3 to August 8, 2023 depending on when the business responded. Source: Statistics Canada. Canadian Survey on Business Conditions, second quarter of 2023 (Tables 33-10-0666-01 and 33-10-0679-01). |
||
Shortage of labour begins to ease among businesses
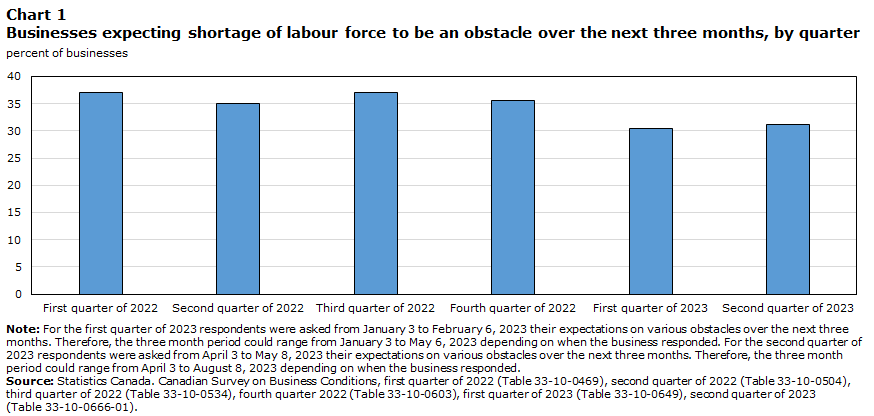
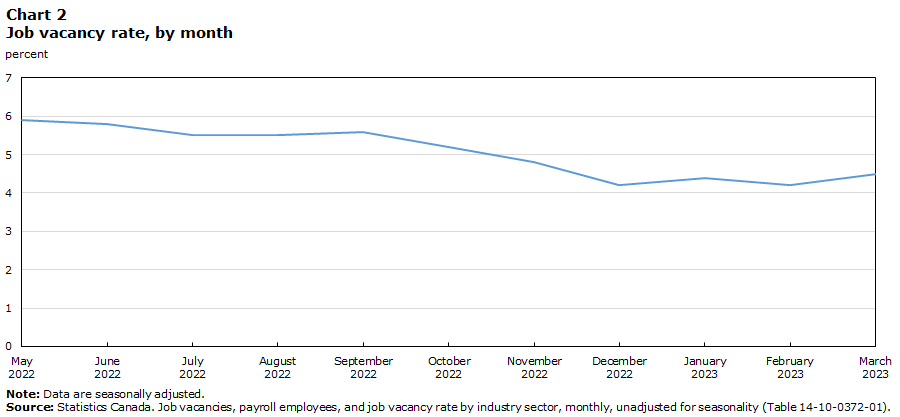
Since the first quarter of 2022 the proportion of businesses expecting a shortage of labour to be an obstacle over the next three months has seen a downward trend from 37.0% to 30.4% in the first quarter of 2023. Job vacancies have been on the decline with 815,295 vacant positions as of March 2023 across Canada, the lowest since July 2021 (808,085).Note 2 In the second quarter of 2023, however, the proportion of businesses expecting shortage of labour to be an obstacle over the next three months increased slightly to 31.1%. More than half (50.5%) of businesses with 20 to 99 employees anticipate shortage of labour to be an obstacle over the next three months, while over two-fifths of businesses with 5 to 19 employees (43.6%) and 100 or more employees (42.0%) expected the same. Comparatively, less than one-fifth (19.4%) of businesses with 1 to 4 employees expect to face this obstacle.
Based on the Job Vacancy and Wage Survey (JVWS) from March 2023, accommodation and food services continued to have the highest job vacancy rate across all sectors (7.6%). Consistent with these findings, businesses in accommodation and food services (52.0%) remain the most likely to expect a shortage in labour over the next three months, followed by businesses in manufacturing (43.8%), administrative and support, waste management and remediation services (37.6%) and health care and social assistance (35.1%). Over half (55.4%) of businesses in accommodation and food services expect that their number of vacant positions will stay the same over the next three months. The number of vacancies in accommodation and food services as of March 2023 was 109,075 and the job vacancy rate in this sector was 7.6%, little changed from February 2023 (8.0%).Note 2 The job vacancy rate for accommodation and food services remained the highest among all sectors in March 2023.Note 2 As depicted in Charts 1 and 2, the trend in the proportion of businesses expecting shortages of labour over the last several quarters mirrors the trend for job vacancies (as measured by the JVWS) over the same period of time.
Data table for Chart 1
| Percent of businesses | |
|---|---|
| First quarter of 2022 | 37.0 |
| Second quarter of 2022 | 35.0 |
| Third quarter of 2022 | 37.1 |
| Fourth quarter of 2022 | 35.5 |
| First quarter of 2023 | 30.4 |
| Second quarter of 2023 | 31.1 |
|
Note: For the first quarter of 2023 respondents were asked from January 3 to February 6, 2023 their expectations on various obstacles over the next three months. Therefore, the three month period could range from January 3 to May 6, 2023 depending on when the business responded. For the second quarter of 2023 respondents were asked from April 3 to May 8, 2023 their expectations on various obstacles over the next three months. Therefore, the three month period could range from April 3 to August 8, 2023 depending on when the business responded. Source: Statistics Canada. Canadian Survey on Business Conditions, first quarter of 2022 (Table 33-10-0469), second quarter of 2022 (Table 33-10-0504), third quarter of 2022 (Table 33-10-0534), fourth quarter 2022 (Table 33-10-0603), first quarter of 2023 (Table 33-10-0649), second quarter of 2023 (Table 33-10-0666-01). |
|
Data table for Chart 2
| Percent | |
|---|---|
| May 2022 | 5.9 |
| June 2022 | 5.8 |
| July 2022 | 5.5 |
| August 2022 | 5.5 |
| September 2022 | 5.6 |
| October 2022 | 5.2 |
| November 2022 | 4.8 |
| December 2022 | 4.2 |
| January 2023 | 4.4 |
| February 2023 | 4.2 |
| March 2023 | 4.5 |
|
Note: Data are seasonally adjusted. Source: Statistics Canada. Job vacancies, payroll employees, and job vacancy rate by industry sector, monthly, unadjusted for seasonality (Table 14-10-0372-01). |
|
Recruiting and retaining skilled labour remains a challenge
The proportion of businesses expecting recruiting skilled labour to be an obstacle has been steady over the first quarter into the second quarter of 2023 (from 34.0% to 36.0%). The same is true of the proportion of businesses expecting retaining employees to be an obstacle over the next three months (from 25.2% to 27.3%). Over one-quarter (27.3%) of businesses anticipate challenges in retaining skilled labour in the second quarter of 2023 compared with 25.2% of businesses that reported the same in the first quarter of 2023. Businesses in accommodation and food services (40.1%) were most likely to expect challenges in retaining skilled employees over the next three months, followed by businesses in manufacturing (34.2%). Businesses in manufacturing were most likely to expect difficulties recruiting skilled employees (48.4%), followed by businesses in accommodation and food services (47.1%).
Expectations of difficulty recruiting and retaining skilled employees differed depending on the size of the business. Nearly three-fifths (58.1%) of businesses with 20 to 99 employees expected to face challenges when recruiting skilled employees over the next three months compared with less than half of businesses with 5 to 19 employees (49.7%) and 100 or more employees (49.7%). Furthermore, less than one-quarter (23.1%) of businesses with 1 to 4 employees expected the same.
Nearly half of businesses with 100 or more employees (47.4%) and 20 to 99 employees (47.3%) expect challenges in retaining skilled labour over the next three months. Meanwhile, over one-third (37.1%) of businesses with 5 to 19 employees and 16.7% of businesses with 1 to 4 employees expected the same.

Data table for Chart 3
| Recruiting skilled employees | Retaining skilled employees | |
|---|---|---|
| percent of businesses | ||
| Agriculture, forestry, fishing and hunting | 28.1 | 18.1 |
| Mining, quarrying, and oil and gas extraction | 31.4 | 24.1 |
| Construction | 40.6 | 28.3 |
| Manufacturing | 48.4 | 34.2 |
| Wholesale trade | 34.0 | 25.2 |
| Retail trade | 30.7 | 27.6 |
| Transportation and warehousing | 28.8 | 17.1 |
| Information and cultural industries | 23.9 | 21.6 |
| Finance and insurance | 30.8 | 17.6 |
| Real estate and rental and leasing | 22.5 | 15.9 |
| Professional, scientific and technical services | 30.9 | 24.1 |
| Administrative and support, waste management and remediation services | 40.2 | 32.5 |
| Health care and social assistance | 41.9 | 31.7 |
| Arts, entertainment and recreation | 31.6 | 27.7 |
| Accommodation and food services | 47.1 | 40.1 |
| Other services (except public administration) | 42.9 | 32.7 |
|
Note: Respondents were asked from April 3 to May 8, 2023 their expectations on various obstacles over the next three months. Therefore, the three month period could range from April 3 to August 8, 2023 depending on when the business responded. Source: Statistics Canada. Canadian Survey on Business Conditions, second quarter of 2023 (Table 33-10-0666-01). |
||
Businesses expecting recruiting staff as an obstacle remains steady when compared to 12 months ago
In the second quarter of 2022, nearly two-fifths (36.9%) of businesses expected recruiting skilled employees to be an obstacle over the next three months and over one-quarter (27.6%) expected retaining staff to be an obstacle. One year later in the second quarter of 2023, these proportions are essentially unchanged with 36.0% of businesses expecting recruiting staff as an obstacle and 27.3% expecting retaining staff as an obstacle over the next three months.
Businesses in manufacturing were the most likely to expect challenges recruiting staff and these levels have remained unchanged when compared to 2022. In the second quarter of 2023, nearly half (48.4%) of businesses in manufacturing expected recruiting skilled employees to be an obstacle, compared with 47.4% in the second quarter of 2022. Nearly half (47.1%) of businesses in accommodation and food services expected recruiting staff to be an obstacle in the second quarter of 2023, compared with 46.3% of businesses in the second quarter of 2022.
Two-fifths (40.1%) of businesses in accommodation and food services expected challenges retaining skilled employees in the second quarter of 2023, a slight decrease from the second quarter of 2022 (42.4%). Manufacturing had the second largest proportion of businesses expecting to face challenges retaining staff (34.2%), a slight increase from the proportion of businesses that expected the same in the second quarter of 2022 (32.3%).Businesses anticipate that management and existing staff will work increased hours to compensate for labour shortages
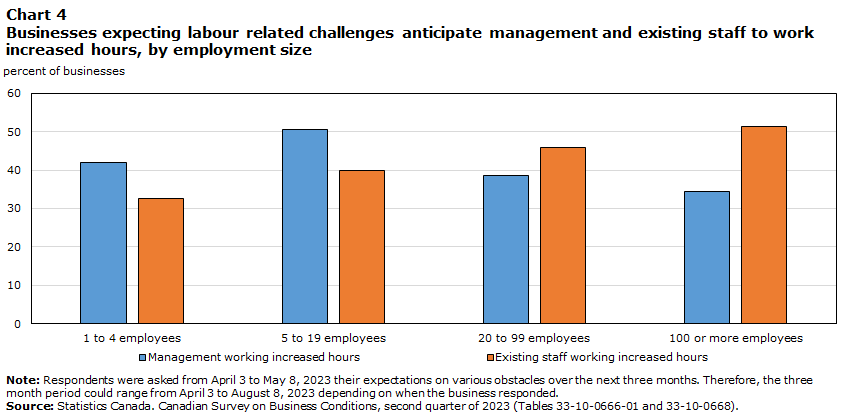
Among businesses that expect a shortage of labour or recruiting or retaining skilled labour to be an obstacle, over two-fifths (44.8%) anticipate management to work increased hours due to these challenges. Additionally, close to two-fifths (38.5%) of businesses expecting obstacles related to shortage of labour, or recruiting or retaining skilled labour anticipate that existing staff would be working increased hours. Larger businesses with 100 or more employees (51.3%) and 20 to 99 employees (45.8%) were more likely than smaller businesses with 5 to 19 employees (39.8%) and 1 to 4 employees (32.6%) to anticipate increased working hours for their existing staff as a result of labour challenges. Businesses in arts, entertainment and recreation (58.7%) were most likely to expect management to work increased hours due to labour challenges. Meanwhile, businesses in professional, scientific and technical services (52.1%) were most likely to anticipate that their existing staff would be working increased hours.
In addition, over one-quarter (27.1%) of businesses expecting labour challenges anticipate these challenges to cause delays in providing orders to customers or cause the business to hire less suitable candidates (36.4%). Furthermore, two-fifths (40.0%) of businesses expecting labour challenges anticipate these obstacles to limit their growth over the next three months.
Data table for Chart 4
| Management working increased hours | Existing staff working increased hours | |
|---|---|---|
| percent of businesses | ||
| 1 to 4 employees | 42.0 | 32.6 |
| 5 to 19 employees | 50.7 | 39.8 |
| 20 to 99 employees | 38.5 | 45.8 |
| 100 or more employees | 34.4 | 51.3 |
|
Note: Respondents were asked from April 3 to May 8, 2023 their expectations on various obstacles over the next three months. Therefore, the three month period could range from April 3 to August 8, 2023 depending on when the business responded. Source: Statistics Canada. Canadian Survey on Business Conditions, second quarter of 2023 (Tables 33-10-0666-01 and 33-10-0668). |
||
Methodology
From April 3 to May 8, 2023, representatives from businesses across Canada were invited to take part in an online questionnaire on business conditions and business expectations moving forward. The Canadian Survey on Business Conditions uses a stratified random sample of business establishments with employees classified by geography, industry sector, and size. An estimation of proportions is done using calibrated weights to calculate the population totals in the domains of interest. The total sample size for this iteration of the survey is 30,554 and results are based on responses from a total of 15,401 businesses or organizations.
References
Statistics Canada. 2023. Canadian Survey on Business Conditions, second quarter of 2023.
Statistics Canada. 2023. Labour Force Survey The Daily, May 5, 2023.
Statistics Canada. 2023. Table 14-10-0406-01 Job vacancies, payroll employees, and job vacancy rate by industry sector, monthly, adjusted for seasonality.
Statistics Canada. 2023. Payroll and employment, earnings and hours, and job vacancies The Daily, April 27, 2023.
Statistics Canada. 2023. Consumer Price Index The Daily, May 16, 2023.
- Date modified: