
Analysis in Brief
The growing share of private short-term rental revenue in the Canadian accommodation services subsector: Trends from 2017 to 2021
Skip to text
Text begins
Acknowledgments
The authors would like to thank Zaid Al-Taie, Larry Arbenser and Dominic Roy for their helpful guidance in the analysis.
Introduction
Empirical studies have presented the influence of private short-term rentals (STRs) on the residential real estate market in Canada,Note but there are knowledge gaps on their importance in the hospitality industry that provides short-term lodging for travellers, vacationers and others. Online platforms have made the practice of booking STRs easy for both travellers and hosts. However, the decentralized nature of these online platforms makes it difficult to gain a clear understanding of the size and scope of this segment of the market and how they compare with those of the accommodation services subsector.
This study therefore leverages STR data from AirDNANote and Statistics Canada’s accommodation services survey data to examine the revenue share of private STRs in the accommodation services subsector from 2017 to 2021 in different Canadian markets.Note
Private STRs have been accounting for a greater share of revenue of the Canadian accommodation services subsector, from an estimated 7.0% in 2017 to 15.2% in 2021. At the provincial and territorial level, Prince Edward Island had the largest share claimed by private STRs for each of the five years, reaching a high of 29.9% of revenue in the accommodation services subsector in 2021. In the larger census metropolitan areas (CMAs), private STRs made up 2.1% of revenue in the accommodation services subsector in Edmonton, while they made up 14.5% of revenue in Montréal in 2021. In tourist markets, private STRs account for a higher proportion of revenue. In Whistler, for example, they represented just under two-thirds of revenue in the accommodation services subsector in 2021.
Furthermore, the COVID-19 pandemic shifted trends and the markets in which STRs grew their share of revenue. During the first two years of the pandemic, STRs expanded their share of revenue in markets outside the larger CMAs. Shifts observed during the health crisis may subside as pre-pandemic levels of travelling resume and new federal tax legislation and stricter municipal and provincial laws govern the supply of STRs in many jurisdictions.
Data and methods
Private STRs are generally defined as privately owned units made available for rent via online platforms in short-term intervals, typically between 1 and 28 days. These short timelines have these rentals competing with traditional commercial accommodations for travellers and differ with the rental and leasing of real estate that operates on monthly and yearly intervals.
The commercial accommodation services industries are made up of business establishments that offer short-term lodging and other complementary services, for leisure and business travellers. These industries include hotels, resorts, bed and breakfasts, and campgrounds, among others.Note
Data covering the private STR market are compiled by AirDNA using web scraping technology to track bookings for the two largest platforms in this market, Airbnb and Vrbo. AirDNA also incorporates partner data from channel managers, property managers and individual hosts.Note Based on an earlier study, Measuring private short-term accommodation in Canada (statcan.gc.ca), it was established that AirDNA data had good coverage as they represented between 84% and 91% of Canada’s STRs for 2017 and 2018, respectively.
Data for the commercial accommodation services industries are available from Statistics Canada’s accommodation services survey, an annual business survey that relies on respondent data and administrative tax data to produce annual estimates of the accommodation services subsector at the national, provincial and territorial levels.Note Subprovincial statistics for the large CMAs and tourist markets, presented in this study, are not generally published and have been produced from custom calculations using the population of businesses that make up the accommodation services survey universe.
Short-term rental national trends from 2017 to 2021
At the national level, the proportion of revenue of private STRs within the accommodation services subsector has more than doubled from 7.0% in 2017 to 15.2% in 2021, the latest year for which commercial accommodation industry data were available (Chart 1).

Data table for Chart 1
| 2017 | 2018 | 2019 | 2020 | 2021 | |
|---|---|---|---|---|---|
| percent | |||||
| Canada | 7.0 | 10.1 | 12.0 | 14.0 | 15.2 |
| Sources: Statistics Canada, custom tabulation from the Annual Survey of Service Industries: Accommodation Services survey and AirDNA. | |||||
The share of revenue of private STRs continued to grow during the pandemic, albeit at a slower pace, despite the decline in revenues. Private STRs outperformed commercial accommodations during the first two years of the pandemic. Revenues for private STRs declined 26.2% in 2020, compared with a drop of 38.1% for commercial accommodations. In 2021, STR revenues bounced back with a 24.0% recovery, compared with a 13.0% recovery for commercial accommodations.
The stronger performance by private STRs in 2020/2021 may be attributable in part to stricter pandemic regulations faced by commercial accommodation services industries and a change in consumer behaviour away from larger establishments and urban centres with higher population density.Note
Short-term rental provincial and territorial trends from 2017 to 2021
At the provincial and territorial level, Prince Edward Island had the largest revenue share claimed by private STRs in the accommodation services subsector in all five years—from 2017 to 2021—with a high of 29.9% in 2021. British Columbia had the next largest share, at 20.0%, with Nova Scotia showing a similar share of 19.9%, in 2021. The central provinces round out the top five with revenue shares of 19.7% in Quebec and 18.5% in Ontario (Chart 2).
Apart from British Columbia, the private STR revenue share of the accommodation services subsector is much higher in the eastern half of Canada. Alberta’s private STR revenue share was nearly four times smaller than that of British Columbia despite the former having several recreational destinations. This is perhaps influenced by the higher costs of real estate in British Columbia and the need for supplemental rental income.Note
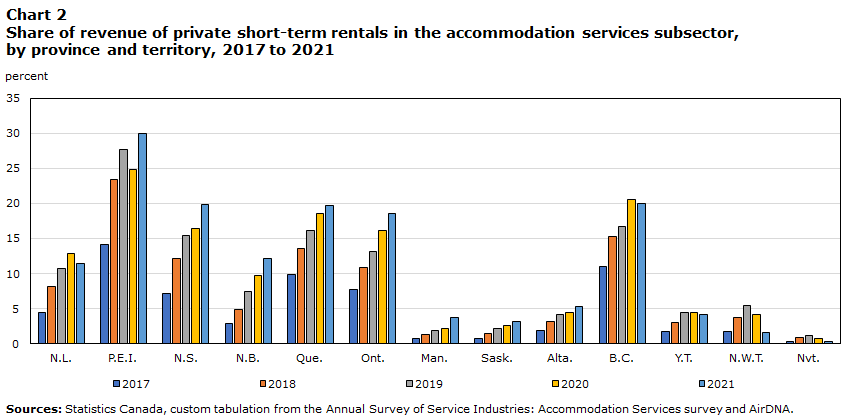
Data table for Chart 2
| 2017 | 2018 | 2019 | 2020 | 2021 | |
|---|---|---|---|---|---|
| percent | |||||
| N.L. | 4.5 | 8.1 | 10.7 | 12.9 | 11.4 |
| P.E.I. | 14.1 | 23.4 | 27.7 | 24.8 | 29.9 |
| N.S. | 7.2 | 12.2 | 15.4 | 16.4 | 19.9 |
| N.B. | 2.9 | 4.9 | 7.4 | 9.7 | 12.2 |
| Que. | 9.9 | 13.5 | 16.1 | 18.6 | 19.7 |
| Ont. | 7.7 | 10.8 | 13.1 | 16.1 | 18.5 |
| Man. | 0.7 | 1.3 | 1.9 | 2.2 | 3.8 |
| Sask. | 0.7 | 1.4 | 2.2 | 2.6 | 3.1 |
| Alta. | 1.9 | 3.1 | 4.2 | 4.4 | 5.3 |
| B.C. | 11.0 | 15.3 | 16.7 | 20.5 | 20.0 |
| Y.T. | 1.8 | 3.0 | 4.5 | 4.5 | 4.2 |
| N.W.T. | 1.7 | 3.7 | 5.5 | 4.1 | 1.6 |
| Nvt. | 0.3 | 0.9 | 1.2 | 0.8 | 0.3 |
| Sources: Statistics Canada, custom tabulation from the Annual Survey of Service Industries: Accommodation Services survey and AirDNA. | |||||
Short-term rental market in census metropolitan areas and tourist markets
The subprovincial markets in this study include a national representation of 11 CMAs .Note In addition to large urban centres, five of the most notable tourist markets are presented.Note
Among the CMAs in 2021, private STRs made up 2.1% of total accommodation services subsector revenue in Edmonton while they accounted for 14.5% in Montréal (Chart 3).
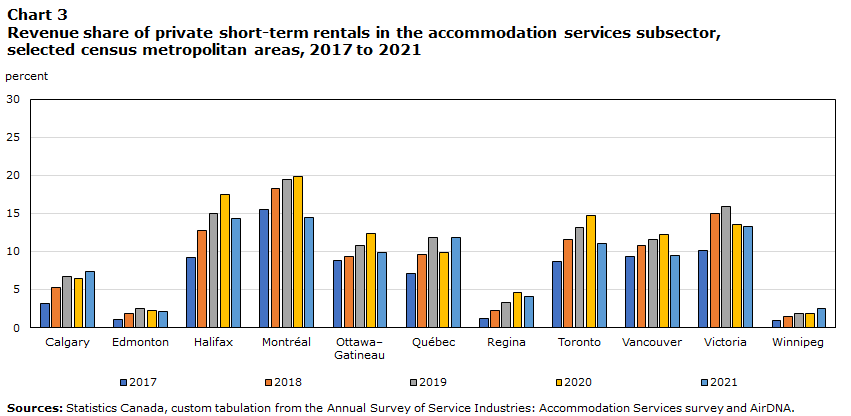
Data table for Chart 3
| 2017 | 2018 | 2019 | 2020 | 2021 | |
|---|---|---|---|---|---|
| percent | |||||
| Calgary | 3.2 | 5.2 | 6.7 | 6.4 | 7.3 |
| Edmonton | 1.0 | 1.8 | 2.5 | 2.3 | 2.1 |
| Halifax | 9.2 | 12.8 | 15.0 | 17.5 | 14.3 |
| Montréal | 15.5 | 18.3 | 19.5 | 19.8 | 14.5 |
| Ottawa–Gatineau | 8.8 | 9.3 | 10.8 | 12.4 | 9.8 |
| Québec | 7.1 | 9.6 | 11.8 | 9.8 | 11.8 |
| Regina | 1.2 | 2.2 | 3.3 | 4.6 | 4.1 |
| Toronto | 8.7 | 11.6 | 13.2 | 14.7 | 11.0 |
| Vancouver | 9.3 | 10.8 | 11.5 | 12.2 | 9.4 |
| Victoria | 10.1 | 15.0 | 15.9 | 13.5 | 13.3 |
| Winnipeg | 0.9 | 1.4 | 1.8 | 1.9 | 2.5 |
| Sources: Statistics Canada, custom tabulation from the Annual Survey of Service Industries: Accommodation Services survey and AirDNA. | |||||
In contrast, the proportion of revenues of private STRs for the tourist regions was much higher, ranging from 14.4% in the Banff region to 62.3% in Whistler (Chart 4). There are large differences—in the Banff region (14.4%) and St. Catharines–Niagara (17.5%), the proportions were similar to the level of the CMAs , while Muskoka (43.2%), Mont-Tremblant (57.9%) and Whistler (62.3%) had a much higher representation of private STRs .
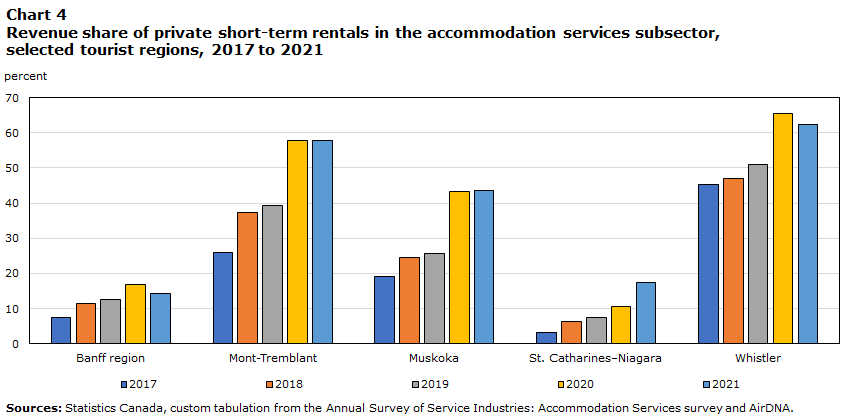
Data table for Chart 4
| 2017 | 2018 | 2019 | 2020 | 2021 | |
|---|---|---|---|---|---|
| percent | |||||
| Banff region | 7.5 | 11.5 | 12.7 | 16.7 | 14.4 |
| Mont-Tremblant | 26.0 | 37.4 | 39.3 | 57.8 | 57.9 |
| Muskoka | 19.0 | 24.4 | 25.8 | 43.2 | 43.7 |
| St. Catharines–Niagara | 3.3 | 6.3 | 7.4 | 10.6 | 17.5 |
| Whistler | 45.4 | 47.1 | 51.1 | 65.4 | 62.3 |
| Sources: Statistics Canada, custom tabulation from the Annual Survey of Service Industries: Accommodation Services survey and AirDNA. | |||||
The Banff region has a built-up commercial accommodation subsector that includes a couple of the largest hotel resorts in Canada, while Niagara Falls has a considerable number of hotel and resort properties in its town centre.
The accommodation services data do not include complete information on room capacity; however, per capita revenues can provide insight on the potential capacity of each type of accommodation (Chart 5). The Banff region’s significantly higher commercial accommodation per capita revenues imply a large amount of capacity for a market its size. Whistler has the next highest commercial accommodation revenues per capita, which are slightly more than one-third of those of the Banff region. However, Whistler dominates in STR per capita revenues.
Private STRs are not as differentiated as might be assumed if they are simply filling a supply shortage of commercial accommodation properties in these popular tourist areas. This offers an opportunity for future research on consumer decision making. It may also give insight on opportunities for capital investment in the commercial accommodation capacity of areas with very strong private STR markets.
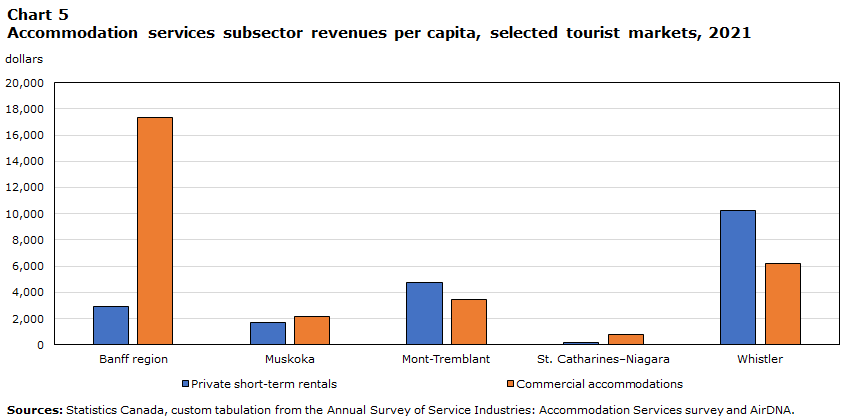
Data table for Chart 5
| Private short-term rentals | Commercial accommodations | |
|---|---|---|
| dollars | ||
| Banff region | 2906.46 | 17342.00 |
| Muskoka | 1683.20 | 2171.65 |
| Mont-Tremblant | 4780.59 | 3479.61 |
| St. Catharines–Niagara | 163.62 | 772.48 |
| Whistler | 10263.20 | 6207.98 |
| Sources: Statistics Canada, custom tabulation from the Annual Survey of Service Industries: Accommodation Services survey and AirDNA. | ||
Aggregate trends in various market segments in Canada from 2017 to 2021
This section presents an aggregated view of the revenue trends of STRs and commercial accommodation for the 11 CMAs, the five tourist markets and the rest of Canada. It also shows how these trends shifted during the first two years of the pandemic.
STR revenues have been accounting for a growing share of accommodation revenues since 2017 in the tourist markets and in the rest of Canada (Table 1). The STR revenue share in the rest of Canada steadily increased from 2.6% in 2017 to 9.4% in 2021, while it grew from 0.9% to 2.5% in tourist markets over the same period. However, this has not been consistently the case in the 11 CMAs at an aggregated level, where the share of revenue of STRs in the accommodation services subsector declined in the first two years of the pandemic.
| Segment | 2017 | 2018 | 2019 | 2020 | 2021 |
|---|---|---|---|---|---|
| percent | |||||
| Commercial accommodation—11 census metropolitan areas | 43.4 | 42.8 | 40.7 | 33.5 | 32.8 |
| Private short-term rentals—11 census metropolitan areas | 3.7 | 4.9 | 5.3 | 4.1 | 3.3 |
| Commercial accommodation—tourist markets (Banff region, Mont-Tremblant, Muskoka, St. Catharines–Niagara, and Whistler) | 6.6 | 6.3 | 6.7 | 5.5 | 5.6 |
| Private short-term rentals—tourist markets (Banff region, Mont-Tremblant, Muskoka, St. Catharines–Niagara, and Whistler) | 0.9 | 1.4 | 1.6 | 2.4 | 2.5 |
| Commercial accommodation—rest of Canada | 42.8 | 40.6 | 40.4 | 46.9 | 46.4 |
| Private short-term rentals—rest of Canada | 2.6 | 4.2 | 5.3 | 7.6 | 9.4 |
| Total | 100.0 | 100.0 | 100.0 | 100.0 | 100.0 |
| Sources: Statistics Canada, custom tabulation from the Annual Survey of Service Industries: Accommodation Services survey and AirDNA. | |||||
The pandemic also led to commercial accommodation revenue in the rest of Canada representing a growing proportion of the subsector’s total revenue (from 40.4% in 2019 to 46.4% in 2021).
Some possible drivers of the latest trends, and the overall outperformance by private STRs in the tourist markets and in the rest of Canada, could have been shifts in consumer behaviour to avoid large, populated areas, as well as potential regulation avoidance as restrictions were presumably more strictly enforced by commercial establishments.Note
Another factor that may have been driving these trends and the rising proportion of revenue of commercial accommodation in the rest of Canada is the focus on domestic travel during a time when travelling abroad was not an option. As well, the lack of international tourists, who would be expected to be concentrated in the largest CMAs , changed the underlying population represented within these accommodation statistics. Further study could be carried out on this point to better understand how the pandemic affected the makeup of the tourist population and its behaviours during this time.
Concluding remarks
Regulations and legislation are changing for STRs . As of July 1, 2021, new federal rules on sales tax collection and remittance apply to platform-based STR accommodations.Note Furthermore, the playing field is changing because provincial and municipal regulatory frameworks are now in place in several jurisdictions across Canada to control and limit commercial host activities. This includes new regulations being implemented and some older, poorly enforced or not impactful regulations being refined.Note This may have an impact on STR supply and the proportion of revenues captured by those types of activities in the accommodation services subsector after the pandemic.
Appendix A Maps of subprovincial markets
Banff region: Banff (Census Subdivision), Canmore (Census Agglomeration), Improvement District No. 9 (Census Subdivision)
Calgary: Calgary (Census Metropolitan Area)
Edmonton: Edmonton (Census Metropolitan Area)
Halifax: Halifax (Census Metropolitan Area)
Mont-Tremblant: Mont-Tremblant (Census Subdivision)
Montréal: Montréal (Census Metropolitan Area)
Muskoka: Muskoka (Census Division)
Ottawa–Gatineau: Ottawa–Gatineau (Census Metropolitan Area)
Québec: Québec (Census Metropolitan Area)
Regina: Regina (Census Metropolitan Area)
St. Catharines–Niagara: St. Catharines–Niagara (Census Metropolitan Area)
Toronto: Toronto (Census Metropolitan Area)
Vancouver: Vancouver (Census Metropolitan Area)
Victoria: Victoria (Census Metropolitan Area)
Whistler: Whistler (Census Subdivision)
Winnipeg: Winnipeg (Census Metropolitan Area)
- Date modified: