
Analysis in Brief
The Canadian Research and Development Pharmaceutical Sector, 2020
Skip to text
Text begins
Background
The Canadian innovative research and development pharmaceutical sector plays an important role in supporting the health and well-being of Canadians through advancements in medical research which lead to the discovery of new medicines and vaccines. The sector also provides direct contributions to Canada’s economy.
The sector continued to expand on several fronts despite economic pressures brought on by the Covid-19 pandemic in 2020. Most notably, the sector’s value added (gross domestic product) increased by almost $1 billion to $15.9 billion in 2020 from $15.0 billion in 2019, and employment increased by 5.2% to nearly 108,000 full-time equivalent jobs. More than half of these contributions were directly attributable to members of Innovative Medicines Canada (IMC), an association representing Canada’s innovative R&D pharmaceutical sector.
This economic footprint study builds upon previous findings for reference years 2018 and 2019 that were produced on behalf of the IMC. The design and construct of the study remain the same as past iterations. Integral to these studies is the specification of a cohort of businesses in the Canadian pharmaceutical sector, based upon two lists produced by Innovation, Science and Economic Development (ISED) and the IMC. The IMC list comprises its members, while the ISED list comprises all companies on the IMC list as well as additional peer group businesses.
The scope of this study has been broadened to include an analytical time-series for the sector to further trace out the ways in which the Canadian economy is shaped by the sector and, where data permit, by IMC members.
1. Introduction
The Covid-19 pandemic had profound impacts on health care systems throughout the world in 2020. Similar to challenges faced by other countries, Canada’s healthcare system was also negatively impacted by the pandemic – including supply chains, healthcare capacity, employment, and the economy itself. It also highlighted the importance of sustained and consistent investments in medical care and innovation, particularly in the pharmaceutical sector.
The pharmaceutical sector contributes to the health and well-being of Canadians through the discovery, development and delivery of innovative medicines and vaccines as well as economic growth. This growth can be seen through government tax revenue, job creation, R&D investment, and international trade.
This study, commissioned by Innovative Medicines Canada (IMC) and produced by the Investment, Science and Technology Division (ISTD) of Statistics Canada, estimates the economic contribution made by the innovative research and development (R&D) pharmaceutical sectorNote to the Canadian economy in 2020. The study builds upon findings published for the 2018 and 2019 reference years to broaden the measurement of impacts the sector has on the Canadian economy.
The R&D pharmaceutical sector is comprised largely of three core industries: pharmaceutical and medicine manufacturers; pharmaceuticals and pharmacy supplies merchant wholesalers; and R&D performers in the physical, engineering and life sciences. Within the sector, IMC members represent Canada’s largest R&D-based pharmaceutical companies. Businesses that focus primarily on medical devices, generic pharmaceuticals or veterinary medicines fall outside the scope of this study. The population in this study is comprised of 223 companies in the R&D pharmaceutical sector, 45 of which belonged to the IMC in 2020.
Several sources produced within Statistics Canada were used to derive the economic footprint of the sector, including a profile of IMC members. These sources include data related to employment; trade; investment; taxation revenues and research and development claims; capital spending; and economic impacts related to direct, indirect and induced effects.
2. The Canadian research and development pharmaceutical sector
2.1 Economic footprint
2.1.1 Value added
Gross value added (GVA) is defined as the unduplicated monetary contribution that a sector makes to the economic output of a country as measured by its gross domestic product (GDP). In the context of this report, it is a metric that measures the contribution of the R&D pharmaceutical sector (including IMC members) to the Canadian economy. It is derived by subtracting intermediate inputs from total output.
There are three components associated with GVA: direct impacts, which measure the output, GDP and jobs attributable to an industry; indirect impacts, which examine the upstream activities related to the supply of intermediate inputs (current expenditures on goods and services used in production processes) to an industry; and induced impacts, which involve the economic impacts derived from the spending of labour income from the industry.
The sector contributed nearly $16 billion to the Canadian economy in 2020
In 2020, the R&D pharmaceutical sector contributed $15.9 billion to the Canadian economy in GVA, an increase of 5.8% from the $15.0 billion generated in 2019. Just under half of this ($7.9 billion) was attributable to the direct impacts of the sector, which rose 4.5% from the $7.6 billion generated in 2019. Indirect impacts accounted for 28.3% of the total GVA in 2020 and increased 6.1% to $4.5 billion, while induced impacts advanced 8.7% to $3.5 billion.
Overall, the innovative R&D pharmaceutical sector accounted for 0.8% of Canada’s GDP at basic prices in 2020, a slight increase from the 0.7% estimated in each of the two previous years.Note

Description of figure 1
| Gross value added | |
|---|---|
| millions of dollars | |
| 2020 | |
| Direct impact | 7941 |
| Indirect impact | 4507 |
| Induced impact | 3470 |
| 2019 | |
| Direct impact | 7603 |
| Indirect impact | 4250 |
| Induced impact | 3191 |
| 2018 | |
| Direct impact | 7577 |
| Indirect impact | 4193 |
| Induced impact | 3105 |
|
Note: The R&D pharmaceutical sector's total GVA was $14,875 million in 2018, $15,044 million in 2019 and $15,918 million in 2020. Source: Statistics Canada, custom tabulation, Industry Accounts Division, reference years 2018 - 2020. |
|
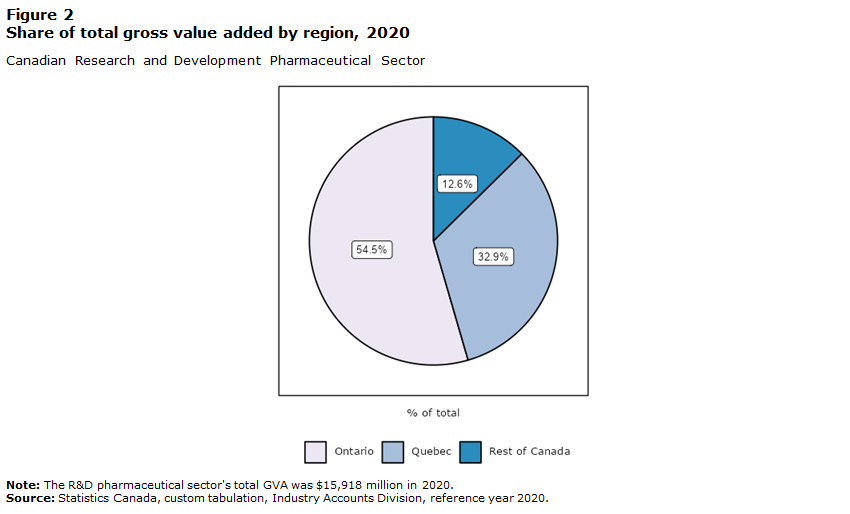
The majority of economic activity in the sector took place in Ontario and Quebec
Nearly $13.9 billion (87.4%) of the total GVA that the sector contributed to the Canadian economy was generated in Ontario ($8.7 billion) and Quebec ($5.2 billion). Likewise, 88.0% of all labour income was related to these provinces, with close to $5.0 billion coming from Ontario and $3.1 billion from Quebec.
Description of figure 2
| Share | |
|---|---|
| % of total | |
| Ontario | 54.5 |
| Quebec | 32.9 |
| Rest of Canada | 12.6 |
|
Note: The R&D pharmaceutical sector's total GVA was $15,918 million in 2020. Source: Statistics Canada, custom tabulation, Industry Accounts Division, reference year 2020. |
|
These two provinces further accounted for the majority (87.9%) of the total number of full-time equivalent (FTE) jobs in the sector, with Ontario supporting 55,693 FTEs and Quebec supporting 39,178 FTEs. The rest of Canada accounted for 13,102 FTEs.
2.1.2 Output
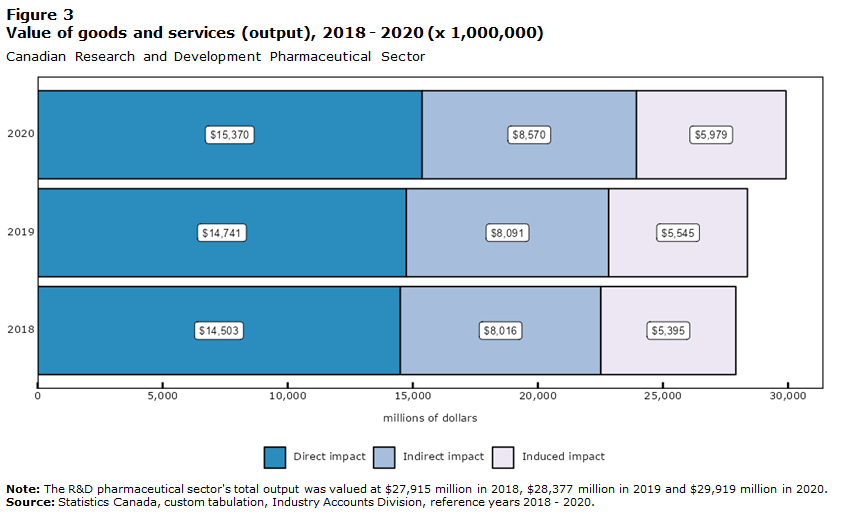
The R&D pharmaceutical sector produced $30 billion in output in 2020
In 2020, the outputNote generated by the Canadian R&D pharmaceutical sector increased by $1.5 billion from the previous year to just under $30 billion. From an economic impact perspective, the direct impact on this output, which accounted for over half the total impact, rose 4.3% from the previous year to $15.4 billion. The indirect impact on the output, which comprised 28.6% of the total, saw a larger relative increase, up 5.9% to $8.6 billion. Induced impacts also saw a similar relative increase, up 7.8% to almost $6.0 billion.
Description of figure 3
| Output | |
|---|---|
| millions of dollars | |
| 2020 | |
| Direct impact | 15370 |
| Indirect impact | 8570 |
| Induced impact | 5979 |
| 2019 | |
| Direct impact | 14741 |
| Indirect impact | 8091 |
| Induced impact | 5545 |
| 2018 | |
| Direct impact | 14503 |
| Indirect impact | 8016 |
| Induced impact | 5395 |
|
Note: The R&D pharmaceutical sector's total output was valued at $27,915 million in 2018, $28,377 million in 2019 and $29,919 million in 2020. Source: Statistics Canada, custom tabulation, Industry Accounts Division, reference years 2018 - 2020. |
|
Sector reported $31.3 billion in operating revenue in 2020
R&D pharmaceutical businesses in Canada generated $31.3 billion in operating revenuesNote in 2020, up 3.9% ($1.2 billion) from the year before. Operating expenses also rose, increasing by 3.0% to $30.6 billion with the sector paying $190 million (4.1%) more in wages, salaries and benefits, and $953 million (4.0%) more in raw materials and services.
Operating profits reached $728 million in 2020, up 70.9% from $426 million in 2019. Consequently, the operating profit margin, which is the ratio of operating profit to operating revenue, rose from 1.4% in 2019 to 2.3% in 2020. Increasing consumer demand for pharmaceutical products led to increased production in the sector.Note
2.1.3 Employment
The sector supported over 107,000 jobs in 2020
An additional 5,378 jobs were created by the Canadian R&D pharmaceutical sector in 2020, increasing overall employment to 107,973 FTEs, up 5.2% from the previous year.
The direct activities of the sector supported 49,403 FTE jobs in 2020, up 3,018 FTEs compared to 2019. The sector also indirectly supported nearly 34,990 FTEs stemming from the supply of intermediate inputs (1,178 FTEs higher than in 2019), and 23,580 FTEs related to the induced impacts brought on by increased spending by workers employed in the sector (1,182 more FTEs than in 2019).

Description of figure 4
| Full-time equivalent jobs | |
|---|---|
| number of FTEs | |
| 2020 | |
| Direct impact | 49403 |
| Indirect impact | 34990 |
| Induced impact | 23580 |
| 2019 | |
| Direct impact | 46385 |
| Indirect impact | 33812 |
| Induced impact | 22398 |
| 2018 | |
| Direct impact | 47404 |
| Indirect impact | 34742 |
| Induced impact | 22702 |
|
Note: The R&D pharmaceutical sector's total jobs were 104,848 FTEs in 2018, 102,595 FTEs in 2019 and 107,973 FTEs in 2020. Source: Statistics Canada, custom tabulation, Industry Accounts Division, reference years 2018 - 2020. |
|
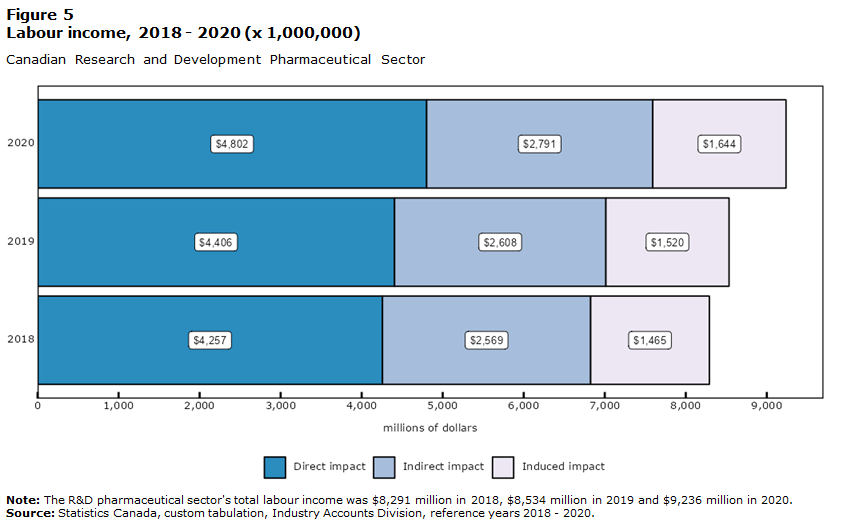
Total impact of labour income surpassed $9 billion in 2020
As a result of the growth in FTE positions, labour income increased from $8.5 billion in 2019 to $9.2 billion in 2020 – a gain of 8.2%. Of the three types of impacts on the economy from labour income, direct impacts (which accounted for 52.0% of all impacts) saw the greatest year-over-year increase at 9.0% ($395.6 million). Indirect and induced impacts of labour income, which accounted for 30.2% and 17.8% of the total, respectively, saw similar increases of 7.0% ($182.8 million) and 8.1% ($123.6 million).
Description of figure 5
| Labour Income | |
|---|---|
| millions of dollars | |
| 2020 | |
| Direct impact | 4802 |
| Indirect impact | 2791 |
| Induced impact | 1644 |
| 2019 | |
| Direct impact | 4406 |
| Indirect impact | 2608 |
| Induced impact | 1520 |
| 2018 | |
| Direct impact | 4257 |
| Indirect impact | 2569 |
| Induced impact | 1465 |
|
Note: The R&D pharmaceutical sector's total labour income was $8,291 million in 2018, $8,534 million in 2019 and $9,236 million in 2020. Source: Statistics Canada, custom tabulation, Industry Accounts Division, reference years 2018 - 2020. |
|
2.1.4 Trade
The Canadian R&D pharmaceutical sector engaged in international trade with over 90 import and export markets in 2020. The majority of businesses in the sector trade in multiple international markets.
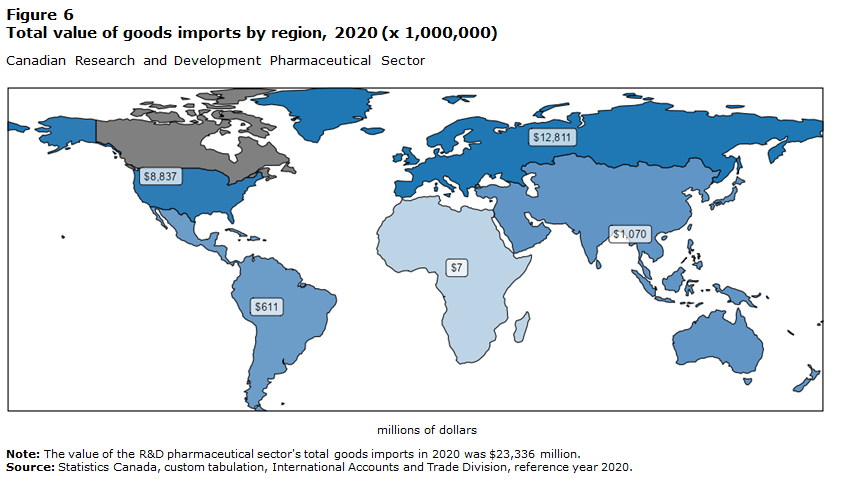
More than half of all imported goods in 2020 came from Europe
In 2020, 167 out of 223 businesses in the sector imported goods from abroad. Overall imports rose to $23.3 billion, a 4.9% increase from 2019 despite global trade restrictions brought on by the Covid-19 pandemic.
Europe, once again, remained the largest region for imports, accounting for 54.9% of all imports in 2020 and up 0.9% to $12.8 billion. This was followed by the United States, which accounted for 37.9% of imports and rose 13.9% to $8.8 billion.
Imports from Asia and Oceania, which constitute 4.6% of the total, experienced an increase of $135 million or 14.4%. Finally, imports from the Americas, excluding the United States, accounted for 2.6% of the total value, a decline of 28.5% from the previous year.
Description of figure 6
| Imports | |
|---|---|
| millions of dollars | |
| Africa | 7 |
| Americas (excluding USA) | 611 |
| Asia and Oceania | 1070 |
| Canada | Note ...: not applicable |
| Europe | 12811 |
| United States | 8837 |
|
... not applicable Note: The value of the R&D pharmaceutical sector's total goods imports in 2020 was $23,336 million. Source: Statistics Canada, custom tabulation, International Accounts and Trade Division, reference year 2020. |
|
Exports to the United States declined in 2020
In 2020, 69 out of 223 businesses in the Canadian R&D pharmaceutical sector exported goods abroad. In contrast to the rise in imports, exports by the sector declined 7.8% to $5.4 billion in 2020. As in previous years, most exports by the sector (85.2%) were destined for the United States, which decreased 8.6% to $4.6 billion. Europe was the second largest export market, but also decreased 3.9% to $397 million.
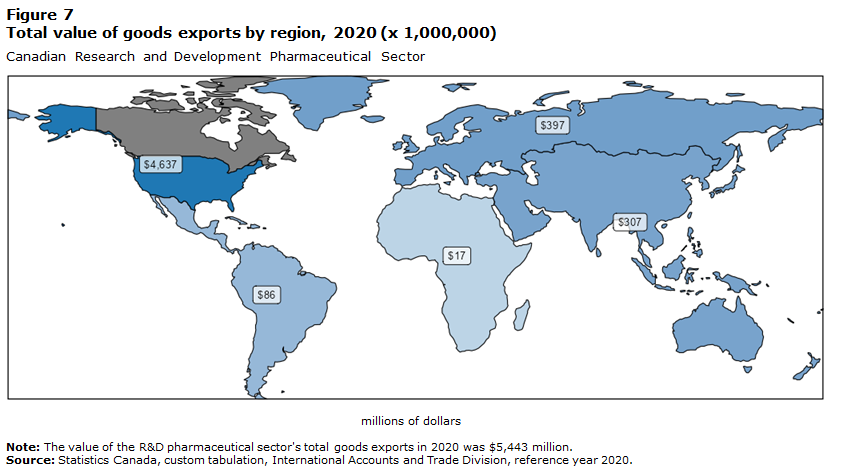
Description of figure 7
| Exports | |
|---|---|
| millions of dollars | |
| Africa | 17 |
| Americas (excluding USA) | 86 |
| Asia and Oceania | 307 |
| Canada | Note ...: not applicable |
| Europe | 397 |
| United States | 4637 |
|
... not applicable Note: The value of the R&D pharmaceutical sector's total goods exports in 2020 was $5,443 million. Source: Statistics Canada, custom tabulation, International Accounts and Trade Division, reference year 2020. |
|
Overall, the sector had a trade deficit (with total imports exceeding exports) driven in part by the pandemic and the shift towards domestic consumption of goods, which increased 9.4% to $17.9 billion in 2020. The largest deficit was with Europe at $12.4 billion, which remained relatively stable from the two previous years. The largest trade deficit changes involved the United States, up 56% to $4.2 billion in 2020, and Asia and Oceania, which rose by 15.4% to $763 million. The trade surplus with Africa declined by 47.4% in 2020, to $10 million.
2.2 Research and development
2.2.1 Total R&D expenditures
Key information on the R&D activities performed by businesses in Canada is captured through the Annual Survey of Research and Development in Canadian Industry (RDCI). In the survey, businesses report their R&D expenditures under two categories: in-house and outsourced. In-house R&D is performed by the business itself. Outsourced R&D is funded by the business but conducted by other parties whether businesses, organizations (e.g., universities or hospitals), or individuals, either within or outside Canada. The funding can take the form of grants, fellowships, or contracts.
The R&D pharmaceutical sector spent between $1.8 billion and $2.4 billion in R&D expenditures in 2020
Statistics Canada does not report R&D expenditures as the sum of in-house and outsourced expenditures, as doing so might potentially lead to double-counting in domestically-sourced expenditures, with one company reporting funding the R&D activity and another reporting performing it. Consequently, total R&D expenditures can only be estimated as a range; the floor representing the sum of total in-house R&D expenditures and total outsourced R&D expenditures outside Canada, and the ceiling a sum of total in-house R&D expenditures and total outsourced expenditures (inside and outside Canada). In 2020, total R&D expenditures by the R&D pharmaceutical sector was estimated at between $1.8 and $2.4 billion, compared to the $1.6 and $2.2 billion range from the previous year.
2.2.2 In-house R&D expenditures
Businesses in the R&D pharmaceutical sector spent almost $1.3 billion on total in-house R&DNote , a 15.1% increase from 2019. This accounted for 5.6% of all business enterprise expenditures on research and development (BERD) in CanadaNote , nearly a 10% increase from 2019.
| 2018 | 2019 | 2020 | |
|---|---|---|---|
| millions of dollars | |||
| Total industrial R&D (all industries)Table 1: In-house R&D expenditures, 2018 - 2020 (x 1,000,000) Note 1 | 20,855 | 21,920 | 22,638 |
| Canadian R&D pharmaceutical sector | 1,032 | 1,107 | 1,274 |
| IMC members | 623 | 723 | 797 |
|
|||
The sector spent $1.2 billion in current in-house R&D expenditures in 2020 and supported over 7,600 personnel
The R&D pharmaceutical sector spent nearly $1.2 billion on current in-house R&D expenditures, an 11.9% increase from the previous year. Wages and salaries constituted the largest single expenditure (62.6%), with companies spending $749 million, a 15% increase from 2019.
The sector also supported 7,609 FTE in-house R&D personnel, an increase of 10.2% from 2019. Most R&D personnel in the sector were researchers (51.7%) and technical support staff (44.3%). The increase in FTEs was driven by a 24.7% rise in the number of scientific researchers.

Description of figure 8
| Full-time equivalent jobs | |
|---|---|
| number of FTEs | |
| 2020 | |
| Total researchers | 3937 |
| Total tech support | 3373 |
| On-site contractors | 298 |
| 2019 | |
| Total researchers | 3157 |
| Total tech support | 3416 |
| On-site contractors | 333 |
| 2018 | |
| Total researchers | 2820 |
| Total tech support | 2787 |
| On-site contractors | 529 |
|
Note: The R&D pharmaceutical sector's total R&D personnel was 6,136 FTEs in 2018, 6,906 FTEs in 2019 and 7,609 FTEs in 2020. Source: Statistics Canada, custom tabulation, Survey of Research and Development in Canadian Industry, reference years 2018 - 2020. |
|
In-house capital expenditures doubled in 2020
While current in-house expenditures constituted most (94.0%) of total in-house R&D expenditures for the sector, in-house capital expenditures (e.g., software, land, buildings, and equipment) nearly doubled compared to previous years, from $31 and $37 million in 2018 and 2019 respectively, to $77 million in 2020.
Most in-house R&D expenditures occurred in Quebec and Ontario
As in prior years, the bulk of in-house R&D work was conducted in Quebec and Ontario (43.3% and 34.9%, respectively). In-house expenditures reached $552 million in Quebec, a 23.2% increase from 2019, while Ontario saw a 1.8% increase in spending reaching $445 million. The rest of Canada accounted for spending totalling $276 million, representing a 24.9% increase.
Majority of in-house R&D expenditure was funded by foreign entities
The majority (58.4%) of all in-house R&D expenditures by the R&D pharmaceutical sector in 2020 were funded from outside of Canada, a reverse from the previous year when the majority (56.5%) of funds came from Canadian sources. In 2020, foreign funding reached $744 million, up 54.4% from 2019. Canadian funded in-house R&D expenditures declined by 15.2% from $625 million in 2019 to $530 million in 2020.
The nature of R&D in the Canadian pharmaceutical sector inherently differs from other industries
Research efforts carried out by businesses can also be examined from the perspective of the type of R&D performed. International statistical standards distinguish between research activities and experimental development activities.Note Research can be conducted either to acquire knowledge (basic research) or to generate new knowledge directed toward a practical aim (applied research). Experimental development builds upon knowledge already in existence to develop or improve products or processes.
In 2020, the R&D pharmaceutical sector spent over half of its total in-house R&D funding ($692 million out of $1.2 billion) on research activities, and the remaining $582 million (45.8%) on experimental development. By contrast, businesses in other industries spent more on experimental development (over $18 billion) than research ($3 billion).Note
| Canadian R&D Pharmaceutical Sector | All Other Industries | |
|---|---|---|
| millions of dollars | ||
| Total in-house research and development expenditures in Canada | 1,274 | 21,364 |
| Research | 692 | 2,992 |
| Experimental development | 582 | 18,372 |
| Source: Statistics Canada, Business enterprise in-house research and development expenditures by industry groups, country of control and nature of research and development, Table 27-10-0344-01. | ||
2.2.3 Outsourced R&D expenditures
Half of all outsourced R&D spending went to Canadian companies
The R&D pharmaceutical sector spent $1.1 billion on outsourced R&D expenditures in 2020, indicating a nearly 1:1Note ratio of in-house to outsourced R&D expenditures, whereas the ratio was about 6:1 of in-house to outsourced R&D expenditures for all other industries in the economy. This indicates that the pharmaceutical sector relies more heavily on outsourced R&D than other R&D performers in the country.
In terms of R&D expenditures outsourced within Canada by the R&D pharmaceutical sector, $369 million (61.4%) went to other businesses, $140 million (23.3%) to hospitals and universities, and $92 million (15.3%) to other Canadian entities. Compared to the previous year, the sector outsourced $16 million less to hospitals and universities in 2020, a 10.3% decline. However, other Canadian businesses received $22 million more in R&D funding, a 6.3% increase.
2.2.4 SR&ED-eligible R&D expenditures
The Scientific Research and Experimental Development (SR&ED) program, funded by the Government of Canada, is a tax incentive program that promotes R&D among qualifying businesses, regardless of their size or sector. Under this program, qualifying businesses receive either a deduction against their income or an investment tax credit of 15-35%, depending on the size and type of business.Note Certain expenses, such as capital expenditures and R&D projects that are outsourced outside of Canada, cannot be claimed under this program.
The R&D pharmaceutical sector claimed nearly $1 billion in SR&ED tax credits
In 2020, businesses in the pharmaceutical R&D sector claimed $986 million in refundable tax credits under the SR&ED program, 64.3% of which was spent on in-house R&D and the remaining 35.7% was outsourced to other organizations within Canada. As in prior years, SR&ED claims of in-house expenditures amounted to approximately half (53.0%) of the current in-house expenditures, even though in absolute terms, the volume of current in-house R&D expenditures went up roughly 20% between 2018 and 2020.

Description of figure 9
| Current in-house expenditures | Outsourced within Canada expenditures | |
|---|---|---|
| millions of dollars | ||
| 2020 | ||
| Claimed | 634 | 352 |
| Unclaimed | 563 | 249 |
| 2019 | ||
| Claimed | 551 | 417 |
| Unclaimed | 519 | 200 |
| 2018 | ||
| Claimed | 535 | 374 |
| Unclaimed | 466 | 72 |
|
Note: The R&D pharmaceutical sector's total current in-house R&D was $1,001 million in 2018, $1,070 million in 2019 and $1,197 million in 2020. The sector's total outsourced in Canada R&D was $446 million in 2018, $617 million in 2019 and $601 million in 2020. Source: Statistics Canada, custom tabulation, Scientific Research and Experimental Development Expenditures Claim, Survey of Research and Development in Canadian Industry, reference years 2018 - 2020. |
||
Majority of SR&ED claims on in-house R&D expenditures made by Canadian-controlled companies
Of the 121 businesses that claimed SR&ED expenses in 2020, 83 (68.6%) were Canadian-controlled and the remaining 38 (31.4%) were controlled by foreign entities. Exactly half of the foreign-controlled companies had a US parent and half had foreign parents from countries other than the US. Furthermore, despite having a lesser number of claims, foreign-controlled entities had a larger portion of the value of claims.
From the $634 million in total allowable in-house expenditures claimed under the SR&ED program in 2020, $139 million (21.9%) was attributed to Canadian-controlled companies, a 14.9% increase compared to 2019. Three-fifths (63.4%) of claims by foreign-controlled companies were made by US-owned companies ($314 million), up 27.1%.
SR&ED claims on outsourced R&D expenditures decreased from $417 million in 2019 to $352 million in 2020, a decline of $65 million. The decrease was the result of a 19.4% drop ($68 million) in claims by foreign-controlled companies. Canadian-controlled companies, claimed $69 million in SR&ED expenditures, an increase of $2 million or 3.0% in 2020.
3. Innovative Medicines Canada members
3.1 Economic footprint
3.1.1 Value added
IMC members contributed over $8 billion to the Canadian economy in 2020
The IMC is an industry association that acts on behalf of the Canadian R&D pharmaceutical sector, with members ranging from start-ups to established organizations. All 45 members actively engaged in R&D in 2020 were included in this study.Note
In 2020, IMC members contributed $8.3 billion to the Canadian economy in GVA, a 1.8% increase ($145 million) from the previous year, and accounted for over half the contribution made by the entire R&D pharmaceutical sector. By comparison, non-IMC members contributed $7.7 billion in GVA, an increase of 10.5% ($728 million) compared to 2019.
Over half of the total GVA by IMC members ($4.2 billion) was tied to direct impacts. Of the remainder, members contributed $2.3 billion in indirect impacts and $1.7 billion in induced impacts, an increase of 2.0% and 2.6%, respectively from 2019.
IMC members also accounted for a higher percentage (0.40%) of Canada’s GDP at basic prices in 2020 compared to the rest of the R&D pharmaceutical sector (0.37%), as they did in the previous year (0.37% compared to 0.32% for the rest of the sector).Note

Description of figure 10
| Gross value added | |
|---|---|
| millions of dollars | |
| 2020 | |
| Direct impact | 4174 |
| Indirect impact | 2348 |
| Induced impact | 1730 |
| 2019 | |
| Direct impact | 4118 |
| Indirect impact | 2302 |
| Induced impact | 1686 |
| 2018 | |
| Direct impact | 3998 |
| Indirect impact | 2210 |
| Induced impact | 1583 |
|
Note: IMC members' total GVA was $7,791 million in 2018, $8,106 million in 2019 and $8,252 million in 2020. Source: Statistics Canada, custom tabulation, Industry Accounts Division, reference years 2018 - 2020. |
|
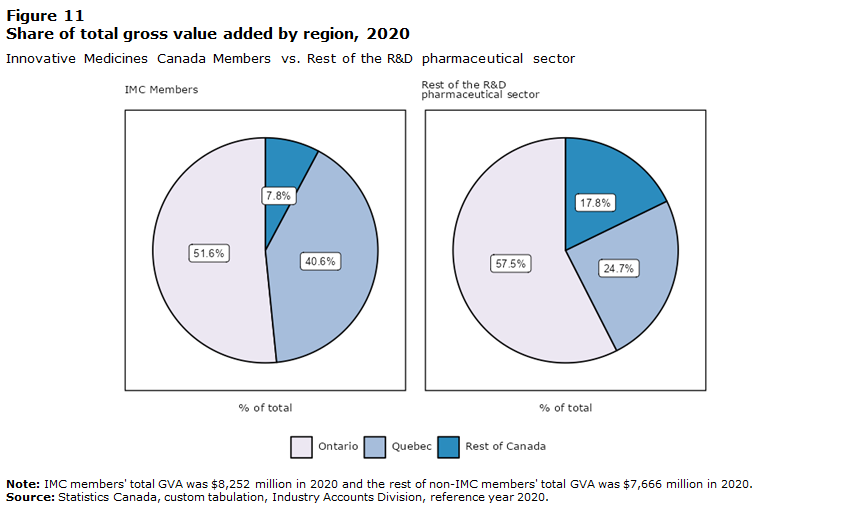
IMC members’ activities were more concentrated in Ontario and Quebec compared to non-IMC members
IMC members generated a higher share of their GVA in Ontario and Quebec, a combined total of 92.2% compared to 82.2% for the rest of the sector. Of the $8.3 billion in GVA contributed to the Canadian economy by IMC members, $4.3 billion was generated in Ontario and $3.4 billion in Quebec. Likewise, 92.4% of all labour income originated in these two provinces, with $2.4 billion tied to Ontario and $2.0 billion to Quebec.
Non-IMC members in the sector also generated the majority of their GVA in Ontario and Quebec ($4.4 billion and $1.9 billion, respectively), but had a higher share of their GVA in Ontario compared to IMC members (57.5% versus 51.6%). Non-IMC members’ share of GVA generated in Quebec was much less (24.7% versus 40.6%) as their activities were more distributed across the country than IMC members.
Description of figure 11
| Innovative Medicines Canada Members | Rest of the sector | |
|---|---|---|
| % of total | ||
| Ontario | 51.6 | 57.5 |
| Quebec | 40.6 | 24.7 |
| Rest of Canada | 7.8 | 17.8 |
|
Note: IMC members' total GVA was $8,252 million in 2020 and the rest of non-IMC members' total GVA was $7,666 million in 2020. Source: Statistics Canada, custom tabulation, Industry Accounts Division, reference year 2020. |
||
3.1.2 Output
The total impact that IMC members had on Canada’s economic output rose 1.5% ($229.6 million) from $15.1 billion in 2019 to $15.3 billion in 2020. Non-IMC members’ output reached $14.6 billion, an increase of 9.9% from 2019.
The direct impacts attributed to IMC members, which constituted over half the total impacts, increased by $105.1 million (1.3%) to $7.9 billion in 2020, while indirect impacts increased by $66.0 million to $4.4 billion. Induced impacts saw the largest increase, rising $58.5 million (2.0%) to $3.0 billion in 2020.

Description of figure 12
| Output | |
|---|---|
| millions of dollars | |
| 2020 | |
| Direct impact | 7922 |
| Indirect impact | 4406 |
| Induced impact | 2993 |
| 2019 | |
| Direct impact | 7817 |
| Indirect impact | 4340 |
| Induced impact | 2934 |
| 2018 | |
| Direct impact | 7529 |
| Indirect impact | 4193 |
| Induced impact | 2757 |
|
Note: IMC members' total output was valued at $14,479 million in 2018, $15,091 million in 2019 and $15,321 million in 2020. Source: Statistics Canada, custom tabulation, Industry Accounts Division, reference years 2018 - 2020. |
|
Operating profits of IMC members declined in 2020
IMC members generated $17.7 billion in operating revenue (56.7% of the overall sector) during 2020, a decline of 1.5% from the previous year. Operating expenses for IMC members declined $8 million from the previous year to $17.2 billion.
Given the variance between operating revenue and expenses, operating profits for member companies declined from $831 million in 2019 to $568 million in 2020, a 31.7% decline. Similarly, the operating profit margin decreased from 4.6% in 2019 to 3.2% in 2020 (by 1.4%). These declines contrasted to the overall sector, where operating profits increased by 70.9%, from $426 million in 2019 to $728 million in 2020.
3.1.3 Employment
IMC members were responsible for over half the jobs supported by the sector
In 2020, IMC members supported 55,481 jobs, which accounted for over half the total jobs supported by the overall R&D pharmaceutical sector. While non-IMC members saw notable increases in the direct, indirect and induced impacts of jobs, IMC members only saw a small increase (97 FTEs) on the direct impacts of jobs in 2020.

Description of figure 13
| Innovative Medicines Canada Members | Rest of the sector | |
|---|---|---|
| number of FTEs | ||
| 2020 | ||
| Direct impact | 24973 | 24430 |
| Indirect impact | 18586 | 16404 |
| Induced impact | 11922 | 11658 |
| 2019 | ||
| Direct impact | 24876 | 21509 |
| Indirect impact | 18603 | 15209 |
| Induced impact | 11960 | 10438 |
| 2018 | ||
| Direct impact | 24388 | 23016 |
| Indirect impact | 18592 | 16150 |
| Induced impact | 11694 | 11008 |
|
Note: IMC members' total jobs were 54,674 FTEs in 2018, 55,439 FTEs in 2019 and 55,481 FTEs in 2020. Non-IMC members' total jobs were 50,175 FTEs in 2018, 47,156 FTEs in 2019 and 52,492 FTEs in 2020. Source: Statistics Canada, custom tabulation, Industry Accounts Division, reference years 2018 - 2020. |
||
Impact of labour income for IMC members was stronger than for non-IMC members
The impact of labour income for IMC member companies increased 3.0% to $4.7 billion in 2020, which was less of an increase than the rest of the sector, whose costs rose 14.3% to $4.6 billion. Direct and indirect impacts on labour income for IMC members both increased by 2.9% ($395.6 million) and 3.1% ($182.8 million), respectively compared to 2019, while induced impacts increased by $827 million (2.6%).
3.1.4 Trade
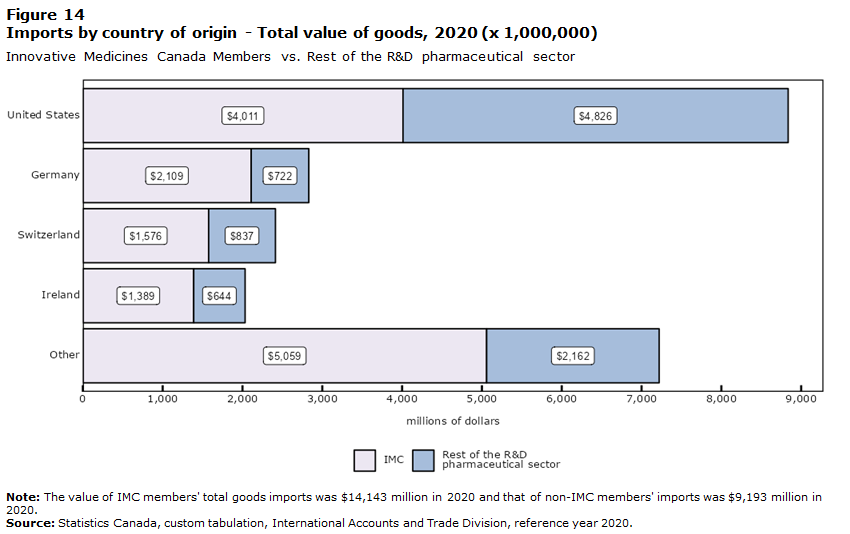
IMC members rely less heavily on the United States as a trading partner compared to non-IMC members
IMC members imported $14.1 billion in goods in 2020, a 3.4% decline from the previous year, while non-IMC members imported $9.2 billion during the year, an increase of 20.8%.
Goods from the United States accounted for 28.4% of total imports by IMC members, an increase of $268 million (7.2%) from 2019. While the United States is the single largest trading partner for IMCmembers, as it is for the sector itself, IMC members relied less heavily on the United States compared to non-IMC members (52.5%).
Description of figure 14
| Innovative Medicines Canada Members | Rest of the sector | |
|---|---|---|
| millions of dollars | ||
| United States | 4011 | 4826 |
| Switzerland | 1576 | 837 |
| Germany | 2109 | 722 |
| Ireland | 1389 | 644 |
| Other | 5059 | 2162 |
|
Note: The value of IMC members' total goods imports was $14,143 million in 2020 and that of non-IMC members' imports was $9,193 million in 2020. Source: Statistics Canada, custom tabulation, International Accounts and Trade Division, reference year 2020. |
||
IMC members exported nearly $1.3 billion in goods in 2020, accounting for just under a quarter of the R&D pharmaceutical sector’s total exports. Of this, $845 million (65.5%) in exports were destined for the United States, a $37 million increase compared to the previous year. As with imports, the share of exports to the US is lower than for non-IMC members, who exported 91.3% of their goods to the United States. Additionally, while IMC members’ exports to the US saw a 4.6% increase from 2019, exports by non-IMC members declined by 11.5%.
3.2 Research and development
3.2.1 Total R&D expenditures
As previously noted, Statistics Canada reports in-house and outsourced R&D expenditures separately to avoid double-counting. Taking this into account, IMC members reported between $987 million and $1.4 billion in total R&D expenditures in 2020.
3.2.2 In-house R&D expenditures
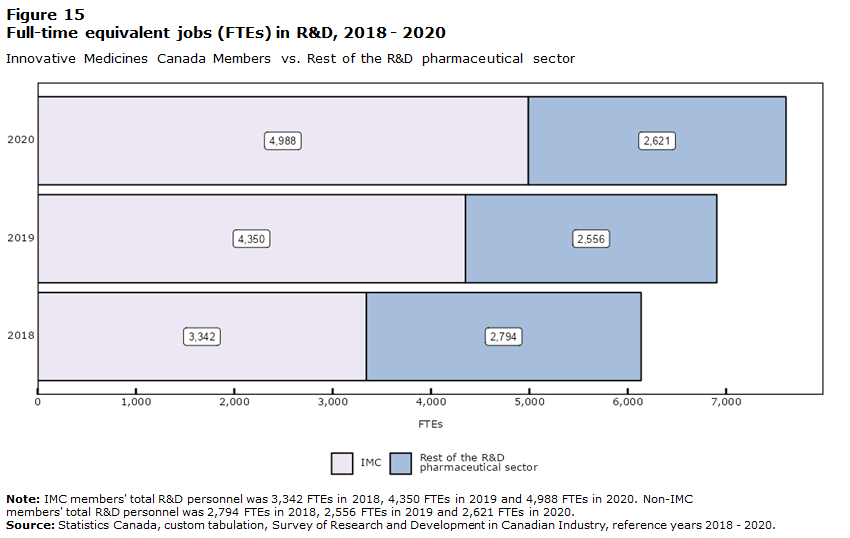
IMC members spent nearly $800 million on in-house R&D and supported nearly 5,000 jobs
In 2020, IMC members spent $797 million on in-house R&D expenditures, a 10.2% increase from 2019. This spending accounted for 3.5% of all BERD in Canada, more than half of the contribution of the entire pharmaceutical R&D sector.
IMC members also supported 4,988 of the 7,609 FTE R&D personnel in the sector and were responsible for 638 of the 703 new R&D FTE positions added during 2020. This was offset by the decline in non-R&D FTE positions given that IMC members contributed only 97 of the sector’s 3,018 new FTEs overall, indicating that IMC members’ concentration of personnel in R&D rose.
Description of figure 15
| Innovative Medicines Canada Members | Rest of the sector | |
|---|---|---|
| number of FTEs | ||
| 2020 | 4988 | 2621 |
| 2019 | 4350 | 2556 |
| 2018 | 3342 | 2794 |
|
Note: IMC members' total R&D personnel was 3,342 FTEs in 2018, 4,350 FTEs in 2019 and 4,988 FTEs in 2020. Non-IMC members' total R&D personnel was 2,794 FTEs in 2018, 2,556 FTEs in 2019 and 2,621 FTEs in 2020. Source: Statistics Canada, custom tabulation, Survey of Research and Development in Canadian Industry, reference years 2018 - 2020. |
||
In contrast to the sector itself, IMC members added new FTE positions for both researchers and technical support personnel (447 and 233 positions, respectively), although the number of on-site contractor positions fell by 41 compared to the previous year.

Description of figure 16
| Full-time equivalent jobs | |
|---|---|
| number of FTEs | |
| 2020 | |
| Total researchers | 2357 |
| Total tech support | 2480 |
| On-site contractors | 152 |
| 2019 | |
| Total researchers | 1910 |
| Total tech support | 2247 |
| On-site contractors | 193 |
| 2018 | |
| Total researchers | 1649 |
| Total tech support | 1491 |
| On-site contractors | 202 |
|
Note: IMC members' total R&D personnel was 3,342 FTEs in 2018, 4,350 FTEs in 2019 and 4,988 FTEs in 2020. Source: Statistics Canada, custom tabulation, Survey of Research and Development in Canadian Industry, reference years 2018 - 2020. |
|
Nearly all IMC members’ in-house R&D takes place in Ontario and Quebec
IMC member companies spent 91.1% of their in-house R&D expenditures in Ontario and Quebec in 2020. Of the $797 million on in-house expenditures, $372 million (46.7%) was conducted in Quebec, $354 million (44.4%) in Ontario and $72 million (9.0%) in the rest of Canada.
By contrast, $180 million of the total $477 million that non-IMC members spent on in-house R&D expenditures (37.7%) occurred in Quebec, $91 million (19.1%) in Ontario and $204 million (42.8%) in the rest of Canada.

Description of figure 17
| Innovative Medicines Canada Members | Rest of the sector | |
|---|---|---|
| millions of dollars | ||
| Quebec | 372 | 180 |
| Ontario | 354 | 91 |
| Rest of Canada | 72 | 204 |
|
Note: IMC members' total in-house R&D expenditures were $797 million in 2020 and non-IMC members' total in-house expenditures were $477 million in 2020. Source: Statistics Canada, custom tabulation, Survey of Research and Development in Canadian Industry, reference year 2020. |
||
Most of the in-house R&D by IMC members was foreign-funded
Almost three-quarters (72.7%) of all in-house R&D expenditures by IMC members were funded by foreign sources in 2020. Non-IMC members, by comparison, relied more heavily on Canadian-funded sources, with 34.6% of their total in-house R&D expenditures funded by foreign sources during the year.
In 2020, IMC members’ foreign-funded R&D increased to $579 million from $334 million in 2019, an increase of 73.4% that surpassed the sector-wide increase of 54.4%. In contrast, Canadian-funded in-house R&D fell from $389 million in 2019 to $219 million in 2020, a decline of 43.7% – greater than the sector-wide decline of 15.2%.
The nature of R&D differs between IMC and non-IMC members
As noted earlier, a distinction is made between research and experimental development activities. In 2020, IMC members spent $520 million (65.2% of all in-house R&D expenditures) on research and $277 million (34.8%) on experimental development. Moreover, expenditures on research rose by 7.2% in 2020, while expenditures on development activities increased 16.4%. Of the $477 million spent on in-house expenditures by non-IMC members, $172 million was directed towards research (36.1%) and $305 million towards experimental development (63.9%).

Description of figure 18
| Innovative Medicines Canada Members | Rest of the sector | |
|---|---|---|
| millions of dollars | ||
| 2020 | ||
| Total research | 520 | 172 |
| Experimental development | 277 | 305 |
| 2019 | ||
| Total research | 485 | 136 |
| Experimental development | 238 | 248 |
| 2018 | ||
| Total research | 438 | 117 |
| Experimental development | 186 | 290 |
|
Note: IMC members' total in-house R&D expenditures were $623 million in 2018, $723 million in 2019, and $797 million in 2020. Non-IMC members' total in-house expenditures were $409 million in 2018, $384 million in 2019, and $477 million in 2020. Source: Statistics Canada, custom tabulation, Survey of Research and Development in Canadian Industry, reference years 2018 - 2020. |
||
3.2.3 Outsourced R&D expenditures
IMC members outsourced $636 million in R&D expenditures in 2020, 70.3% ($447 million) of which went to other entities within Canada. Of this, $241 million (53.9%) went to other businesses, $126 million (28.2%) to hospitals and universities, and the remaining $80 million to all other Canadian recipients.

Description of figure 19
| Innovative Medicines Canada Members | Rest of the sector | |
|---|---|---|
| millions of dollars | ||
| Canadian businesses | 241 | 128 |
| Canadian hospitals and universities | 126 | 14 |
| All other Canadian recipients | 80 | 12 |
| Foreign recipients | 190 | 351 |
|
Note: IMC members' total outsourced R&D expenditures were $636 million in 2020 and non-IMC members' total outsourced expenditures were $506 million in 2020. Source: Statistics Canada, custom tabulation, Survey of Research and Development in Canadian Industry, reference year 2020. |
||
3.2.4 SR&ED-eligible R&D expenditures
IMC member claimed the majority of SR&ED claims in 2020
IMC members accounted for 73.6% of all SR&ED claims made by the Canadian R&D pharmaceutical sector in 2020, with claims by members amounting to $726 million, down 1.6% from 2019. Of these claims, $447 million (61.6% of the total SR&ED claims) were current in-house R&D expenditures, up 12.9%. Under the program, capital expenditures, which represent the remainder of total in-house R&D expenditures, cannot be claimed.

Description of figure 20
| Current in-house expenditures | Outsourced within Canada expenditures | |
|---|---|---|
| millions of dollars | ||
| 2020 | ||
| Claimed | 447 | 279 |
| Unclaimed | Note x: suppressed to meet the confidentiality requirements of the Statistics Act | 168 |
| 2019 | ||
| Claimed | 396 | 342 |
| Unclaimed | 314 | 165 |
| 2018 | ||
| Claimed | 360 | 304 |
| Unclaimed | 249 | 47 |
|
x suppressed to meet the confidentiality requirements of the Statistics Act Note: The amount of eligible current in-house R&D expenses that were unclaimed through the SR&ED program in 2020 cannot be calculated since IMC's total current in-house expenditures and total capital expenditures for 2020 have been suppressed for reasons of confidentiality. IMC members' total current in-house R&D was $609 million in 2018 and $710 million in 2019. IMC members' total outsourced in Canada R&D was $351 million in 2018, $507 million in 2019 and $447 million in 2020. Source: Statistics Canada, custom tabulation, Scientific Research and Experimental Development Expenditures Claim, Survey of Research and Development in Canadian Industry, reference years 2018 - 2020. |
||
Member companies also claimed $279 million in outsourced R&D expenditures, approximately 62.4% of their total outsourced R&D expenditures within Canada during the year. This amounted to a larger share than what was claimed by non-IMC members (47.4% or $73 million).
4. Limitations
This study estimates the contribution of the innovative R&D pharmaceutical sector, including members of the IMC to the Canadian economy in 2020 using several economic data sources. While the study is comprehensive, it is also subject to the availability of data. For example, due to the absence of detailed data related to gender, age, immigration status and education, the study is not able to examine employment characteristics of the workforce through a sociodemographic lens.
2020 also represents an atypical year with the emergence of the Covid-19 pandemic, which impacted not just the R&D pharmaceutical sector itself but all sectors on both national and global scales through interruptions to supply chains, border restrictions, and lockdowns. In response to the pandemic, the R&D pharmaceutical sector shifted towards the discovery and manufacturing of vaccines, tests and other medical research.
Finally, as robust as this study is, its success and the success of future studies is contingent upon active participation by businesses in the Research and Development in Canadian Industries survey, which allows for the careful identification and tracking of R&D activity by firms in the Canadian economy.
5. Appendix
5.1 Glossary
The Annual Survey of Research and Development in Canadian Industry (RDCI) is an annual survey that collects R&D expenditures and personnel data used to monitor science and technology related activities of business and industrial non-profit organizations in Canada.
Applied research is original investigation undertaken in order to acquire new knowledge. It is, however, directed primarily towards a specific, practical aim or objective. See also basic research; experimental development.
Basic price is the amount a producer receives from a purchaser for a unit of a good or service produced as output minus any tax payable and plus any subsidy receivable as a result of its production or sale.
Basic research is experimental or theoretical work undertaken primarily to acquire new knowledge of the underlying foundations of phenomena and observable facts, without any particular application or use in view. See also applied research; experimental development.
Business Enterprise Research and Development (BERD) is all research and development performed in Canada by the business enterprise sector, as measured by the Annual Survey of Research and Development in Canadian Industry performed by Statistics Canada.
Capital R&D expenditures are the annual gross amount paid for the acquisition of fixed assets that are used repeatedly or continuously in the performance of R&D for more than one year. They should be reported in full for the period when they took place, whether acquired or developed in-house, and should not be registered as an element of depreciation.
Country of control is the country of residence of the ultimate controlling parent corporation, family, trust, estate or related group. Each subsidiary within the global enterprise is assigned the same country of control as its parent. Country of control data are derived from ownership questionnaires filed annually with Statistics Canada by corporations subject to the Corporations Returns Act, and from information obtained from the Canada Revenue Agency’s administrative records.
Current R&D expenditures are composed of labour costs and other current costs (including for external R&D personnel) used in R&D. Services and items (including equipment) used and consumed within one year are current expenditures. Annual fees or rents for the use of fixed assets should be included in current expenditures, as should overhead costs associated with R&D. See also other current costs.
Direct impacts are the effects directly attributed to an industry’s production. See also indirect impact; induced impact.
An economic footprint study aims to measure the total economic impact (direct, indirect, or induced) of an organization, sector or industry on a specific country or region during a given period. Economic impacts typically considered include gross value added and employment data. See also direct impact; indirect impact; induced impact.
Employees are all persons who work in or for the reporting unit, who have a contract of employment with the unit and who receive compensation in cash or in kind at regular intervals of time.
Experimental development is systematic work, drawing on knowledge gained from research and practical experience and producing additional knowledge, which is directed to producing new products or processes or to improving existing products or processes. See also applied research; basic research.
Exports are goods produced or manufactured in Canada that are subtracted from the stock of material resources in Canada, as a result of their movement out of the country.
A foreign-controlled company is any company whose country of control is not Canada, see country of control.
Full-time equivalent (FTE) is the total hours worked divided by average annual hours worked in full-time jobs.
Full-time equivalent (FTE) R&D personnel is defined as the ratio of working hours actually spent on R&D during a specific reference period (usually a calendar year) divided by the total number of hours conventionally worked in the same period by an individual or by a group.
Gross Domestic Product (GDP) is the total unduplicated value of the goods and services produced in the economic territory of a country or region during a given period. See also value added.
Gross value added is a measure of the contribution that a producer, industry or sector makes to GDP, it is defined as the value of output less the value of intermediate consumption. See also gross domestic product (GDP) and intermediate consumption.
Imports are goods that have entered the country by crossing territorial (customs) boundaries, whether for immediate domestic consumption or for storage in customs warehouses. Re-imports are included in Canadian trade data. These are goods, materials or articles that are imported in either the same condition in which they were exported or after undergoing repair or minor alterations (e.g., blending, packaging, bottling, cleaning or sorting) that leave them essentially unchanged. Domestic re-imports are goods of Canadian origin, whether grown, extracted, or manufactured in Canada that are exported to another country and then returned to Canada in ‘the same state’ as they were sent out. See also exports.
Indirect impacts are upstream economic activities associated with supplying intermediate inputs (the current expenditures on goods and services used up in the production process) to the directly impacted industries. See also direct impact; induced impact.
Induced impacts are additional economic activities derived from the labour income generated by both the direct and indirect effects when spent in the market place. See also direct impact; indirect impact.
An industry is a group of establishments engaged in the same, or similar, kinds of economic activity. See also North American Industry Classification System (NAICS); sector.
In-house R&D is expenditures within Canada for R&D performed within this business by employees or self-employed individuals or contractors who are working on site on a business’s R&D projects.
Intermediate consumption is the products used by an industry to produce outputs. These products may come from domestic production or from imports. See gross value added.
Labour income consists of the sum of wages and salaries and employer’s social contributions of employees and the labour income of the self-employed.
North American Industry Classification System (NAICS) is a business-classification system developed through a partnership among the United States, Mexico and Canada. Companies are classified by their same or similar production processes. NAICS Canada 2017 Version 3.0 divides the Canadian economy into 20 sectors, 102 subsectors, 324 industry groups, 710 industries and 928 Canadian industries. See also sector; industry.
Other current costs are non-capital purchases of materials, supplies, equipment and services to support R&D performed by the reporting unit in the reference year. Examples are water and fuel (including gas and electricity); books, journals, reference materials, subscriptions to libraries, scientific societies, etc.; imputed or actual costs of small prototypes or models made outside the reporting unit; and materials for laboratories (e.g., chemicals, animals, etc.). Other current costs include royalties or licences for the use of patents and other intellectual property rights, the lease of capital goods (machinery and equipment, etc.) and the rental of buildings to support R&D performed by the reporting unit in the reference year. Overhead costs associated with R&D are also included in other current costs. See also currentR&D expenditures.
Output consists primarily of the value of goods and services produced by an industry.
Outsourced R&D are payments made within or outside Canada to other businesses, organizations or individuals to fund R&D performance through grants, fellowships, or contracts.
R&D personnel are all persons engaged directly in R&D, whether employed by the reporting unit or external contributors fully integrated into the reporting unit’s R&D activities, as well as those providing direct services for the R&D activities (such as R&D managers, administrators, technicians and clerical staff).
The reporting unit is the unit from which data are reported. This corresponds to the unit that would receive a questionnaire or interview. In the case of administrative data, it would correspond to the unit that is represented by the individual record.
Research and development (R&D) is creative and systematic work undertaken in order to increase the stock of knowledge – including knowledge of humankind, culture and society – and to devise new applications of available knowledge. See also applied research; basic research; experimental development.
Researchers are professionals engaged in the conception or creation of new knowledge. They conduct research and improve or develop concepts, theories, models, techniques instrumentation, software or operational methods.
The Scientific Research and Experimental Development (SR&ED) Tax Incentive Program is intended to encourage Canadian businesses of all sizes and in all sectors to conduct R&D in Canada. These tax incentives come in three forms: an income tax deduction, an investment tax credit (ITC), and, in certain circumstances, a refund. Corporations, individuals, trusts and members of a partnership can use these Government of Canada incentives.
A sector is a high level section of the economy encompassing economic activity in several related industry groups. See also industry; North American Industry Classification System (NAICS).
5.2 Populations
The IMC provided two cohort lists to Statistics Canada. The first was a list of its members. The second was a list of peer companies, comprising those in the pharmaceutical space that were actively involved in developing new medicines and treatments. It excluded generic pharmaceutical manufacturers, wholesalers without R&D in Canada, pure medical device manufacturers and businesses primarily involved in veterinary medicines. Statistics Canada supplemented the peer list with companies whose R&D was primarily focused on human medicine and health sciences. Data in the report comprised estimates for the R&D pharmaceutical sector (both IMC members and the peer group) and IMC members only.
5.3 Business structures
For collection purposes, Statistics Canada distinguishes between four different business levels, all of which are present in all businesses in Canada. These levels, from highest to lowest, are enterprise, company, establishment, and location. For simple businesses, particularly those where all business activities are based in one location, there are no practical differences between the four levels. Statistics Canada recognizes that complex businesses, which may haves a head office and separate locations for regional offices, R&D, manufacturing, sales, etc., produce and record different types of information at different levels within the business. Therefore, different levels of entities are surveyed depending on the nature of the data being sought.
This study pulled data from several different Statistics Canada business surveys, which surveyed companies at different business levels. The cohort lists provided to Statistics Canada were at the company level. Statistics Canada linked entities at the company level to those at the establishment or enterprise levels, depending on the suitable conceptual level for the data.
Data on gross value added and employment, and all associated impacts – direct, indirect and induced – were processed at the establishment level, the lowest level at which accounting data required to measure production is available.
Tax data are processed by the Canada Revenue Agency at the business number level, which generally corresponds to the company level. Since many companies that perform R&D report Scientific Research and Experimental Development (SR&ED) tax credit claims, R&D data are collected at the same level as tax data to reduce response burden by enabling reporting units to use the same accounting level for reporting R&D.
Trade and financial data are collected at the enterprise level, the highest level within the business structure. This is the level at which businesses keep these types of records.
Where a complex enterprise has a company which is part of the R&D pharmaceutical sector and another company which is not, both companies are included by virtue of the business organizations reporting structure.
5.4 Methods
Where microdata were provided, analysts undertook a data review to confirm the suitability of the data for use in this report. As a result, one enterprise record was modified to include only business activities in Canada.
The R&D data were comprised primarily of actual respondent data. For more information on data sources, accuracy, and methodology of the RDCI survey please refer to the Integrated Metadatabase, the metadata repository for Statistics Canada products.
5.4.1 Economic impacts
The direct economic impacts of the Canadian R&D pharmaceutical sector were measured on the basis of the sector’s outputs and gross value added. Outputs include the measurement of goods and services produced by an establishment. Gross value added measures the value of output less the value of intermediate consumption, which consists of all goods and services used up in the course of production within an accounting period.
The calculation of the economic impacts was derived using the 2018 through 2020 tax data associated with the companies and enterprises identified as members of IMC, as well as the overall sector. This information was entered into the Statistics Canada Input-Output Model Simulations (Statistics Canada service 36-23-0002) which provided estimates for the other direct impact metrics such as labour income, jobs and FTEs, as well as the indirect and induced economic impact for all variables.
The Statistics Input-Output Model Simulations is derived from the Supply and Use Tables (Statistics Canada catalogue 15-602-X). The model is updated every year to coincide with the most recent version of the Supply and Use Tables. The Input-Output model used in the economic impact study is based on the 2019 version of the Supply and Use tables.
The impact estimates provided by the model for output, gross value added and labour income are derived from information included in the Supply and Use Tables. The impact estimates provided by the model for jobs and FTEs are derived from the labour productivity and related measures by business sector industry and by non-commercial activity consistent with the industry accounts (Statistics Canada table 36-10-0480-01).
- Date modified: