
Correction Notice
An incorrect version of Chart 3 was loaded in error. The Note to readers was revised in Charts 1, 3 and 4 from (April 4th to August 8th) to (July 4th to November 8th) to reflect the possible timeline of business expectations of the “next three months”.
Skip to text
Text begins
Rising inflation is a significant concern within the Canadian economy, as it leads to higher uncertainty and affects the behaviour of both businesses and consumers. Typically, in times of high inflation businesses tend to be more cautious in their capital investments and their hiring practices. The current Canadian economic climate is characterized by both high inflation and a historically low unemployment rate (4.9% in July).Note Supply chain issues, increased demand for goods and services, a highly competitive labour market that saw over a million job vacanciesNote across the country for both April and May, and a 5.2%Note year-over year increase in hourly wages in July, are exerting significant inflationary pressures. The Industrial Product Price Index (IPPI) and the Raw Materials Prices (RMPI) Index were significantly higher year-over-year in July, at 11.9% and 19.1% respectively, although both started showing signs of decline with month-over-month drops of 2.1% and 7.4% respectively from June to July.Note In addition, from a consumer perspective, while the overall rate of inflation was 0.7% in 2020 and 3.4% in 2021,Note it has been much higher in recent months. It reached 7.7%Note year-over-year in May and 8.1%Note in June (the highest since January 1983) before declining back to 7.6%Note in July. In response, the Bank of Canada continued to increase the overnight lending rate by 1.0% to 2.5% in July, in an effort to combat these inflationary pressures and move back towards more stable prices.
From July to early August 2022, Statistics Canada conducted the Canadian Survey on Business Conditions (CSBC). The survey collects information on the environment businesses are currently operating in, and their expectations moving forward.
Inflation expectations
Businesses reported on the obstacles they expected to face over the next three months.Note The most expected obstacle in the third quarter of 2022 was rising inflation with 60.0% of businesses reporting this. Businesses in accommodation and food services (78.2%), construction (72.0%), and manufacturing (67.8%) were most likely to expect this obstacle. The second most common obstacle expected over the next three months was the rising cost of inputs including labour, capital, energy and raw materials which was expected by 47.1% of businesses, led by businesses in agriculture, forestry, fishing and hunting (71.7%); manufacturing (71.3%), and; accommodation and food services (69.6%). With the cost of gasoline up 35.6% from the same time last year in July,Note close to two in five (38.4%) businesses expect transportation costs to be an obstacle over the next three months. Higher interest rates are increasing the cost of borrowing, which over one-third of businesses (37.0%) are expecting to be an obstacle over the next three months.

Data table for Chart 1
| Rising Input Costs | Rising Inflation | |
|---|---|---|
| percentage | ||
| Accommodation and food services | 69.6 | 78.2 |
| Construction | 62.2 | 72.0 |
| Manufacturing | 71.3 | 67.8 |
| Retail trade | 49.1 | 65.8 |
| Agriculture, forestry, fishing and hunting | 71.7 | 61.7 |
| All industries | 47.1 | 60.0 |
| Administrative and support, waste management and remediation services | 44.6 | 59.2 |
| Mining, quarrying, and oil and gas extraction | 54.4 | 56.6 |
| Wholesale trade | 51.2 | 56.2 |
| Other services (except public administration) | 44.3 | 56.0 |
| Transportation and warehousing | 44.3 | 54.5 |
| Professional, scientific and technical services | 36.6 | 54.2 |
| Arts, entertainment and recreation | 38.6 | 53.5 |
| Information and cultural industries | 31.4 | 52.8 |
| Health care and social assistance | 29.0 | 51.8 |
| Real estate and rental and leasing | 26.1 | 49.9 |
| Finance and insurance | 20.8 | 41.6 |
|
Note: These results are based on the survey that was in collection from July 4 to August 8, 2022, and respondents were asked what obstacles the business or organization expected in the next three months. As a result, those three months could range from July 4 to November 8, 2022, depending on when the business responded. Source: Canadian Survey on Business Conditions, third quarter of 2022 (Table 33-10-0534-01). |
||
Supply chain challenges
Supply chain issues within Canada and globally have been leading to bottlenecks in the supply of goods which, coupled with pent-up demand, has led to inflationary pressure on the prices of goods domestically and internationally.Note Businesses expected challenges over the next three months related to difficulty acquiring inputs, products or supplies from within Canada (26.8%); difficulty acquiring inputs, products or supplies from abroad (14.4%); and maintaining inventory levels (14.2%). Almost six in ten (58.2%) businesses expecting supply chain challenges reported that these challenges have worsened over the next three months. The top factors that contributed to worsened supply chain challenges were increased delays in deliveries of inputs, products or supplies (82.7%), increased prices of inputs, products or supplies (78.3%), and supply shortages that resulted in fewer inputs, products or supplies being available (72.3%). Supply shortages are leading to an imbalance with demand which is pushing up prices for goods with limited quantities available. Businesses in accommodation and food services (88.8%), construction (86.1%), and manufacturing (85.3%) were the most likely to report increased prices of inputs, products or supplies as a factor that contributed to worsened supply chain challenges.

Data table for Chart 2
| Increased prices of inputs, products or supplies | Supply shortages resulted in fewer inputs, products or supplies being available | |
|---|---|---|
| percentage | ||
| All industries | 78.3 | 72.3 |
| Agriculture, forestry, fishing and hunting | 82.2 | 81.7 |
| Mining, quarrying, and oil and gas extraction | 71.7 | 78.2 |
| Construction | 86.1 | 80.3 |
| Manufacturing | 85.3 | 77.5 |
| Wholesale trade | 79.2 | 72.4 |
| Retail trade | 67.2 | 64.3 |
| Transportation and warehousing | 83.1 | 77.0 |
| Information and cultural industries | 82.2 | 84.2 |
| Real estate and rental and leasing | 78.7 | 55.2 |
| Professional, scientific and technical services | 63.2 | 67.6 |
| Administrative and support, waste management and remediation services | 76.8 | 85.1 |
| Health care and social assistance | 65.6 | 42.0 |
| Arts, entertainment and recreation | 81.7 | 71.2 |
| Accommodation and food services | 88.8 | 77.2 |
| Other services (except public administration) | 73.2 | 67.0 |
|
Note: These results are based on the survey that was in collection from July 4 to August 8, 2022, and respondents were asked what the business or organization experienced in the last three-month period. As a result, those three months could range from April 4 to August 8, 2022, depending on when the business responded. Respondents were asked if the business or organization expected various obstacles over the next three months. If they reported that they expected difficulty acquiring inputs or supplies from within Canada or abroad, or maintaining inventory levels as being obstacles, they were then asked how supply chain challenges experienced by the business or organization have changed over the last three months. If they responded that supply chain challenges have worsened, they were then asked what factors contributed to the worsened supply chain conditions. Source: Canadian Survey on Business Conditions, third quarter of 2022 (Table 33-10-0537-01). |
||
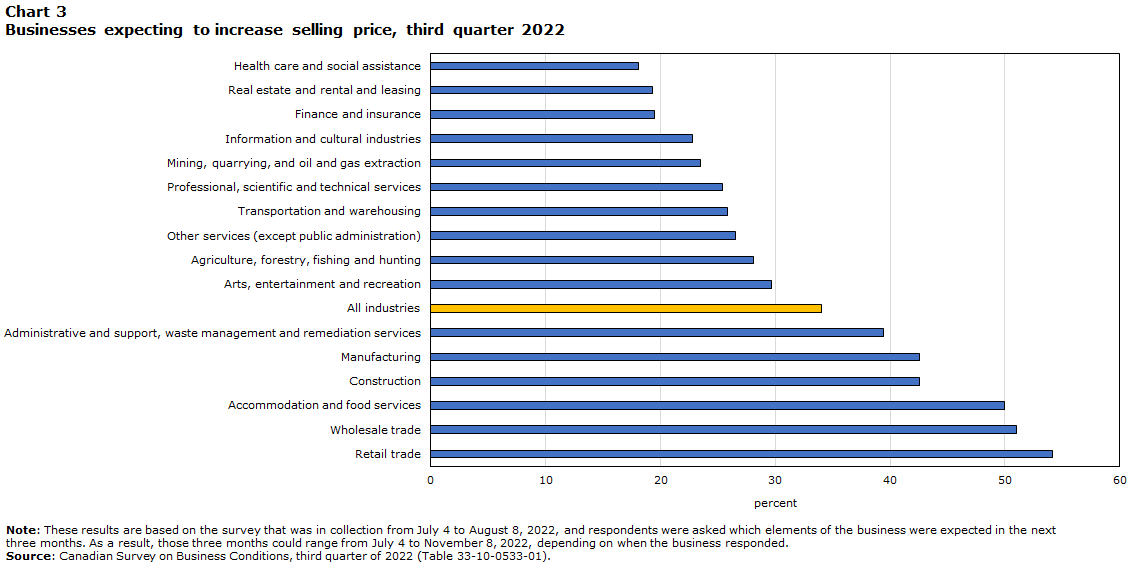
Expected increases in selling prices
In light of supply chain challenges and a global inflationary environment businesses can only absorb the rising cost of inputs up to a point before they pass costs on to consumers. Prolonged increases in input prices eventually find their way into selling prices. Overall, over the next three months, over one-third (34.0%) of businesses expected to increase the selling price of their goods or services. This proportion reaches or exceeds half of all businesses in retail trade (54.1%), wholesale trade (51.0%), and accommodation and food services (50.0%).
Data table for Chart 3
| Percentage | |
|---|---|
| Health care and social assistance | 18.1 |
| Real estate and rental and leasing | 19.3 |
| Finance and insurance | 19.5 |
| Information and cultural industries | 22.8 |
| Mining, quarrying, and oil and gas extraction | 23.5 |
| Professional, scientific and technical services | 25.4 |
| Transportation and warehousing | 25.8 |
| Other services (except public administration) | 26.5 |
| Agriculture, forestry, fishing and hunting | 28.1 |
| Arts, entertainment and recreation | 29.7 |
| All industries | 34.0 |
| Administrative and support, waste management and remediation services | 39.4 |
| Manufacturing | 42.6 |
| Construction | 42.6 |
| Accommodation and food services | 50.0 |
| Wholesale trade | 51.0 |
| Retail trade | 54.1 |
|
Note: These results are based on the survey that was in collection from July 4 to August 8, 2022, and respondents were asked which elements of the business were expected in the next three months. As a result, those three months could range from July 4 to November 8, 2022, depending on when the business responded. Source: Canadian Survey on Business Conditions, third quarter of 2022 (Table 33-10-0533-01). |
|
Effectively, the CSBC data on businesses that expect to raise their selling prices over the next three months capture inflationary expectations and, in that sense, make it possible to take an important peek into the near future. Since the second quarter of 2021, the proportion of businesses that expect to raise their selling prices and the rate of inflation, as estimated from the CPI, have mirrored each other closely. While still remaining at a significant level, and after continuous increases going back to the second quarter of 2021, the percentage of businesses expecting to raise their selling prices fell this quarter to a level almost identical to the first quarter of 2022. This trajectory resembles that of the rate of inflation according to recent data, which fell from a record-high 8.1% in June (end of the second quarter of 2022) to 7.6% in July (first month of the third quarter of 2022) – comparable to the 7.7% in May (see chart 4 & 5). This does not mean that the proportion of businesses expected to raise their selling prices is intrinsically linked to inflation. It does not indicate the extent to which their prices will change or whether they will in fact change, either once or more. However, it does provide an indication of how widespread price increases are expected to be. Moreover, the availability of the data by industry also helps indicate that such expected price increases will be led mostly by consumer goods and services.

Data table for Chart 4
| Percent | |
|---|---|
| 2021 | |
| Q2 | 19.9 |
| Q3 | 21.7 |
| Q4 | 25.9 |
| 2022 | |
| Q1 | 35.7 |
| Q2 | 39.0 |
| Q3 | 34.0 |
|
Note: These results are based on the survey that was in collection from July 4 to August 8, 2022, and respondents were asked which elements of the business were expected in the next three months. As a result, those three months could range from July 4 to November 8, 2022, depending on when the business responded. Source: Canadian Survey on Business Conditions, third quarter of 2022 (Table 33-10-0533-01). |
|

Data table for Chart 5
| Percent | |
|---|---|
| Jun-21 | 3.1 |
| Jul-21 | 3.7 |
| Aug-21 | 4.1 |
| Sep-21 | 4.4 |
| Oct-21 | 4.7 |
| Nov-21 | 4.7 |
| Dec-21 | 4.8 |
| Jan-22 | 5.1 |
| Feb-22 | 5.7 |
| Mar-22 | 6.7 |
| Apr-22 | 6.8 |
| May-22 | 7.7 |
| Jun-22 | 8.1 |
| Jul-22 | 7.6 |
| Source: Consumer Price Index, July 2022 (Table 18-10-0004-01). | |
Business conditions
Factoring in supply chain challenges and their expected responses to inflation, such as raising their own prices, half (50.1%) of all businesses expect operating expenses to increase. On the other hand, almost one-fifth (19.9%) of businesses expect their operating income to decrease, up 3.3% from the second quarter of 2022 (16.6%). More than one in three businesses (35.9%) are expecting profitability to decrease in the next three months, with the proportion of businesses in accommodation and food services (58.7%) being significantly larger. The proportion of businesses expecting their cash reserves to decrease stood at 30.2%. It is less beneficial for businesses to maintain cash reserves during times of high inflation as their purchasing power is decreasing more rapidly than in times of more stable prices.
Methodology
From July 4 to August 8, 2022, representatives from businesses across Canada were invited to take part in an online questionnaire about business conditions and business expectations moving forward. The Canadian Survey on Business Conditions uses a stratified random sample of business establishments with employees classified by geography, industry sector, and size. An estimation of proportions is done using calibrated weights to calculate the population totals in the domains of interest. The total sample size for this iteration of the survey is 35,603 and results are based on responses from a total of 17,013 businesses or organizations.
References
Statistics Canada. 2022. Canadian Survey on Business Conditions, third quarter of 2022.
- Date modified: