
Analysis in Brief
Immigrant women among board directors and officers: From admission in Canada to executive roles
Skip to text
Text begins
Acknowledgements
This study was funded by Women and Gender Equality Canada.
Abstract
This study provides the first socioeconomic profile of immigrant women board directors and officers in Canada from an intersectional lens. It presents exploratory estimates by linking data from the Corporations Returns Act with those from the Longitudinal Immigration Database and the T1 Family File. The study analyzes the characteristics of immigrant executives at admission and disparities in family, work and income characteristics, mainly by gender and immigrant status. Furthermore, it informs on the types of businesses in which diverse women executives contribute to corporate governance and strategic decision making.
1. Introduction
The underrepresentation of women persists in management and leadership positions despite their significant gains in the workplace and their higher levels of educational attainment (Moyser 2017; Osler 2021). In the late 2010s, women accounted for one in two workers, whereas among executives, women represented about one in five board directors (Osler 2021; Statistics Canada 2019; Statistics Canada 2020a; Statistics Canada 2021). An initiative to increase the representation of women in leadership positions was broadened to various groups of the Canadian population to include further diversity in top management positions. For that purpose, regulations were implemented through the Canada Business Corporations Act (CBCA). Under this regulation, federally regulated corporations are required to share information on the composition of their board members and senior management who are part of the four employment equity designated groups: women, visible minorities, persons with disabilities and Indigenous individuals.Note Note
To expand on information known on diversity and women in top decision-making roles in Canada, this study sheds light on the path to board directorship and officer positions for immigrant women. Recent findings showed that immigrant women were underrepresented in decision-making roles, as 18% of executive women were immigrants, while immigrant women accounted for one in four Canadian women workers (Longpré-Verret and Richards 2021).
This intersectional analysis fills an important data gap on immigrant women accessing leadership positions in Canada by showing for the first time the socioeconomic characteristics of immigrant executives at admission, and by examining the pay gap between immigrant and Canadian-born executives through a gender lens. The role of women in leadership positions is one of the six key areas of the Gender Results Framework implemented by the federal government to advance gender equality in Canada; having women at all levels of decision making creates a more fair and democratic society.Note Furthermore, Statistics Canada was mandated in Budget 2021 to put the Disaggregated Data Action Plan into effect to promote intersectional analyses on specific groups.
This study also takes place in a particular context as the COVID-19 pandemic has highlighted the contributions of newcomers to the well-being of communities and across all sectors of the economy, and how they were disproportionately represented among essential workers (Statistics Canada 2020b). Concurrently, the aging population, combined with the reduction of the workforce, creates challenges to recruitment, while population growth in Canada is mainly driven by immigration (Statistics Canada 2017a; Statistics Canada 2022a). And more recently, the rising number of refugees caused by the outbreak of the war in Ukraine adding to the number of refugees caused by the civil war in Syria is a factor, among others, encouraging Canada to welcome newcomers. The country seeks to attract talented workers and facilitate their integration into the labour market to ensure their engagement in and contribution to the economy and society in Canada.
To gather information on immigrant women executives, the Corporations Returns Act (CRA) data and the T1 Family File (T1FF) were combined for the period from 2016 to 2018, and then linked to the Longitudinal Immigration Database (IMDB). Given the linkage exercise, the estimates presented in this study are considered exploratory, meaning that they should be vetted in future work and interpreted with caution.
This descriptive analysis also presents current demographic characteristics of immigrant women, as well as the type of firms in which they contribute compared with their Canadian-born counterparts.
2. Previous literature
Since 2015, publicly traded corporations have been required, under the CBCA, to disclose information to shareholders on the gender composition of their corporate board and senior management. Private organizations, measuring progress made by women in leadership and decision-making roles of publicly traded enterprises, noted some progress toward increasing women representation on boards of directors in 2020, while very little improvement was detected for representation in executive officer roles (Osler 2021; MSCI 2021). The Conference Board of Canada revealed that Canada’s disclosure requirements have not improved the pace of change for the appointment of women on boards of directors. Other studies, covering publicly traded enterprises, private enterprises and government business enterprises, found that women board directors and officers were better represented in government business enterprises, large-sized enterprises and firms operating in the utilities and finance sectors (Statistics Canada 2019; Statistics Canada 2020a; Statistics Canada 2021; Statistics Canada 2022b; Longpré-Verret and Richards 2021).
Starting January 1, 2020, Canada has broadened the requirement for diversity under Bill C-25, making it mandatory for federally incorporated enterprises to disclose information on the four employment equity designated groups: women, visible minorities, persons with disabilities and Indigenous individuals. Initial information indicated that very few people who are part of employment equity designated groups occupy decision-making positions in 2020, as corporate boards were composed of 6.8% of members belonging to a visible minority group, 0.5% of persons with disabilities and 0.5% of Indigenous individuals (Osler 2021). Exploratory estimates also illustrated that visible minority women, who did reach management positions in their careers, were more likely to work in low-level positions (Longpré-Verret and Richards 2021). In regard to immigrant women, they were better represented in executive positions, though to a lesser extent than Canadian-born women. They also had a higher level of educational attainment than Canadian-born women and had more frequently chosen a field of study less common among women (science, technology, engineering and mathematics) (Longpré-Verret and Richards 2021).Note
Very little is known about immigrant women in leadership and decision-making roles in Canada. Many researchers have tried to better understand the factors facilitating the participation of immigrant women in Canadian society, given that immigrant women face numerous challenges to integrate into the labour market in Canada. For example, immigrant women have more difficulty than immigrant men to gain recognition of their credentials and work experience, to find an occupation matching their field of study, and to overcome the language barrier (Grondin 2005; Liversage 2009; Houle and Yssaad 2010). Other factors related to gender also influence their participation in the labour market, as immigrant women continue to be particularly affected by cultural gender roles embraced in their source country even after immigration (Levitt 2005; Frank and Hou 2015). Some have argued that they were more likely to work in Canada if the labour force participation rate of women was high in the source country (Blau, Kahn and Papps 2011; Frank and Hou 2015).
In the following sections, the study attempts to determine whether immigrant women executives have the same socioeconomic characteristics as the broader population of immigrant women, and whether immigrant women accessing leadership positions have a different profile than Canadian-born women executives.
3. Data
Exploratory estimates were created using multiple datasets to conduct an intersectional analysis of board directors and officers, mainly by gender and immigrant status. Board directors, who are elected by shareholders, are responsible for supervising the activities of corporations and making decisions on those activities. As for officers, they are in charge of the day-to-day operations of the enterprise and are appointed by board directors. Together, board directors and officers form the management of the corporation.Note
Financial and ownership information is collected on corporations conducting business in Canada through the CRA, along with information on board directors and officers.Note These data were integrated into the Derived Record Depository (DRD), a national dynamic relational database containing only the basic personal identifiers of Canadians. From 2016 to 2018, 44% of board directors and officers were successfully linked to the DRD.Note This subgroup was then integrated to the T1FF, which contains income tax returns and socioeconomic information.Note To distinguish between immigrants and Canadian-born executives, this subgroup was integrated to the IMDB, which is a comprehensive source of information on the characteristics of immigrants at admission and their socioeconomic outcomes after admission.Note
Among the 44,360 executives identified by the CRA from 2016 to 2018, 20,160 were successfully linked to the DRD and then to the T1FF. Out of these individuals, 3,230 were identified as immigrants within the IMDB, accounting for 16.0% of all executives. Immigrant women formed the smallest group, with 660 executives (3%), followed by immigrant men, with 2,570 executives (13%). Their Canadian-born counterparts were better represented, with 3,890 Canadian-born women (19%) and 13,040 Canadian-born men (65%) in decision-making roles.
Executives can be assigned to different positions within corporations: board director exclusively, officer exclusively, or both board director and officer. Some executives occupied both a seat on a board of directors and an officer position in the same corporation or in multiple organizations. In total, 10,930 executives held both a board director seat and an officer position, 7,800 executives occupied an officer position exclusively, and 1,430 executives contributed as board director exclusively. Given the small number of individuals occupying a board director position exclusively, they have been combined with executives who were both board directors and officers for the remainder of the study, except in the earnings section.Note
Immigrants included in the estimates were admitted in Canada in different calendar years, at different ages and in different cohorts.Note Because of a small sample size, the distinction between new immigrants (admitted in Canada five years ago or less), recent immigrants (admitted in Canada for more than 5 to 10 years) and long-term immigrants (admitted in Canada for over 10 years) cannot be made for nearly all estimates presented. Nevertheless, long-term immigrants constituted the largest share of immigrant executives, corresponding to 82% of immigrant women and 73% of immigrant men. Because of a small sample size, immigrants included in the estimates had a permanent or temporary status and are referred to as immigrants for the remaining of the study.Note Permanent immigrants represented 91% of immigrant women executives and 85% of immigrant men executives. People must be at least 18 years old to contribute as board directors in Canada, while there is no additional age restriction for older board members.Note That same age restriction was imposed on board directors and officers examined.
The database used in this study is not necessarily a representative sample of all executives covered by the CRA. Further investigations showed that this sample has a bias toward women, resulting in a potential overrepresentation of women in executive roles. A larger sample would allow for a distinction between new, recent and long-term immigrants. Long-term immigrants may have a different profile, given that they had time to adjust their employment strategy to access top management positions in the host country (e.g., returning to school or language training).
Nonetheless, this study highlights key characteristics of immigrant and Canadian-born women in management roles and draws the path to board directorship and officer positions for diverse women. This intersectional analysis also raises important issues related to discrimination in the labour market, such as gender diversity in top decision-making roles, equal access to management positions, and equal pay when holding similar roles and levels of competencies.
4. Results
Immigrant women executives are more likely to be admitted as a spouse or dependant applicant under the economic category than immigrant men executives
Canadian immigrants can be admitted under three broad admission categories: economic immigrants, family immigrants and refugees.Note The vast majority of immigrant executives were admitted under the economic immigrant category, accounting for two in three immigrant women executives and more than four in five immigrant men executives (Table 1). Meanwhile, about half of the broader immigrant population has been admitted under that category for both genders (Statistics Canada 2017b).
Economic immigrants are selected based on their ability to contribute to the Canadian economy. They must meet a number of admission criteria assessing their human capital, such as their level of education, work experience, knowledge of official languages and age (Houle and Yssaad 2010). Within a heterosexual couple, the spouse who meets the most admission criteria is the most likely to be designated as the principal applicant. This is typically the man, whereas economic immigrant women are more likely to be admitted as spouses and dependant applicants (Banerjee and Phan 2014; Bonikowska and Hou 2017). The ability of the spouses and dependant applicants is not assessed under admission criteria, and they are automatically admitted with the principal applicant. Besides, spouses of principal applicants experience a greater drop in their occupation status after immigration. They are not able to overcome this drop with tenure, while principal applicants do so (Banerjee and Phan 2014). Nonetheless, a trend toward gender parity has been observed in recent years because of the growing number of economic immigrant women admitted as principal applicants in the broader immigrant population (Hudon 2015).
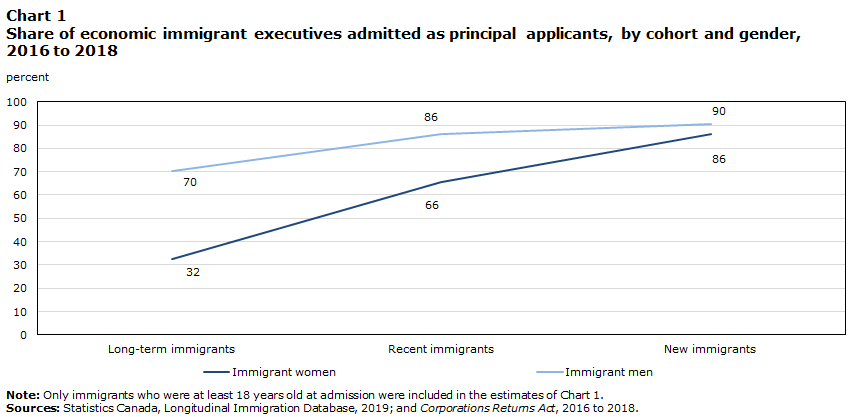
Among economic immigrant executives aged 18 years old and over at admission, these trends were also observed, as women were about 1.8 times (42%) less likely than men (75%) to arrive in Canada as principal applicants, while being more likely to be admitted as a spouse or dependant economic applicant. When immigrant executives were examined by the number of years since admittance to Canada (i.e., new immigrants, recent immigrants and long-term immigrants), a gender gap of 38% was observed among long-term immigrants, and it narrowed gradually to reach 4% among new immigrants (Chart 1).
Immigrant women executives were also more likely to be admitted through the family-sponsorship category than immigrant men executives. Similarly, a trend toward gender parity did show that the share of new immigrant women admitted in the family-sponsorship category decreased compared with long-term immigrant women. Moreover, immigrant women executives (27%) were less likely than the broader population of immigrant women (35%) to be admitted for family reunification (Statistics Canada 2017b).
Data table for Chart 1
| Long-term immigrants | Recent immigrants | New immigrants | |
|---|---|---|---|
| percent | |||
| Immigrant women | 32 | 66 | 86 |
| Immigrant men | 70 | 86 | 90 |
|
Note: Only immigrants who were at least 18 years old at admission were included in the estimates of Chart 1. Sources: Statistics Canada, Longitudinal Immigration Database, 2019; and Corporations Returns Act, 2016 to 2018. |
|||
Immigrant women executives tend to be younger, to have a lower educational attainment and less likely to converse in either French or English
Immigrants are typically admitted at a young age. Younger immigrants (aged 24 to 35 years) were more likely than older immigrants to receive recognition of their credentials and work experience by employers (Houle and Yssaad 2010). The recognition of foreign credentials and work experience is an important factor facilitating the integration of skilled immigrants into the labour market, as is the ability to speak at least one of the official languages (Adamuti-Trache and Sweet 2005; Houle and Yssaad 2010). Among the broader immigrant population, immigrant women tended to arrive at a younger age, have attained a lower level of education and be less likely to speak an official language than immigrant men (Hudon 2015). These gender differences were also reflected between immigrant women and immigrant men occupying leadership positions.
Similarly, immigrant women executives were admitted in Canada at a younger age than immigrant men executives, as women were 22 years of age on average at admission, compared with men, who were 27 years of age on average (Table 1). Immigrant women executives were also more likely to not speak one of the official languages, with 23% reporting knowing neither English nor French, compared with 10% of immigrant men executives. Of the immigrant executives unable to converse in English or French, the majority was born in Asia.
Immigrant women executives reported a lower educational attainment upon arrival than immigrant men executives, as 46% of immigrant women had a bachelor’s degree or above, compared with 59% of immigrant men. This gender gap disappeared for principal applicants admitted under the economic category, as the results suggested no statistical difference between the level of education attainment of immigrant women executives and immigrant men executives—a trend that was also observed among the broader immigrant population of principal applicants admitted under the economic category (Bonikowska and Hou 2017).
Immigrant women executives are more than four times as likely to be born in the United States or the United Kingdom as the broader population of immigrant women
An important shift occurred in the source countries of immigrants after the 1970s, with Asia becoming the most common region of birth. Over the years, Asia stayed the most frequently reported region of birth among immigrants and was the birthplace of 63% of immigrant women who arrived in Canada between 2011 and 2016 (Picot 2008; Statistics Canada 2017b). Before this shift, the most frequently reported region of birth was Europe (Picot 2008).
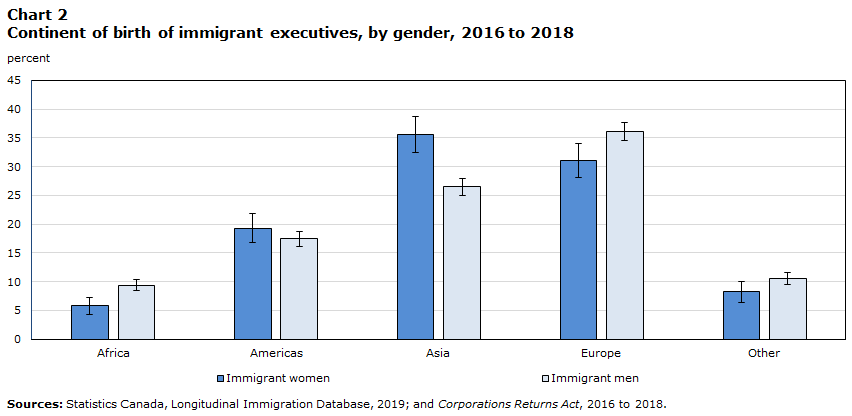
Asia was the most prevalent region of birth among immigrant women executives, as more than one-third of immigrant women were born in that region (Table 1 and Chart 2). Differences were noticed for the top five countries of birth, as immigrant women executives were four times more likely to be born in the United Kingdom or the United States than the broader population of immigrant women. For immigrant women executives, the United States (12%) ranked first as birth country, followed by the United Kingdom (11%), China (8%), Hong Kong (6%) and France (5%). Meanwhile, the top five countries of birth among the overall population of immigrant women were China (11.1%), the Philippines (10.6%), India (10.0%), the United States (2.7%) and the United Kingdom (2.6%) (Statistics Canada 2017b).Note
Results were different for immigrant men executives, because Europe was the most common region of birth (36%), and the top five source countries were the United Kingdom (16%), the United States (12%), India (6%), France (5%) and South Africa (4%). The top five birth countries also differed from those of the overall population of immigrant men: India (11.0%), China (9.8%), the Philippines (8.5%), the United Kingdom (3.1%) and the United States (2.6%) (Statistics Canada 2017b).Note
Additional differences were found when examining the birth country of immigrant executives by number of years since admission. For example, European and American immigrant women were more likely to be new immigrants than Asian women, who were more likely to be long-term immigrants.Note Among immigrant men, Europe was always the most frequently declared birth continent regardless of the number of years spent in Canada.
Some immigrants reached decision-making roles only after a few years lived in Canada. Several studies have demonstrated that recent immigrants from the United States, the United Kingdom and, to a lesser extent, other Western countries were more successful in integrating the Canadian labour market, mainly because of the recognition of their credentials and their origin from an English-speaking region (Boyd and Thomas 2002; Adamuti-Trache and Sweet 2005; Houle and Yssaad 2010).
Data table for Chart 2
| Immigrant women | Immigrant men | Confidence interval immigrant women | Confidence interval immigrant men | |
|---|---|---|---|---|
| percent | ||||
| Africa | 5.8 | 9.4 | 1.5 | 0.9 |
| Americas | 19.3 | 17.4 | 2.5 | 1.2 |
| Asia | 35.6 | 26.5 | 3.1 | 1.4 |
| Europe | 31.1 | 36.1 | 3.0 | 1.6 |
| Other | 8.2 | 10.5 | 1.8 | 1.0 |
| Sources: Statistics Canada, Longitudinal Immigration Database, 2019; and Corporations Returns Act, 2016 to 2018. | ||||
Immigrant women executives are the youngest
Even though women’s participation in the labour market has substantially increased, they continue to play a more important role in regard to housework, childrearing and caregiving responsibilities, and they spend more time than men doing unpaid work (Moyser and Burlock 2018). Among workers in leadership or high-paying positions, similar gender gaps were detected since women were less likely to be in a relationship and to have children (Richards 2019; Longpré-Verret and Richards 2021). These gender gaps were partly reflected among immigrant executives and their Canadian-born counterparts.
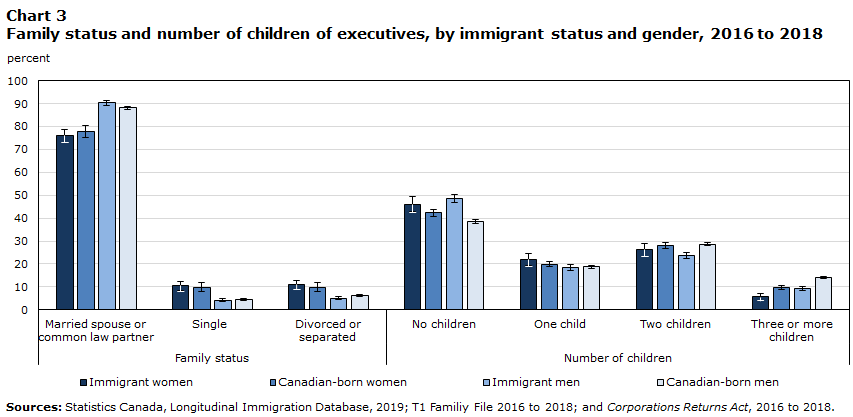
Immigrant women executives were younger and less likely to be in a relationship than immigrant men executives.Note For example, they were 51 years old on average, compared with an average age of 54 for immigrant men executives (Table 2). Moreover, three-quarters of immigrant women were married or in a common-law relationship, compared with 9 in 10 immigrant men (Chart 3). This gender gap slightly narrowed for core-aged immigrant workers aged 25 to 54 years, a period when family responsibilities may be greater. There were similar gender gaps between Canadian-born women and Canadian-born men, as Canadian-born women were on average two years younger and 10 percentage points less likely to be married or in a common-law relationship than Canadian-born men.
Men working in top management or high-paying positions were more likely to have children than women with similar professional responsibilities (Richards 2019; Longpré-Verret and Richards 2021), while the trend was mixed for immigrant and Canadian-born executives (Table 2). The difference in the proportion of immigrant women (46%) and immigrant men (49%) who did not have children was not statistically significant, while it was for Canadian-born executives (43% for Canadian-born women versus 39% for Canadian-born men). Canadian-born men were also more likely to have a larger family, with three or more children.
In contrast with those in the broader immigrant women population—who tended to be older, more likely to be in a relationship and more likely to have children than their Canadian-born counterparts (Hudon 2015)—the results indicated that immigrant women executives were on average younger than Canadian-born women executives (51 years old versus 53 years old) and equally likely to live with a spouse or common-law partner and to have children.Note
Data table for Chart 3
| Immigrant women | Canadian-born women | Immigrant men | Canadian-born men | Confidence Interval Immigrant women | Confidence interval Canadian-born women | Confidence Interval Immigrant men | Confidence interval Canadian-born men | |
|---|---|---|---|---|---|---|---|---|
| percent | ||||||||
| Family status | ||||||||
| Married spouse or common law partner | 76.0 | 77.7 | 90.3 | 88.1 | 2.8 | 2.7 | 1.0 | 0.5 |
| Single | 10.4 | 9.9 | 4.1 | 4.5 | 2.0 | 2.0 | 0.7 | 0.3 |
| Divorced or separated | 10.9 | 9.8 | 5.0 | 6.2 | 2.1 | 2.0 | 0.7 | 0.4 |
| Number of children | ||||||||
| No children | 46.1 | 42.4 | 48.7 | 38.5 | 3.3 | 1.5 | 1.7 | 0.8 |
| One child | 21.9 | 19.9 | 18.3 | 18.7 | 2.7 | 1.2 | 1.3 | 0.6 |
| Two children | 26.2 | 28.0 | 23.6 | 28.6 | 2.9 | 1.3 | 1.4 | 0.7 |
| Three or more children | 5.8 | 9.7 | 9.4 | 14.2 | 1.5 | 0.9 | 1.0 | 0.6 |
| Sources: Statistics Canada, Longitudinal Immigration Database, 2019; T1 Familiy File 2016 to 2018; and Corporations Returns Act, 2016 to 2018. | ||||||||
Immigrant women and Canadian-born women are underrepresented in decision-making positions
About one in four executives were women, and of these, about one in seven were immigrant women. In the broader Canadian working population, women represented almost half of the workforce, while immigrant women counted for one in four women, reflecting the underrepresentation of Canadian-born women and immigrant women in decision-making roles.
Differences were observed in the roles played by immigrant women executives compared with Canadian-born women (Chart 4). The exploratory estimates revealed that immigrant women were equally likely to work as board directors (48%) or officers (52%), since the difference between these two estimates was not statistically significant. Canadian-born women were more likely to contribute as board directors (53%), immigrant men were more likely to occupy a role of board director (61%) than an officer role (39%), and Canadian-born men were also more likely to work as board directors (64%) than officers (36%).
Consistent with previous findings (Muñoz-Bullón 2010; Carter, Franco and Gine 2016), women officers were less likely to occupy top officer roles (e.g., chairperson or president of a company) compared with men officers (Table 4). For example, immigrant women officers were more than two times less likely than immigrant men officers to be president of a company (10% compared with 22%, respectively). Conversely, immigrant women were considerably more likely than immigrant men officers to hold secretary or assistant secretary positions—lower-level positions, or ones with less decision-making authority. These patterns were also observed among Canadian-born executives.

Data table for Chart 4
| Directors | Officers | Confidence interval directors | Confidence interval officers | |
|---|---|---|---|---|
| percent | ||||
| Immigrant women | 48.1 | 51.9 | 3.2 | 3.2 |
| Canadian-born women | 53.0 | 47.0 | 1.3 | 1.3 |
| Immigrant men | 61.3 | 38.7 | 1.6 | 1.6 |
| Canadian-born men | 64.5 | 35.5 | 0.7 | 0.7 |
| Sources: Statistics Canada, Longitudinal Immigration Database, 2019; and Corporations Returns Act, 2016 to 2018. | ||||
Asian women are the most prevalent in board director roles, whereas European women are the most prevalent in officer positions
Differences were also observed in the executive roles played by immigrants according to their region of birth (Chart 5). Among all women executives, Asian women had greater similarity with Canadian-born women, as both were more likely to work as board directors (56% versus 53%, respectively). In contrast, greater differences were shown with European women, who were more frequently working as officers (59%) than Canadian-born women (47%). Nevertheless, European women officers had similar level of influence within corporations, being as likely as Canadian-born women to work in top decision-making roles.Note
African (63%) and Asian (63%) immigrant men were almost as likely as Canadian-born men (65%) to contribute on a board of directors. Roles occupied by American immigrant men were the most distinct. They reported the highest proportion of officers relative to their Canadian-born counterparts (45% versus 36%, respectively) and the greatest participation in top decision-making roles (63% versus 59%, respectively).

Data table for Chart 5
| Directors | Officers | Confidence interval Directors women | Confidence Interval officers | |
|---|---|---|---|---|
| percent | ||||
| Immigrant women | ||||
| Africa | 44.7 | 55.3 | 13.3 | 13.3 |
| Americas | 48.0 | 52.0 | 7.3 | 7.3 |
| Asia | 55.6 | 44.4 | 5.4 | 5.4 |
| Europe | 41.2 | 58.8 | 5.7 | 5.7 |
| Immigrant men | ||||
| Africa | 63.1 | 36.9 | 5.1 | 5.1 |
| Americas | 55.1 | 44.9 | 3.9 | 3.9 |
| Asia | 62.6 | 37.4 | 3.1 | 3.1 |
| Europe | 59.8 | 40.2 | 2.7 | 2.7 |
| Sources: Statistics Canada, Longitudinal Immigration Database, 2019; and Corporations Returns Act, 2016 to 2018. | ||||
Immigrant women executives are more likely to work in large corporations operating in the finance sector, located in Ontario and controlled by American entities
In the Canadian labour market, women have always been better represented in the service sector than in the goods-producing sector (Moyser 2017). Likewise, immigrant women executives and Canadian-born women executives were mostly concentrated within the services industry (e.g., finance, management of companies and enterprises, or distributive trades), especially in the finance industry. Almost one-third of immigrant women worked in finance, compared with more than one in four immigrant men. The magnitude of the gender gap was more pronounced for Canadian-born executives, given that about 4 in 10 Canadian-born women occupied an executive position in finance compared with almost 3 in 10 Canadian-born men (Table 5).
Overall, immigrant women and immigrant men contributed as board directors, officers or both in similar corporations, much like Canadian-born women and Canadian-born men. Most executives worked in large private corporations, located in Ontario and controlled by Canadian entities—a firm characteristic established through the CRA to evaluate foreign control in the Canadian corporate economy (Table 5).Note
Differences in the characteristics of the firms in which executives worked were greater according to the immigrant status. For example, immigrant women were better represented in corporations operating in Ontario, as almost 6 in 10 immigrant women (57%) contributed as executives in that province compared with less than 1 in 2 Canadian-born women (49%).Note Conversely, immigrant women executives were almost two times less likely than their Canadian-born counterparts to contribute in corporations located in Quebec (13%), where one in four Canadian-born women worked (25%). When occupying an executive position in corporations located in Ontario, immigrant women were more likely to have declared at admission to be able to speak English, whereas English–French bilingualism was more predominant in enterprises located in Quebec.
The characteristics of firms in which immigrant executives exercised leadership roles corresponded to those where visible minority executives contributed, although a recent study demonstrated that less than the majority of immigrant executives identified as belonging to a visible minority group—as less than one in three were visible minorities (Longpré-Verret and Richards 2021). Similar to visible minority women executives, immigrant women executives were more likely to contribute to American-controlled entities (2 times more) and larger corporations (about 1.2 times more) than Canadian-born women.Note Similar patterns were found for men executives, except that immigrant men were more represented in Japanese-controlled corporations.
Asian women executives are the least likely to contribute to Canadian-controlled corporations and to work within large corporations
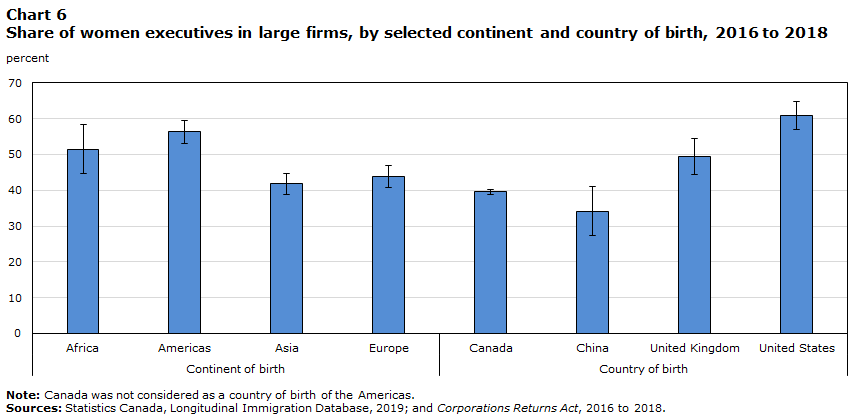
Managers’ origin matters when hiring new workers, because managers are more likely to hire workers with similar backgrounds and origins (Åslund, Hensvik and Skans 2014). Likewise, immigrant executives were more likely to work in corporations controlled in the continent where they were born than immigrant executives born in other continents (Table 6).Note For instance, among executive women, Asian women were the most likely to work in Asian-controlled corporations (11%), while 1% of Canadian-born women contributed to it. By comparison, Asian women were the least likely to work in Canadian-controlled corporations (46%), while Canadian-born women were the most likely to work in Canadian-controlled corporations (79%).
The participation of immigrant women in large firms was greater than that of Canadian-born women—especially for American women—as more than one in two American women (56%) worked in the largest enterprises (Chart 6). On the contrary, Asian women (42%) were the least likely to occupy leadership roles in large firms, representing a similar share to that of Canadian-born women (40%). Examining the top country of birth in those two regions illustrated greater discrepancy; 34% of women born in China worked in large corporations, whereas 61% of women born in the United States worked in large corporations.
Data table for Chart 6
| Large firms | Confidence Interval | |
|---|---|---|
| percent | ||
| Continent of birth | ||
| Africa | 51.4 | 6.8 |
| Americas | 56.3 | 3.2 |
| Asia | 41.7 | 3.0 |
| Europe | 43.8 | 3.0 |
| Country of birth | ||
| Canada | 39.5 | 0.6 |
| China | 34.1 | 6.8 |
| United Kingdom | 49.4 | 5.0 |
| United States | 60.9 | 3.8 |
|
Note: Canada was not considered as a country of birth of the Americas. Sources: Statistics Canada, Longitudinal Immigration Database, 2019; and Corporations Returns Act, 2016 to 2018. |
||
Immigrant women executives register a larger gender pay gap than Canadian-born women executives
Extensive research has been conducted to determine factors contributing to the gender pay gap, as pay discrepancies persist after controlling for socioeconomic characteristics, role, type of enterprise and workplace.Note Essentially, women tend to be segregated in lower-paying roles and distributed differently by industry and firm size (Card, Cardoso and Kline 2016; Pelletier, Patterson and Moyser 2019)—a pattern also observed among executives and top earners (Carter, Franco and Gine 2016; Macdonald 2019; Bonikowska, Drolet and Fortin 2019). The compensation packages accepted by women and men officers were also scrutinized, and researchers found a greater gender pay gap in the variable pay (e.g., stock options) than the base salary, distinguishing a lower-equity incentive among women officers (Muñoz-Bullón 2010; Carter, Franco and Gine 2016).Note Larger gender pay gaps were also associated with male-dominated boards and less gender diversity on compensation committees (Adams and Ferreira 2009; Elkinawy and Stater 2011; Carter, Franco and Gine 2016).
Among immigrant and Canadian-born executives, immigrant women earned the lowest median employment income, at $241,900, and encountered the greatest gender pay gap, at 29% (Chart 7). Canadian-born women earned a median employment income of $256,900, 25% less than Canadian-born men. The employment income of executives was taken from the T4 Statement of Remuneration Paid corresponding to the income received from their everyday jobs and other payments gained in the course of their occupations (such as bonuses, director’s fees, managements fees, pension, etc.).Note Note
When income is examined by role, the gender pay gap for immigrants who were exclusively officers widened, at 30%, relative to the overall gender pay gap of 29% noted among immigrants, while it narrowed significantly to 4% for those contributing as board director exclusively (Table 7). Among Canadian-born individuals who were officers exclusively, a gender pay gap of 28% was found, while it was smaller for those who were board directors exclusively (12%).

Data table for Chart 7
| Median income | Confidence Interval Median | |
|---|---|---|
| 2018 dollars | ||
| Immigrant women | 241,899 | 25,025 |
| Canadian-born women | 256,896 | 15,442 |
| Immigrant men | 339,093 | 36,754 |
| Canadian-born men | 344,349 | 24,721 |
| Sources: Statistics Canada, Longitudinal Immigration Database, 2019; T1 Familiy File 2016 to 2018; and Corporations Returns Act, 2016 to 2018. | ||
In addition to gender obstacles, immigrant women face challenges related to their immigrant status when integrating into the Canadian labour market that explain the lower employment outcomes (e.g., employment rate and earnings) of immigrant women compared with their Canadian-born counterparts, particularly for new and recent immigrants (Yssaad and Fields 2018). Disparities tend to narrow with longer tenure in Canada, and recent data indicated an improvement in the earning of immigrants, tightening the pay gaps further between immigrants and their Canadian-born counterparts (Hudon 2015; Crossman, Hou and Picot 2021). For immigrant executives, these trends were not fully aligned with the literature.
The difference in the median employment income of immigrant women executives and their Canadian-born counterparts was not statistically significant, which was the same between immigrant men executives and Canadian-born men executives.
In contrast, pay gaps differed greatly between immigrant women executives and Canadian-born women executives by the region or country of birth of immigrants (Table 7). For example, immigrant women born in the United States earned a median employment income 15% higher than the one of Canadian-born women. Conversely, Canadian-born women earned a median employment income 34% higher than Chinese women.Note The extent of the pay gaps was even greater among men executives, as Chinese men earned a median employment income 1.8 times less than Canadian-born men and 2.6 times less than men born in the United States.
5. Summary
This is the first study to provide an overview of the socioeconomic profile at admission of immigrant executives and examine the pay gaps of executives through an intersectional lens, by gender and immigrant status. The estimates were created by linking company data to the IMDB. While the results are considered exploratory and should be interpreted with caution, they do begin to build our understanding of the characteristics of immigrant women who are breaking the glass ceiling in reaching executive positions. Essentially, immigrant women executives shared similarities with Canadian-born women executives in terms of the extent of their roles, the type of enterprises in which they contributed as executives, and their current family situation. In contrast, the socioeconomic profile of immigrant women executives differed, to a greater extent, to the profile of the overall population of immigrant women.
Consistent with the broader population of immigrant women, immigrant women executives arrived in Canada at a younger age, were less likely to speak one of the official languages and had a lower level of education attainment than immigrant men executives at admission. In contrast with the broader population of immigrant women, immigrant women executives were more frequently admitted through the economic category and more likely to be born in Western regions, as reported for immigrant men executives.
Once in a management position, immigrant women executives were on average younger than Canadian-born women executives, and as likely to have children and to be in a relationship as them. Among the broader immigrant population, immigrant women were typically older, more likely to have children and more likely to be in a relationship than their Canadian-born counterparts.
In regard to roles, immigrant women were equally likely to work as board directors or officers, while Canadian-born women were slightly more likely to contribute as board directors. Examining estimates by region of birth shows that Asian women’s participation was more similar to that of Canadian-born women, while European women differed because of to their greater participation in officer positions.
Overall, immigrant women executives and Canadian-born women executives tended to participate in similar types of corporations, except a greater share of immigrant women were detected in corporations located in Ontario and entities controlled by the United States. In addition, women born in the United States were the most likely to work in the largest companies, whereas Chinese women were the least likely.
Analyzing the earnings of executives illustrated that the gender pay gap was greater between immigrant executives (29%) than Canadian-born executives (25%). It also demonstrated that immigrant women executives earned a similar median employment income than their Canadian-born counterparts. When examining the income information by region and country of birth, a pay gap between immigrant women executives and Canadian-born women did show.
Differences between immigrant women executives and Canadian-born women executives were more pronounced by region of birth. Immigrant women born in Western countries seemed to perceive a higher employment income than Canadian-born women, whereas Asian women shared even further similarities with Canadian-born women in terms of their distribution across firms, roles and incomes. To measure the contribution of each factor in the gender pay gap and immigrant pay gap of executives, econometric research would be required. Furthermore, granular financial information on the compensation packages accepted by gender and particular group would contribute to better understand its interactions with the gender pay gap of board directors and officers in Canada.
6. Tables
| Women | Men | |
|---|---|---|
| in years | ||
| Average age at admission | 22 | 27 |
| percent | ||
| Age at admission | ||
| Younger than 18 years | 39.3 | 28.7 |
| 18 to 24 years | 16.6 | 12.6 |
| 25 to 34 years | 23.4 | 25.0 |
| 35 to 44 years | 13.1 | 18.6 |
| 45 to 54 years | 6.4 | 12.4 |
| 55 to 64 years | 1.2 | 2.5 |
| 65 years and older | 0.0 | 0.2 |
| Knowledge of official languages | ||
| English as a mother tongue or knowledge of English at admission | 61.9 | 73.6 |
| French as a mother tongue or knowledge of French at admission | 2.1 | 3.2 |
| Does speak English and French | 12.5 | 13.6 |
| Does not speak English or French | 23.0 | 9.6 |
| Unknown | 0.5 | 0.1 |
| Immigrant status | ||
| Permanent | 90.9 | 85.1 |
| Temporary | 9.1 | 14.9 |
| Immigrant cohort | ||
| New immigrants | 12.6 | 18.4 |
| Recent immigrants | 5.3 | 8.4 |
| Long-term immigrants | 82.0 | 73.2 |
| Admission categories | ||
| Economic immigrant, principal applicant | 31.9 | 65.8 |
| Skilled worker and skilled trades worker, principal applicant | 21.9 | 45.1 |
| Business class, principal applicant | Note x: suppressed to meet the confidentiality requirements of the Statistics Act | 2.0 |
| Canadian Experience Class, principal applicant | 5.0 | 12.2 |
| Provincial nominee, principal applicant | 2.9 | 6.5 |
| Economic immigrant, spouse and dependant | 34.2 | 16.1 |
| Skilled worker and skilled trades worker, spouse and dependant | 25.6 | 11.2 |
| Business class, spouse and dependant | 6.5 | 4.3 |
| Canadian Experience Class, spouse and dependant | Note x: suppressed to meet the confidentiality requirements of the Statistics Act | Note x: suppressed to meet the confidentiality requirements of the Statistics Act |
| Immigrant sponsored by family | 26.6 | 15.5 |
| Humanitarian and compassionate cases, refugees, and other immigrants | 7.3 | 2.5 |
| Education level at admission | ||
| High school or less | 38.4 | 25.0 |
| Postsecondary below bachelor's degree | 15.4 | 16.0 |
| Bachelor's degree | 27.7 | 34.9 |
| Master's or doctoral degree | 18.5 | 24.1 |
| Continent and selected country of birth | ||
| Africa | 5.8 | 9.4 |
| Republic of South Africa | 1.2 | 4.0 |
| Americas | 19.3 | 17.4 |
| United States | 12.0 | 12.0 |
| Asia | 35.6 | 26.5 |
| China | 8.1 | 3.5 |
| Hong Kong | 5.6 | 2.6 |
| India | 3.8 | 6.0 |
| Europe | 31.1 | 36.1 |
| France | 4.9 | 5.2 |
| Germany | 1.7 | 3.5 |
| United Kingdom | 10.8 | 15.9 |
| Oceania | 2.1 | 2.3 |
| Other | 6.1 | 8.2 |
|
x suppressed to meet the confidentiality requirements of the Statistics Act Notes: Some demographic characteristics started to be collected through the Longitudinal Immigration Database in 1980, such as the level of education, the admission category and the knowledge of official languages. This is why individuals were not included in the estimates when declaring unknown. Broad admission categories and regions of birth are presented in this table, along with selected subcategories important to immigrant executives to promote more detail. The percentages of the subcategory are calculated from the total of all subcategories, not as a percentage of the broad category. Additionally, only the main subcategories for executives are shown, explaining why the total of subcategories does not sum up to 100%. Sources: Statistics Canada, Longitudinal Immigration Database, 2019; and Corporations Returns Act, 2016 to 2018. |
||
| Women | Men | |||
|---|---|---|---|---|
| Immigrant | Canadian-born | Immigrant | Canadian-born | |
| in years | ||||
| Average age | 51 | 53 | 54 | 55 |
| percent | ||||
| Age | ||||
| 18 to 24 years | 0.0 | Note x: suppressed to meet the confidentiality requirements of the Statistics Act | Note x: suppressed to meet the confidentiality requirements of the Statistics Act | 0.7 |
| 25 to 34 years | 0.0 | Note x: suppressed to meet the confidentiality requirements of the Statistics Act | Note x: suppressed to meet the confidentiality requirements of the Statistics Act | 0.1 |
| 35 to 44 years | 22.7 | 16.7 | 16.6 | 12.6 |
| 45 to 54 years | 41.0 | 40.3 | 37.5 | 33.2 |
| 55 to 64 years | 25.1 | 32.9 | 29.7 | 36.6 |
| 65 years and older | 11.1 | 9.8 | 15.8 | 16.8 |
| Marital status | ||||
| Married spouse or common law partner | 76.0 | 77.7 | 90.3 | 88.1 |
| Single | 10.4 | 9.9 | 4.1 | 4.5 |
| Divorced or separated | 10.9 | 9.8 | 5.0 | 6.2 |
| Widowed | 2.7 | 2.5 | 0.6 | 1.2 |
| Number of children | ||||
| No children | 46.1 | 42.4 | 48.7 | 38.5 |
| One child | 21.9 | 19.9 | 18.3 | 18.7 |
| Two children | 26.2 | 28.0 | 23.6 | 28.6 |
| Three or more children | 5.8 | 9.7 | 9.4 | 14.2 |
|
x suppressed to meet the confidentiality requirements of the Statistics Act Note: Individuals were not included in estimates when declaring unknown for some demographic characteristics. Sources: Statistics Canada, Longitudinal Immigration Database, 2019; Corporations Returns Act, 2016 to 2018; and T1 Family File, 2016 to 2018. |
||||
| Women | Men | |||
|---|---|---|---|---|
| Immigrant | Canadian-born | Immigrant | Canadian-born | |
| percent | ||||
| Proportion of directors and officers | ||||
| Directors exclusively | 6.7 | 8.2 | 5.5 | 7.1 |
| Both board directors and officers | 41.4 | 44.7 | 55.8 | 57.4 |
| Officers exclusively | 51.9 | 47.0 | 38.7 | 35.5 |
| Sources: Statistics Canada, Longitudinal Immigration Database, 2019; and Corporations Returns Act, 2016 to 2018. | ||||
| Women | Men | |||||||
|---|---|---|---|---|---|---|---|---|
| Immigrant | Canadian-born | Immigrant | Canadian-born | |||||
| Occupy the position | Do not occupy the position | Occupy the position | Do not occupy the position | Occupy the position | Do not occupy the position | Occupy the position | Do not occupy the position | |
| percent | ||||||||
| Officer positions | ||||||||
| Chairperson | 1.0 | 99.0 | 2.2 | 97.8 | 4.2 | 95.8 | 5.7 | 94.3 |
| President | 9.6 | 90.4 | 10.2 | 89.8 | 21.6 | 78.4 | 21.8 | 78.2 |
| Vice-president | 24.5 | 75.5 | 23.5 | 76.5 | 25.0 | 75.0 | 26.8 | 73.2 |
| Executive vice-president | 2.6 | 97.4 | 3.5 | 96.5 | 5.5 | 94.5 | 4.5 | 95.5 |
| Secretary | 11.1 | 88.9 | 13.4 | 86.6 | 4.3 | 95.7 | 6.8 | 93.2 |
| Assistant secretary | 5.7 | 94.3 | 8.4 | 91.6 | 1.5 | 98.5 | 2.5 | 97.5 |
| Secretary treasurer | Note x: suppressed to meet the confidentiality requirements of the Statistics Act | Note x: suppressed to meet the confidentiality requirements of the Statistics Act | 1.8 | 98.2 | 1.4 | 98.6 | 1.3 | 98.7 |
| Treasurer | 4.2 | 95.8 | 3.6 | 96.4 | 3.4 | 96.6 | 3.0 | 97.0 |
| Other | 47.0 | 53.0 | 45.3 | 54.7 | 45.4 | 54.6 | 43.2 | 56.8 |
|
x suppressed to meet the confidentiality requirements of the Statistics Act Sources: Statistics Canada, Longitudinal Immigration Database, 2019; and Corporations Returns Act, 2016 to 2018. |
||||||||
| Women | Men | |||
|---|---|---|---|---|
| Immigrant | Canadian-born | Immigrant | Canadian-born | |
| percent | ||||
| Type of corporation | ||||
| Public | 3.2 | 2.7 | 3.6 | 2.5 |
| Private | 96.8 | 97.3 | 96.4 | 97.5 |
| Selected country of control | ||||
| Canada | 53.9 | 78.8 | 49.2 | 78.1 |
| France | 3.3 | 2.2 | 5.1 | 2.0 |
| Germany | 3.7 | 1.1 | 3.6 | 1.2 |
| United Kingdom | 3.7 | 3.2 | 5.1 | 2.4 |
| Japan | 0.6 | 0.5 | 4.5 | 1.1 |
| Switzerland | 1.2 | 0.9 | 2.2 | 1.0 |
| United States | 24.3 | 10.2 | 18.1 | 10.7 |
| Selected firm industry | ||||
| Construction | 2.5 | 2.4 | 4.1 | 4.1 |
| Distributive trades | 11.6 | 7.5 | 13.1 | 10.1 |
| Energy | 3.6 | 2.3 | 4.9 | 3.5 |
| Finance | 33.0 | 37.6 | 27.7 | 29.3 |
| Management of companies and enterprises | 12.7 | 16.2 | 12.7 | 16.0 |
| Manufacturing | 5.9 | 5.2 | 10.2 | 7.7 |
| Utilities | 3.5 | 2.5 | 1.5 | 2.2 |
| Size by assets | ||||
| Small | 18.6 | 19.2 | 16.7 | 19.6 |
| Small to medium | 15.1 | 20.4 | 18.5 | 20.1 |
| Medium to large | 19.3 | 20.8 | 23.5 | 22.2 |
| Large | 46.9 | 39.7 | 41.3 | 38.1 |
| Operating region | ||||
| Atlantic region | 4.2 | 3.7 | 3.1 | 4.5 |
| Quebec | 13.3 | 25.1 | 12.3 | 23.4 |
| Ontario | 57.3 | 48.5 | 57.7 | 44.2 |
| Manitoba | 1.8 | 3.1 | 1.2 | 3.3 |
| Saskatchewan | 0.4 | 1.5 | 1.2 | 1.9 |
| Alberta | 13.0 | 11.7 | 11.6 | 13.4 |
| British Columbia | 9.8 | 6.4 | 12.6 | 9.3 |
| Territories | 0.2 | 0.1 | 0.2 | 0.1 |
|
Note: Company size was determined by assets, then classified by quartile. More specifically, smaller firms were classified in the first quartile, small-to-medium companies were classified in the second quartile, medium-to-large firms were classified in the third quartile and larger firms were classified in the fourth quartile. Sources: Statistics Canada, Longitudinal Immigration Database, 2019; and Corporations Returns Act, 2016 to 2018. |
||||
| Women | Men | |||||||||
|---|---|---|---|---|---|---|---|---|---|---|
| Immigrant | Canadian-born | Immigrant | Canadian-born | |||||||
| African | American | Asian | European | African | American | Asian | European | |||
| percent | ||||||||||
| Selected regions of control | ||||||||||
| Americas | 15.1 | 36.9 | 23.5 | 20.8 | 10.5 | 14.6 | 36.6 | 13.2 | 16.1 | 11.1 |
| Asia | 0.0 | 1.7 | 10.9 | 1.2 | 1.3 | 6.8 | 3.0 | 31.3 | 3.6 | 2.2 |
| Canada | 69.9 | 53.3 | 46.0 | 55.2 | 78.8 | 61.4 | 46.3 | 42.9 | 47.3 | 78.1 |
| Europe | 15.1 | 7.4 | 19.6 | 22.2 | 9.1 | 16.9 | 13.3 | 11.6 | 32.8 | 8.3 |
|
Notes: The distribution of executives by enterprise region of control is presented as a percentage of the total number of executives by region of birth. Not all regions of control are included in the table; thus, columns may not always sum to 100%. All countries in the Americas, such as the United States, Mexico, Argentina and Cuba, are included in the selected region of control —Americas— except enterprises controlled by Canadian entities. Sources: Statistics Canada, Longitudinal Immigration Database, 2019; and Corporations Returns Act, 2016 to 2018. |
||||||||||
| Women | Men | |||
|---|---|---|---|---|
| Immigrant | Canadian-born | Immigrant | Canadian-born | |
| 2018 dollars | ||||
| Median income | 241,900 | 256,900 | 339,100 | 344,300 |
| Median income, directors exclusively | 219,500 | 165,700 | 229,800 | 188,000 |
| Median income, both directors and officers | 242,200 | 268,100 | 340,500 | 347,700 |
| Median income, officers exclusively | 242,900 | 260,400 | 347,000 | 360,700 |
| Median income by selected continent of birth | ||||
| Africa | 280,600 | Note ...: not applicable | 380,500 | Note ...: not applicable |
| Americas | 273,000 | Note ...: not applicable | 435,700 | Note ...: not applicable |
| Asia | 209,000 | Note ...: not applicable | 273,300 | Note ...: not applicable |
| Europe | 250,600 | Note ...: not applicable | 365,900 | Note ...: not applicable |
| Median income by selected country of birth | ||||
| China | 168,900 | Note ...: not applicable | 195,000 | Note ...: not applicable |
| Republic of South Africa | Note x: suppressed to meet the confidentiality requirements of the Statistics Act | Note ...: not applicable | 458,600 | Note ...: not applicable |
| United Kingdom | 329,300 | Note ...: not applicable | 424,600 | Note ...: not applicable |
| United States | 300,900 | Note ...: not applicable | 513,500 | Note ...: not applicable |
|
... not applicable x suppressed to meet the confidentiality requirements of the Statistics Act Notes: The income of executives comes from the employment income declared in the T4 Statement of Remuneration Paid available in the T1 Family File for 2016, 2017 and 2018. Income values for 2016 and 2017 were adjusted for inflation, with the 2018 dollars as the reference period. Estimates show a median of all income values declared regardless the year, because of the inflation-adjusted values, by immigrant status and gender for each characteristic. Sources: Statistics Canada, Longitudinal Immigration Database, 2019; Corporations Returns Act, 2016 to 2018; and T1 Family File, 2016 to 2018. |
||||
7. References
Adams, R.B., and D. Ferreira. 2009. “Women in the boardroom and their impact on governance and performance.” Journal of Financial Economics 94 (2): 291–309.
Adamuti-Trache, M., and R. Sweet. 2005. “Exploring the Relationship between Educational Credentials and the Earnings of Immigrants.” Canadian Studies in Population 32(2): 177–201.
Åslund, O., L. Hensvik, and O.N. Skans. 2014. “Seeking Similarity: How Immigrants and Natives Manage in the Labor Market.” Journal of Labor Economics 32(2): 405–441.
Banerjee, R., and M.B. Phan. 2014. “Do Tied Movers Get Tied Down? The Occupational Displacement of Dependent Applicant Immigrants in Canada.” Journal of International Migration and Integration 16(2): 333–353.
Blau, F.D., L.M. Kahn, and K.L. Papps. 2011. “Gender, source country characteristics, and labor market assimilation among immigrants.” The Review of Economics and Statistics 93(1): 43–58.
Bonikowska, A., and F. Hou. 2017. Labour Market Outcomes of Immigrant Women who Arrive as Dependants of Economic immigrant Principal Applicants. Analytical Studies Branch Research Paper Series, no. 390. Statistics Canada Catalogue no. 11F0019M. Ottawa: Statistics Canada.
Bonikowska, A., M. Drolet, and N.M. Fortin. 2019. Earnings Inequality and the Gender Pay Gap in Canada: The Role of Women’s Under-representation Among Top Earners. Economic Insights, no. 088. Statistics Canada Catalogue no. 11-626-X. Ottawa: Statistics Canada.
Boyd, M., and D. Thomas. 2002. “Skilled immigrant labour: Country of origin and the occupational locations of male engineers.” Canadian Studies in Population 29(1): 71–99.
Card, D., A.R. Cardoso, and P. Kline. 2016. “Bargaining, sorting and the gender wage gap quantifying the impact of firms on the relative pay of women.” The Quarterly Journal of Economics 131(2): 633–686.
Carter, M., F. Franco, and M. Gine. 2016. “Executive gender pay gaps: The roles of female risk aversion and board representation.” Contemporary Accounting Research 34(2): 1232–1264.
Crossman, E., F. Hou, and G. Picot. 2021. Are the Gaps in Labour Market Outcomes Between Immigrants and their Canadian-born Counterparts Starting to Close? Economic and Social Reports. Statistics Canada Catalogue no. 36-28-0001. Ottawa: Statistics Canada.
Drolet, M. 2002. “Can the Workplace Explain Canadian Gender Pay Differentials?” Canadian Public Policy 28(s1): 41–63.
Elkinawy, S., and M. Slater. 2011. “Gender differences in executive compensation: Variation with board gender composition and time.” Journal of Economics and Business 63 (1): 23–45.
Frank, K., and F. Hou. 2015. “Beyond culture: Source country female labour force participation and the earning of immigrant women.” Work, Employment and Society 30(3): 1–26.
Grondin, C. 2005. Knowledge of Official Languages Among New Immigrants: How Important Is It in the Labour Market? Statistics Canada Catalogue no. 89-624-X. Ottawa: Statistics Canada.
Houle, R., and L. Yssaad. 2010. Recognition of Newcomers’ Foreign Credentials and Work Experience. Statistics Canada Catalogue no. 75-001-X. Ottawa: Statistics Canada.
Hudon, T. 2015. “Immigrant women.” Women in Canada: A Gender-based Statistical Report. Statistics Canada Catalogue no. 89-503-X. Ottawa: Statistics Canada.
Levitt, P. 2005. “Building bridges: What migration scholarship and cultural sociology have to say to each other.” Poetics 33(1): 49–62.
Liversage, A. 2009. “Vital conjunctures, shifting horizons: high-skilled female immigrants looking for work.” Work, Employment and Society 23(1): 120–41.
Longpré-Verret, L., and E. Richards. 2021. Diversity Among Board Directors and Officers: Exploratory Estimates on Family, Work and Income. Analytical Studies Branch Research Paper Series, no. 462. Statistics Canada Catalogue no. 11F0019M. Ottawa: Statistics Canada.
Macdonald, D. 2019. The Double-Pane Glass Ceiling: The Gender Pay Gap at the Top of Corporate Canada. Canadian Centre for Policy Alternatives. Available at https://www.policyalternatives.ca/publications/reports/double-pane-glass-ceiling (accessed October 27, 2022).
Moyser, M. 2017. “Women and paid work.” Women in Canada: A Gender-based Statistical Report. Statistics Canada Catalogue no. 89-503-X. Ottawa: Statistics Canada.
Moyser, M., and A. Burlock. 2018. “Time use: Total work burden, unpaid work and leisure.” Women in Canada: A Gender-based Statistical Report. Statistics Canada Catalogue no. 89-503-X. Ottawa: Statistics Canada.
MSCI. 2021. Women on Boards – Progress Report 2021. Available at https://www.msci.com/documents/10199/093d46d8-982b-6466-74c9-2629d2c0229a (accessed October 27, 2022).
Muñoz-Bullón, F. 2010. “Gender-compensation Differences Among High-Level Executives in the United-States.” Industrial Relations 49(3).
Osler. 2021. Diversity Disclosure Practices: Diversity and leadership at Canadian public companies. Available at https://www.osler.com/osler/media/Osler/reports/corporate-governance/Osler-Diversity-Disclosure-Practices-report-2021.pdf (accessed October 27, 2022).
Pelletier, R., M. Patterson, and M. Moyser. 2019. The Gender Wage Gap in Canada: 1998 to 2018. Labour Statistics: Research Papers. Statistics Canada Catalogue no. 75-004-X. Ottawa: Statistics Canada.
Picot, G. 2008. Immigrant Economic and Social Outcomes in Canada: Research and Data Development at Statistics Canada. Analytical Studies Branch Research Paper Series, no. 319. Statistics Canada Catalogue no. 11F0019M. Ottawa: Statistics Canada.
Richards, E. 2019. Who Are the Working Women in Canada’s Top 1? Analytical Studies Branch Research Paper Series, no. 002. Statistics Canada Catalogue no. 11F0019M. Ottawa: Statistics Canada.
Statistics Canada. 2017a. Immigration and Diversity: Population Projections for Canada and its Regions, 2011 to 2036. Statistics Canada Catalogue no. 91-551-X.
Statistics Canada. 2017b. 2016 Census of Population, Statistics Canada Catalogue no. 98-400-X.
Statistics Canada. 2019. “Representation of Women on Boards of Directors, 2016.” The Daily. May 5. Statistics Canada Catalogue no. 11-001-X. Available at https://www150.statcan.gc.ca/n1/daily-quotidien/190507/dq190507a-eng.htm.
Statistics Canada. 2020a. “Representation of women on boards of directors, 2017.” The Daily. January 28. Statistics Canada Catalogue no. 11-001-X. Available at https://www150.statcan.gc.ca/n1/daily-quotidien/200128/dq200128b-eng.htm.
Statistics Canada. 2020b. “Impacts on Immigrants and People Designated as Visible Minorities.” The Daily. October 20. Statistics Canada Catalogue no. 11-631-X. Available at https://www150.statcan.gc.ca/n1/pub/11-631-x/2020004/s6-eng.htm.
Statistics Canada. 2021. “Representation of women on boards of directors, 2018.” The Daily. March 23. Statistics Canada Catalogue no. 11-001-X. Available at https://www150.statcan.gc.ca/n1/daily-quotidien/210323/dq210323d-eng.htm.
Statistics Canada. 2022a. “Canada tops G7 growth despite COVID.” The Daily. February 9. Statistics Canada Catalogue no. 11-001-X. Available at https://www150.statcan.gc.ca/n1/daily-quotidien/220209/dq220209a-eng.htm.
Statistics Canada. 2022b. “Representation of women in officer positions, 2016 to 2019.” The Daily. October 17. Statistics Canada Catalogue no. 11-001-X. Available at https://www150.statcan.gc.ca/n1/daily-quotidien/221017/dq221017c-eng.htm.
Yssaad, L. and A. Fields. 2018. The Canadian Immigrant Labour Market: Recent Trends from 2006 to 2017. The Immigrant Labour Force Analysis Series. Statistics Canada Catalogue no. 71-606-X. Ottawa: Statistics Canada.
- Date modified: