
Analysis in Brief
Grants, subsidies, donations, corporate sponsorships and fundraising take centre stage in the not-for-profit performing arts industries in Canada
Skip to text
Text begins
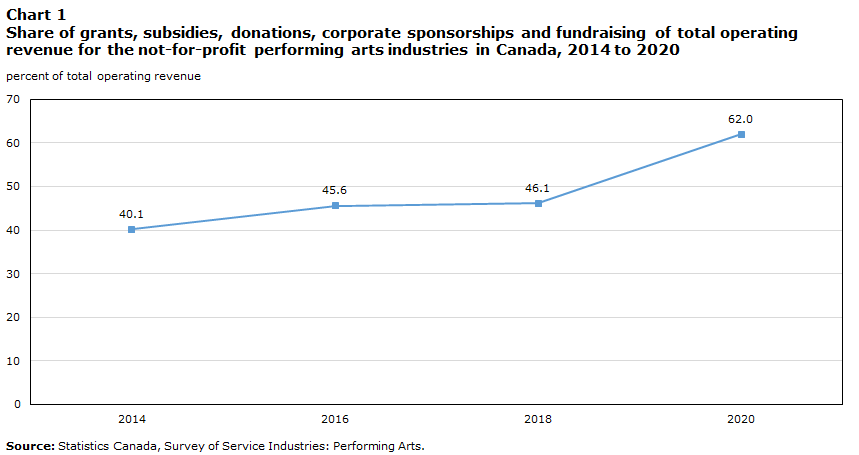
Grants, subsidies, donations, corporate sponsorships and fundraising continue to be an integral part of revenue for Canadian businesses in the not-for-profit performing arts industries.Note Funding in these industries has been rising since comparable data became available in 2014, representing an increasing share of total operating revenue in 2020 (62.0%), up from below half in previous years (see Chart 1). The funding provided can be split into two types: public sector and private sector. Public sector funding consists of subsidies and grants from federal, provincial, territorial, municipal and other government organizations, while private sector funding stems from corporate donations, corporate sponsorships, individual donations, fundraising events, foundations and other private contributions.
Data table for Chart 1
| percent of total operating revenue | |
|---|---|
| 2014 | 40.1 |
| 2016 | 45.6 |
| 2018 | 46.1 |
| 2020 | 62.0 |
| Source: Statistics Canada, Survey of Service Industries: Performing Arts. | |
Because of economic and social conditions, funding in the not-for-profit performing arts industries has changed over time and further evolved throughout the COVID-19 pandemic, with changing access to and availability of funds. Data for this analysis come from the Survey of Service Industries: Performing Arts, which is conducted every two years and collects the financial and operating data needed to produce economic statistics for the performing arts industries in Canada. The most recent data available are for reference year 2020.Note
Public sector funding
In recent years, increasing availability of public sector grants has resulted in growing levels of funding within the industries. Although funding from this source has been rising since 2014, the industries saw the largest increase in public sector grants to date in 2020, up 32.7% from 2018. The primary driver of this growth was federal grant funding, which reached an all-time high in 2020, making up 48.3% of total public sector grants. Traditional federal supports to the industries were supplemented by COVID-19 support programs in 2020, including the Canada Emergency Wage Subsidy; the Emergency Support Fund for Cultural, Heritage and Sport Organizations;Note and advance funding from the Canada Council for the Arts to help organizations meet financial challenges.Note Federal funding to the Canada Council for the Arts has also increased since 2016, when the Government of Canada announced further funds in its budget, to a total of $550 million over four years (2016 to 2020).Note Performing arts companies are also able to access federal grants such as the Canada Cultural Investment Fund, which provides strategic and endowment incentives, gives assistance for collaborative projects, and matches support funds of private sector investments.Note
Conversely, the share of provincial and territorial grants within total public sector funding has declined since 2014, falling from roughly half of all public funding (49.4%) to just over one-third in 2020 (35.5%). Although provincial and territorial funding for the arts has continued to increase steadily in dollar terms, up $24.2 million in the same period, the more rapid growth in federal funding led to the declining share of provincial and territorial funding. Municipal and other government grants have also increased steadily since 2014, representing around 20% of total public sector funding each year; however, their share of funding fell to 16.2% in 2020.

Data table for Chart 2
| Federal grants | Provincial and territorial grants | Municipal and other government grants | |
|---|---|---|---|
| percent | |||
| 2014 | 30.0 | 49.4 | 20.6 |
| 2016 | 31.2 | 45.9 | 22.9 |
| 2018 | 35.9 | 43.9 | 20.2 |
| 2020 | 48.3 | 35.5 | 16.2 |
| Source: Statistics Canada, Survey of Service Industries: Performing Arts. | |||
Private sector funding
While private sector grants were rising before the onset of the COVID-19 pandemic, sponsorships and fundraising events that were heavily impacted by pandemic closures led to a decline in 2020, with total private sector contributions down 9.2% compared with 2018. Overall, the distribution of private sector donations, fundraising and sponsorships has remained relatively unchanged since 2014 (see Chart 3). Individual donations have remained the top private sector contributor in the not-for-profit performing arts industries, representing over one-third of private funding each year, with the highest proportion seen in 2020 (42.9%). This observation aligns with reports indicating that the total dollar value of charitable donations has steadily increased over the same period.Note
The second-largest contributor to private sector funding is foundations, which are Canadian charities that provide funding and support to other not-for-profit and charitable organizations by collecting funds through donations and grants. The amount of revenue stemming from foundations has increased as a share of total private sector funding since 2014, reaching a new high of 21.3% in 2020. The ability of companies to draw on foundations has also been impacted by the disbursement quota mandated by the federal government,Note which governs the amount that must be dispersed annually based on the total funds managed by foundations.
Corporate sponsorships and fundraising events generally represent similar shares of funding, and these were the private sector funding sources most impacted by the COVID-19 pandemic. From 2014 to 2018, both sources remained relatively stable in their share of private sector funding, but they fell to their lowest levels in 2020, with corporate sponsorships at 13.0% of all private sector funding and fundraising events making up 12.2%. These sources were significantly affected by provincial and territorial restrictions implemented during the pandemic, as companies were unable to put on performances to gain sponsors or hold events to raise money throughout much of 2020.
Corporate donations have been declining since reaching their highest level in 2016. After an increase from 2014 to 2016 (+43.4%), funding from this source declined in 2018 (-23.3%) and remained relatively unchanged in 2020 (+0.3%). This funding source is dependent on the generosity of businesses, as well as economic conditions, which may affect the amount of revenue businesses have available to contribute.

Data table for Chart 3
| Sources of private sector revenue, not for profit | 2014 | 2016 | 2018 | 2020 |
|---|---|---|---|---|
| percent | ||||
| Corporate donations | 6.6 | 7.3 | 5.1 | 5.6 |
| Corporate sponsorships | 18.1 | 15.6 | 16.1 | 13.0 |
| Individual donations | 38.1 | 36.4 | 37.6 | 42.9 |
| Fundraising events | 15.5 | 15.2 | 15.6 | 12.2 |
| Foundations | 16.4 | 17.4 | 17.5 | 21.3 |
| Other private sector support | 5.4 | 8.1 | 8.2 | 5.0 |
| Source: Statistics Canada, Survey of Service Industries: Performing Arts. | ||||
Funding across the performing arts industries
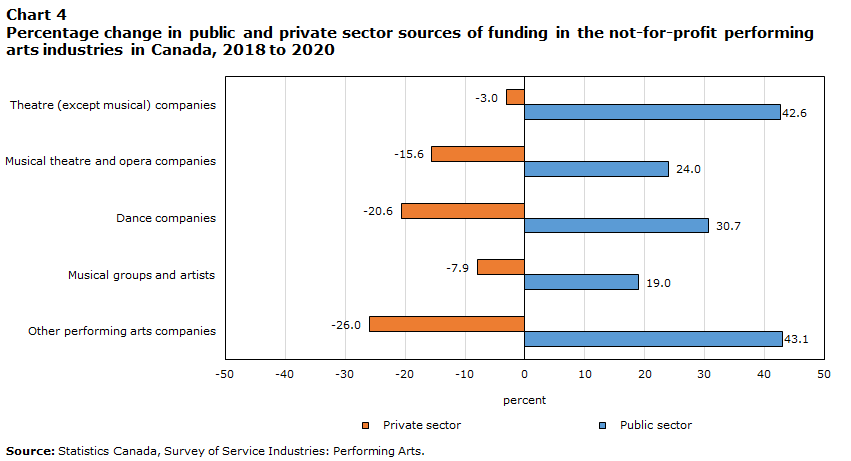
The onset of the pandemic in 2020 heavily impacted the sources of funding across all performing arts industries. Public sector grants expanded across all performing arts industries, while contributions from private sources declined, with the overall impacts varying by industry (see Chart 4).
For theatre (except musical) companies, all funding sources increased in value from 2014 to 2018, except for corporate donations, which declined from 2016 to 2018. With the onset of the pandemic in 2020, all sources of private sector funding in this industry decreased, with the exception of individual donations (+18.4%) and foundation funding (+15.1%). This industry drove the increase in individual donations for the performing arts industries in 2020, up $5.2 million from 2018. Similarly, theatre (except musical) companies saw the largest increase in federal government funding among the performing arts industries in 2020, up $41.4 million from 2018. Although higher funding helped mitigate the economic impact of the pandemic, theatre (except musical) companies were the performing arts industry hardest hit by the pandemic, with sales plummeting $129.6 million in 2020.
Musical theatre and opera companies have had great success in accessing individual donations, which were the largest source of funding for the industry from 2016 to 2020, representing over one-quarter of funding each year. Over the same time span, the largest sources of funding for the other four performing arts industries were public sources. With additional COVID-19 support funds available in 2020, the gap between federal grant funding and individual donations narrowed to its smallest margin ($2.4 million), yet musical theatre and opera companies continued to receive significant support from donors. Thanks to the generosity of individuals, this source of funding made up 28.0% of total funding in 2020. Because of the large impact of individual donations, private sector contributions remained higher than public funding for the industry from 2014 to 2020. However, as contributions from private sector funding contracted in 2020, overall support in this industry edged down 0.8% from 2018 levels. This constituted a further challenge for this industry, where performance revenue fell 58.3%.
Dance companies were the only industry where federal grants were the largest source of funding before 2020. This source of funding was bolstered by COVID-19 relief programs throughout 2020, up $10.1 million from 2018. This contributed to a growing gap between the top funding sources in the industry, with the share of federal grants among total funding increasing to 36.0% and the share of provincial and territorial grants falling to 21.9%. Overall, funding in this industry increased 8.0% in 2020 (+$5.5 million). This was in large part due to increasing public sector contributions, as private sector contributions in the industry declined to around one-third of total funding. However, because of pandemic closures and postponements, growth in funding only softened declining performance revenue in this industry, which fell $9.0 million from 2018.
In all years for which data are available, the largest single source of funding for not-for-profit musical groups and artists (which include symphonies) was provincial and territorial grants. Even in 2020, when federal grants increased $9.5 million to $30.1 million, provincial and territorial grants maintained the largest share of funding in the industry, totalling $32.4 million. However, with large contributions from individual donors, corporate sponsorships and foundations, the private sector accounted for a larger share of funding in this industry than the public sector from 2014 to 2018, providing just over half of total funding each year. After the pandemic spurred a decline in private sector funding (-7.9%), public sector grants became the larger source in this industry, reaching 54.4% of all funding in 2020. Total funding in the industry increased $6.8 million in 2020, though this did little to curb industry losses in sales revenue, which fell $27.9 million from 2018.
Data table for Chart 4
| Public sector | Private sector | |
|---|---|---|
| percent | ||
| Other performing arts companies | 43.1 | -26.0 |
| Musical groups and artists | 19.0 | -7.9 |
| Dance companies | 30.7 | -20.6 |
| Musical theatre and opera companies | 24.0 | -15.6 |
| Theatre (except musical) companies | 42.6 | -3.0 |
| Source: Statistics Canada, Survey of Service Industries: Performing Arts. | ||
Conclusion and outlook
Grants, subsidies, donations, corporate sponsorships and fundraising are expected to continue being integral to the success of the not-for-profit performing arts industries. As businesses resume their operations, other forms of revenue (sales of goods and services, performance revenue, etc.) are expected to increase; however, funding sources will continue to be critical for the economic recovery of these industries. As emergency pandemic supports come to an end, traditional sources of funding will become even more significant for industry operators. As performing arts companies reopen, private sector contributions are expected to increase, although the extent of growth will depend on the recovery among other businesses and general stability in the economy.
- Date modified: