
Analysis in Brief
Forging ahead during the pandemic: How selected service industries
bounced back in 2021

Archived Content
Information identified as archived is provided for reference, research or recordkeeping purposes. It is not subject to the Government of Canada Web Standards and has not been altered or updated since it was archived. Please "contact us" to request a format other than those available.
Skip to text
Text begins
Introduction
In 2020, the first year of the COVID-19 pandemic, several service industries in Canada suffered large financial setbacks despite government support programs. The pandemic led to many changes in the Canadian economy, including remote work and new ways of reaching customers and producing services. Using administrative data, such as goods and services tax (GST)Note revenue, this study assesses how the recovery began to unfold in selected service industries in 2021, even as supply chain disruptions, labour shortages, skill gaps and inflationary pressures intensified.
While the strongest revenue growth in 2021 was observed in accommodation services, that industry remained one of those furthest from a full recovery. Similar to prior years, informatics services such as software publishers and data processing, hosting and related services maintained solid revenue growth in 2021 as the economy continued its digital and online transformation. Other service industries benefited from economic conditions and recorded appreciable revenue growth as well (see Chart 1).

Data table for Chart 1
| 2021 | 2020 | |
|---|---|---|
| percent change | ||
| Software publishers | 8.0 | 8.5 |
| Data processing, hosting and related services | 15.7 | 17.6 |
| Accounting, tax preparation, bookkeeping and payroll services | 5.9 | 2.6 |
| Engineering services | 2.6 | 0.8 |
| Management, scientific and technical consulting services | 10.9 | -2.4 |
| Architectural services | 15.4 | -3.7 |
| Employment services | 10.2 | -9.2 |
| Specialized design services | 6.7 | -9.8 |
| Commercial and industrial machinery and equipment rental and leasing | 19.5 | -15.5 |
| Consumer goods and general rental | 11.3 | -13.6 |
| Accommodation services | 22.9 | -44.8 |
| Travel arrangement and reservation services | -48.8 | -56.9 |
| Source: Statistics Canada’s Annual Services Industries Program. | ||
Assessing the state of the recovery
While the bounce back is occurring at varying speeds and is still far from complete in some sectors, the 2021 revenue of most professional and administrative services industries analyzed in this study surpassed pre-pandemic levels (see Chart 2).
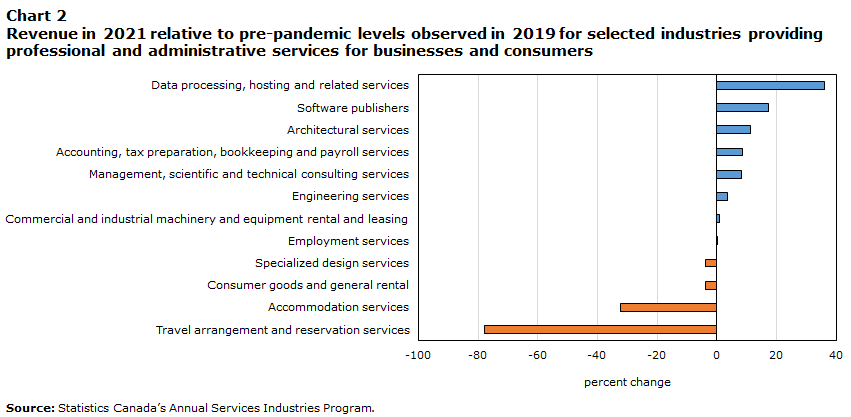
Data table for Chart 2
| Percent change | |
|---|---|
| Data processing, hosting and related services | 36.1 |
| Software publishers | 17.2 |
| Architectural services | 11.1 |
| Accounting, tax preparation, bookkeeping and payroll services | 8.7 |
| Management, scientific and technical consulting services | 8.2 |
| Engineering services | 3.4 |
| Commercial and industrial machinery and equipment rental and leasing | 1.0 |
| Employment services | 0.1 |
| Specialized design services | -3.8 |
| Consumer goods and general rental | -3.8 |
| Accommodation services | -32.2 |
| Travel arrangement and reservation services | -77.9 |
| Source: Statistics Canada’s Annual Services Industries Program. | |
Tourism-related services continued to lag, as did a few other service industries that rely on face-to-face interactions, such as specialized design services, and consumer goods and general rental. In general, an accommodative monetary policy, a resurgence of business non-residential investment and an economy-wide recovery helped selected service industries surpass their pre-pandemic revenue levels in 2021. The following sections of the study will elaborate on factors that spurred the recovery.
Professional business services: Thriving in uncertain times
Unfazed by pandemic challenges, engineering services press forward
Engineering services did not suffer any declines during the pandemic. Despite some disruptions caused by labour shortages, supply chain issues and worker absenteeism, a few major multi-year energy-related projects that started work in recent years in Alberta and British Columbia created positive momentum for the industry. In 2021, along with these ongoing major projects, growing investment in public infrastructureNote and major projects in clean energyNote put the wind in the sails of engineering services. Revenue is estimated to have increased 0.8% in 2020 and 2.6% in 2021.
Housing frenzy boosts architectural services
In 2021, residential construction made its largest contribution to gross domestic product since comparable data became available in 1962.Note Low interest rates and the need to accommodate teleworking boosted housing starts by 24.5% to 271,198 units in 2021 (see Chart 3), with both single and multiple dwellings in high demandNote .

Data table for Chart 3
| Total units | |
|---|---|
| 2009 | 149,081 |
| 2010 | 189,930 |
| 2011 | 193,950 |
| 2012 | 214,827 |
| 2013 | 187,923 |
| 2014 | 189,329 |
| 2015 | 195,535 |
| 2016 | 197,916 |
| 2017 | 219,763 |
| 2018 | 212,843 |
| 2019 | 208,685 |
| 2020 | 217,802 |
| 2021 | 271,198 |
| Source: Statistics Canada, Table 34-10-0126-01. | |
In addition, business and public investment in non-residential buildings posted strong growth, further strengthening the demand for architectural servicesNote (see Chart 4). Revenue for architectural services is expected to have risen 15.4% in 2021, surpassing pre-pandemic levels by more than 1/10.
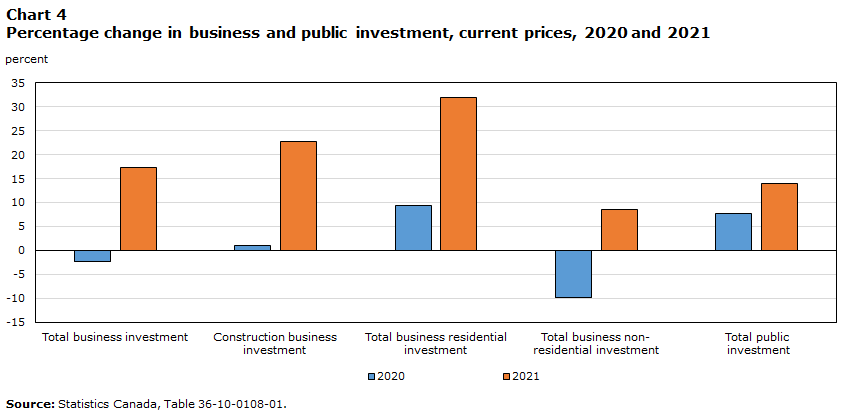
Data table for Chart 4
| 2020 | 2021 | |
|---|---|---|
| percent | ||
| Total business investment | -2.3 | 17.3 |
| Construction business investment | 1.0 | 22.8 |
| Total business residential investment | 9.4 | 31.9 |
| Total business non-residential investment | -9.7 | 8.6 |
| Total public investment | 7.8 | 13.9 |
| Source: Statistics Canada, Table 36-10-0108-01. | ||
Specialized design services benefit from retrofitting of physical spaces and improving economic conditions
The pandemic disrupted many facets of how businesses and the population in general interact in physical spaces. Specialized design services, mainly interior design services, helped people connect and improve virtual and physical interactions and experiences, in terms of both lifestyle and business. Specialized design services also encompass graphic, industrial and other specialized design services that have close ties to the general state of the economy. Revenue of specialized design services rose 6.7% in 2021, almost making up the ground lost during the first year of the pandemic.
Accounting services doing well despite pandemic challenges
Businesses providing accounting, tax preparation, bookkeeping and payroll services have been resilient through the pandemic—it is estimated that their revenue did not decline in 2020 or 2021. After rising 2.6% in 2020, the revenue of these businesses grew 5.9% in 2021. Some changing trends likely helped the industry progress through economic volatility, shifting tax deadlines and government support programs. Over time, this industry has been expanding into non-traditional lines of business, such as advisory and consulting services. Furthermore, as the pandemic forced changes in typical business models, many accounting companies adapted their operating methods (work from home, virtual interactions and cloud-based efficiencies).Note
Another banner year for informatics services
Software publishers and data processing, hosting and related services sustained strong growth in 2021 as more and more businesses embraced digital technologies, cloud-based services and a reimagined future of work. Software publishers saw an 8.0% increase in revenue in 2021, while revenue for data processing, hosting and related services rose 15.7%.
Recovery varies in magnitude for administrative and support services
Tourism-related services still feeling the impacts of the pandemic
Tourism and hospitality businesses continued to face volatility created by the pandemic as travel plans were again rescheduled or cancelled in response to successive waves of COVID-19 and quarantine and border protocols in 2021. Travel restrictions in winter 2021 and the spread of the Omicron variant in late fall limited any real recovery for travel arrangement and reservation services. The federal government requested that all major Canadian airlines interrupt sun destination flights from late January to April 30, 2021.Note Most airlines expanded flight suspensions until the summer. As a result, revenue of travel arrangement and reservation services continued to dwindle in 2021 (-48.8%). That industry suffered the deepest decline during the pandemic. The role of travel agents is also changing as countries and airlines enforce many different entry policies and mandatory health requirements that can be complex for travellers to navigate.Note
The accommodation services industry, which provides a wide range of lodging services (including short-term rentals, hotels, housekeeping cottages and cabins, and recreational vehicle parks and campgrounds), felt the continuing effects of the pandemic but began to recover in 2021.Note After a drop of almost half in 2020, revenue for this industry increased 22.9% in 2021. The industry faced many challenges, including labour shortages (see Chart 5), staff retention and scarce business travel, as fewer face-to-face interactions were needed. While some of these factors may linger as the pandemic runs its course, the accommodation services industry pivoted and accelerated technological developments (for example, mobile applications) that helped fill, in part, some of those gaps.Note
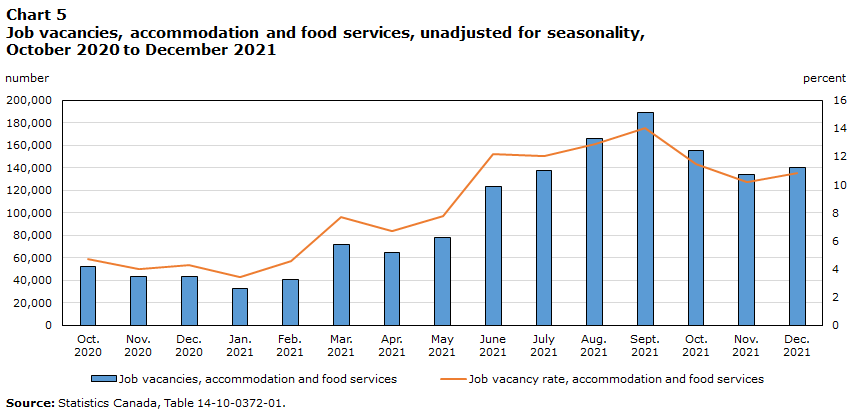
Data table for Chart 5
| Job vacancies, accommodation and food services | Job vacancy rate, accommodation and food services | |
|---|---|---|
| number | percent | |
| 2020 | ||
| October | 52,275 | 4.7 |
| November | 43,370 | 4.0 |
| December | 43,495 | 4.3 |
| 2021 | ||
| January | 33,015 | 3.4 |
| February | 40,275 | 4.6 |
| March | 71,570 | 7.7 |
| April | 64,510 | 6.7 |
| May | 78,365 | 7.8 |
| June | 123,700 | 12.2 |
| July | 137,910 | 12.0 |
| August | 166,005 | 12.9 |
| September | 189,485 | 14.0 |
| October | 155,415 | 11.5 |
| November | 133,605 | 10.2 |
| December | 140,225 | 10.8 |
| Source: Statistics Canada, Table 14-10-0372-01. | ||
Employment services a key link in the economic recovery as labour market tightens
The employment services industry is composed of employment placement agencies and executive search services, temporary help services, and professional employer organizations. Revenue is estimated to have grown 10.2% in 2021 as the economic recovery and labour mobility supported demand for employment services. Labour markets gained traction throughout the year. The unemployment rate dropped to 6.0% by the end of 2021, from a high of 13.4% in May 2020, while most other labour market indicators have fully bounced back or exceeded pre-pandemic levelsNote (see Chart 6). Labour shortages, rising job vacancies and other pressures (an aging workforce and job switching) also fuelled the demand for employment services in 2021.

Data table for Chart 6
| Males, 25 to 54 years-old | Females, 25 to 54 years-old | |
|---|---|---|
| percent | ||
| 2020 | ||
| January | 86.5 | 79.8 |
| February | 86.7 | 79.7 |
| March | 84.8 | 75.6 |
| April | 76.1 | 69.2 |
| May | 77.4 | 70.1 |
| June | 81.6 | 73.7 |
| July | 82.6 | 75.0 |
| August | 83.3 | 75.8 |
| September | 84.2 | 77.7 |
| October | 84.5 | 78.2 |
| November | 84.7 | 78.2 |
| December | 84.6 | 78.1 |
| 2021 | ||
| January | 84.2 | 77.1 |
| February | 84.9 | 78.2 |
| March | 85.5 | 78.4 |
| April | 85.3 | 78.0 |
| May | 85.3 | 77.8 |
| June | 85.3 | 78.5 |
| July | 85.3 | 78.7 |
| August | 85.5 | 78.7 |
| September | 86.2 | 79.9 |
| October | 86.6 | 79.9 |
| November | 87.1 | 80.7 |
| December | 87.8 | 80.7 |
| Source: Statistics Canada, Table 14-10-0287-01. | ||
Rental and leasing services make a comeback
Revenue of the consumer goods and general rental industry rose 11.3%. The industry benefited from the easing of restrictions on business operations and rising demand for renting household appliances (such as home heating systems) as the number of housing starts soared in 2021.Note Revenue of the commercial and industrial machinery and equipment rental and leasing industry grew even more strongly, by 19.5%, as general conditions in the energy sector improved (energy pricesNote and investmentNote ).
Conclusion
Despite the strong bounce back and several positive developments, businesses operating in the service sector are still contending with risks associated with supply chain disruptions, inflationary price and wage pressures, external geopolitical factors, labour constraints, and the easing of government pandemic support programs. Technological and digital advances are playing a role in alleviating some of these challenges, but price and labour pressures are priorities for many businesses operating in the service sector.
Data and methods
Analyzing GST revenue data helps identify business trends before actual survey estimates are compiled.Note After validation, the GST revenue data provided for several service industries a fairly accurate representation of operating revenue, a key input into the measurement of economic statistics such as the gross domestic product.Note Similarly to the first year of the pandemic, comprehensive public assistance programs provided support through wage and rent subsidies to selected businesses in the service sector in 2021.Note While this financial assistance would be accounted for in operating revenue, it does not influence GST revenue remittances and as a result was not part of this analysis.
- Date modified: