
Analysis in Brief
National Gross domestic product by industry, April 2022
Skip to text
Text begins
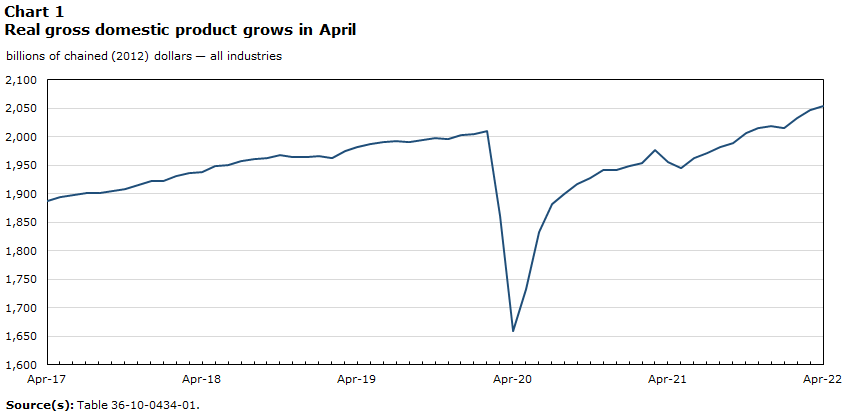
Real gross domestic product rose 0.3% in April, led by growth in goods-producing industries
Real gross domestic product (GDP) rose 0.3% in April, following a 0.7% expansion in March, led by the mining, quarrying and oil and gas extraction sector and client-facing industries.
Data table for Chart 1
| billions of chained (2012) dollars — all industries | |
|---|---|
| 2017 | |
| April | 1,887.38 |
| May | 1,894.83 |
| June | 1,898.39 |
| July | 1,901.64 |
| August | 1,900.33 |
| September | 1,903.85 |
| October | 1,907.30 |
| November | 1,916.04 |
| December | 1,922.74 |
| 2018 | |
| January | 1,922.69 |
| February | 1,930.44 |
| March | 1,936.97 |
| April | 1,937.93 |
| May | 1,948.73 |
| June | 1,951.14 |
| July | 1,957.06 |
| August | 1,960.28 |
| September | 1,962.46 |
| October | 1,968.29 |
| November | 1,964.63 |
| December | 1,964.46 |
| 2019 | |
| January | 1,965.81 |
| February | 1,962.07 |
| March | 1,974.46 |
| April | 1,981.67 |
| May | 1,987.07 |
| June | 1,991.23 |
| July | 1,991.53 |
| August | 1,990.83 |
| September | 1,993.72 |
| October | 1,996.80 |
| November | 1,996.71 |
| December | 2,002.30 |
| 2020 | |
| January | 2,004.92 |
| February | 2,009.78 |
| March | 1,861.25 |
| April | 1,658.39 |
| May | 1,733.39 |
| June | 1,833.54 |
| July | 1,881.32 |
| August | 1,899.03 |
| September | 1,916.77 |
| October | 1,928.24 |
| November | 1,941.30 |
| December | 1,941.07 |
| 2021 | |
| January | 1,948.05 |
| February | 1,953.98 |
| March | 1,976.42 |
| April | 1,955.69 |
| May | 1,944.74 |
| June | 1,962.88 |
| July | 1,971.30 |
| August | 1,982.70 |
| September | 1,989.15 |
| October | 2,006.43 |
| November | 2,016.03 |
| December | 2,018.95 |
| 2022 | |
| January | 2,015.98 |
| February | 2,032.74 |
| March | 2,046.41 |
| April | 2,053.32 |
| Source(s): Table 36-10-0434-01. | |
Both goods-producing (+0.9%) and services-producing (+0.1%) industries were up, as 13 of 20 industrial sectors expanded in April.
Start of text box 1
Real GDP by industry
April 2022
+0.3%
(monthly change)
End of text box 1
Advance information indicates that real GDP decreased 0.2% in May. Output was down in the mining, quarrying and oil and gas extraction, manufacturing and construction sectors. An increase was recorded in the transportation and warehousing sector. Owing to its preliminary nature, this estimate will be updated on July 29 with the release of the official GDP data for May.
Mining, quarrying and oil and gas extraction contributing the most to growth
The mining, quarrying and oil and gas extraction sector expanded 3.3% in April, the largest monthly growth rate since December 2020, attributable to growth in all three subsectors.

Data table for Chart 2
| gross domestic product in billions of chained (2012) dollars | |
|---|---|
| 2017 | |
| April | 147.98 |
| May | 151.00 |
| June | 149.98 |
| July | 152.88 |
| August | 150.45 |
| September | 150.39 |
| October | 146.03 |
| November | 147.44 |
| December | 149.63 |
| 2018 | |
| January | 147.31 |
| February | 152.40 |
| March | 156.34 |
| April | 153.52 |
| May | 156.55 |
| June | 156.05 |
| July | 158.22 |
| August | 158.81 |
| September | 157.39 |
| October | 159.69 |
| November | 157.17 |
| December | 153.17 |
| 2019 | |
| January | 148.89 |
| February | 146.93 |
| March | 151.62 |
| April | 161.21 |
| May | 158.83 |
| June | 159.79 |
| July | 153.48 |
| August | 154.46 |
| September | 155.28 |
| October | 155.46 |
| November | 152.70 |
| December | 152.45 |
| 2020 | |
| January | 156.57 |
| February | 157.19 |
| March | 151.74 |
| April | 138.83 |
| May | 139.50 |
| June | 132.22 |
| July | 134.24 |
| August | 131.87 |
| September | 137.84 |
| October | 138.73 |
| November | 143.28 |
| December | 148.72 |
| 2021 | |
| January | 150.19 |
| February | 148.08 |
| March | 147.65 |
| April | 146.61 |
| May | 147.45 |
| June | 150.09 |
| July | 154.47 |
| August | 153.82 |
| September | 156.34 |
| October | 159.46 |
| November | 154.10 |
| December | 152.56 |
| 2022 | |
| January | 149.06 |
| February | 152.69 |
| March | 154.04 |
| April | 159.08 |
| Source(s): Table 36-10-0434-01. | |
Oil and gas extraction rose 3.9%, a third consecutive monthly increase and the largest since September 2020, buoyed by higher activity across the board.
Oil sands extraction increased 5.6% in April, the largest monthly increase since September 2020. High levels of synthetic oil production and crude bitumen extraction in Alberta contributed the most to the growth. Oil and gas extraction (except oil sands) grew 1.6%, as both crude petroleum and natural gas extraction were up. Support activities for mining, and oil and gas extraction were also up (+6.2%), as all types of services were up.
Mining and quarrying (except oil and gas) edged up 0.2% in April, as a result of increases in non-metallic mineral mining and quarrying, and in coal mining.
Non-metallic mineral mining and quarrying increased 3.6%, fully offsetting a 2.9% decline in March, as potash (+3.9%) mining led the growth.
Accommodation and food services keeps growing
The accommodation and food services sector expanded 4.6% in April, up for a third consecutive month, as both subsectors contributed to the growth.
Food services and drinking places expanded 3.5%, as activity grew in every province and territory. With a third consecutive monthly growth, the subsector surpassed the pre-COVID-19 pandemic level of activity in April.
Accommodation services grew 7.2% in April, driven by increased activity in traveller accommodation as travel restrictions continued to ease, lifting travel activity.
Arts, entertainment and recreation expands
The arts, entertainment and recreation sector increased 7.0% in April, a third consecutive increase, as all subsectors were up. Nevertheless, the sector is still 12% below its February 2020 levels.
Performing arts, sports and related industries and heritage institutions (+11.7%) contributed the most to the growth in April, led by spectator sports. The Toronto Raptors qualified for the NBA playoffs this year, playing late into April in their home arena in front of full crowds for the first time since winning a championship in 2019. Additionally, a number of minor hockey leagues extended their seasons into April to complete postponed games due to lockdown-related restrictions earlier in the year.
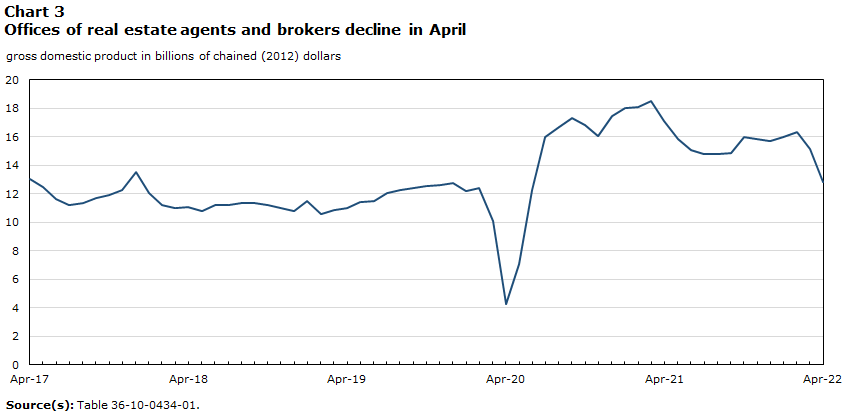
Real estate and rental and leasing contracts
Real estate contracted 0.8% in April, the largest monthly decline since April 2020, down for the second month in a row after a period of eight monthly increases.
Data table for Chart 3
| gross domestic product in billions of chained (2012) dollars | |
|---|---|
| 2017 | |
| April | 13.03 |
| May | 12.48 |
| June | 11.64 |
| July | 11.21 |
| August | 11.37 |
| September | 11.69 |
| October | 11.93 |
| November | 12.29 |
| December | 13.54 |
| 2018 | |
| January | 12.06 |
| February | 11.18 |
| March | 11.02 |
| April | 11.03 |
| May | 10.79 |
| June | 11.20 |
| July | 11.23 |
| August | 11.37 |
| September | 11.33 |
| October | 11.20 |
| November | 10.97 |
| December | 10.78 |
| 2019 | |
| January | 11.50 |
| February | 10.56 |
| March | 10.87 |
| April | 10.98 |
| May | 11.42 |
| June | 11.51 |
| July | 12.03 |
| August | 12.28 |
| September | 12.38 |
| October | 12.52 |
| November | 12.64 |
| December | 12.75 |
| 2020 | |
| January | 12.22 |
| February | 12.37 |
| March | 10.11 |
| April | 4.28 |
| May | 7.08 |
| June | 12.23 |
| July | 15.95 |
| August | 16.66 |
| September | 17.28 |
| October | 16.79 |
| November | 16.08 |
| December | 17.48 |
| 2021 | |
| January | 18.00 |
| February | 18.09 |
| March | 18.47 |
| April | 17.11 |
| May | 15.84 |
| June | 15.08 |
| July | 14.76 |
| August | 14.81 |
| September | 14.85 |
| October | 16.01 |
| November | 15.82 |
| December | 15.66 |
| 2022 | |
| January | 15.96 |
| February | 16.36 |
| March | 15.10 |
| April | 12.83 |
| Source(s): Table 36-10-0434-01. | |
Activity at the offices of real estate agents and brokers dropped 15.0% in April, the largest contraction since April 2020. The rising cost of borrowing contributed towards a continued cooling of the home resale market across the country, with Ontario, British Columbia and Alberta accounting for most of the decline.
Finance is down for the first time in eleven months
The finance and insurance sector contracted for the first time in ten months, down 0.7% in April. A pull-back in the sector followed an elevated level of activity in March spurred on by an unprecedented net inflow of funds in the Canadian economy. With the Canadian central bank ending quantitative easing and hiking the overnight lending rate in April, activity in the bond and other financial instruments markets cooled down. Activity in financial investment services, funds and other financial vehicles contracted 1.8% in April, while credit intermediation and monetary authority contracted 0.4% despite an increase in household mortgage debt as well as in deposits and other consumer debt.
Construction is essentially unchanged
The construction sector was essentially unchanged in April, following three months of growth as subsectors were evenly split between increases and decreases.
Residential building construction contracted 1.2% in April following three months of growth. Weaker activity in home alterations and improvements more than offset across the board expansions in all types of new residential building construction.
Repair construction was down for the first time in four months, decreasing 1.5% in April, as contractions in both the residential and non-residential repair activities contributed to the decline.
Engineering and other construction activities increased 1.5% in April and has expanded continuously since December 2020. Non-residential building construction also rose (+1.4%) in April, as all types of new non-residential building construction were up.
The transportation and warehousing sector expands
The transportation and warehousing sector rose 2.2% in April, up for a third month in a row, as 8 of 10 subsectors were up.
Air transportation expanded 20.0% in April as airlines continued carrying more goods and passengers, as demand for air travel grew for the third month in a row.
Transit, ground passenger, and scenic and sightseeing transportation expanded 6.6% in April, up for the third month in a row, benefitting from an increase in public transit ridership.
Rail transportation rose 3.6%, up for the third time in four months. Higher rail movement of petroleum, chemicals, metals and minerals products along with coal and intermodal freight contributed towards the growth in April.
Postal services contracted 1.8% in April, down for the second time in three months.
Retail trade rebounds
Retail trade rose 0.9% in April, more than offsetting the previous two months of decline, as 7 of 12 subsectors were up.
General merchandise (+4.5%) and miscellaneous retailing (+9.5%) led the growth, while activity at gasoline stations also rose (+5.3%) as domestic travel along with a gradual return to work in offices contributed towards the increased demand at the pumps. Clothing and clothing accessories stores rose 1.7%, pushed up by a higher demand at jewellery, luggage and leather goods stores, driven by travel accessory sales such as luggage.
Building material and supplies retailing declined 4.8% in April, its first decline in four months, but activity levels remain high. Motor vehicle and parts retailing contracted for the third month in a row, down 0.8% in April, as continued lack of inventory supressed the activity at new cars dealers and automotive parts and accessories stores.
Manufacturing keeps growing
The manufacturing sector increased 0.3% in April, a seventh consecutive monthly growth, as higher durable-goods manufacturing offset a decrease in non-durable-goods manufacturing.
Durable-goods manufacturing grew 0.8% in April, with 7 of 10 subsectors posting increases.
Non-durable-goods manufacturing edged down 0.2% in April, driven by a decrease in chemical manufacturing and a contraction in plastics and rubber products manufacturing. Higher petroleum and coal product manufacturing and beverage and tobacco manufacturing offset some of the declines.

Data table for Chart 4
| percentage points | |
|---|---|
| All industries | 0.338 |
| Agriculture and forestry | 0.006 |
| Mining and oil and gas extractionData table for Chart 4 Note 1 | 0.174 |
| Utilities | 0.025 |
| Construction | -0.003 |
| Manufacturing | 0.030 |
| Wholesale | -0.018 |
| Retail | 0.045 |
| Transportation and warehousing | 0.089 |
| Finance and insurance | -0.050 |
| Real estate and rental and leasing | -0.106 |
| Professional, scientific and technical services | 0.015 |
| Accommodation and food services | 0.099 |
| Public sectorData table for Chart 4 Note 2 | -0.039 |
| Others | 0.072 |
|
|
| November 2021Note r: revised | December 2021Note r: revised | January 2022Note r: revised | February 2022Note r: revised | March 2022Note r: revised | April 2022Note p: preliminary | April 2022Note p: preliminary | April 2021Note r: revised to April 2022Note p: preliminary | |
|---|---|---|---|---|---|---|---|---|
| month-to-month % change | millions of dollarsTable 1 Note 1 | % change | ||||||
| All industries | 0.5 | 0.1 | -0.1 | 0.8 | 0.7 | 0.3 | 2,053,317 | 5.0 |
| Goods-producing industries | 0.0 | 0.6 | 0.6 | 0.8 | 1.0 | 0.9 | 592,445 | 4.3 |
| Agriculture, forestry, fishing and hunting | 4.1 | 4.5 | 0.3 | 0.9 | 0.8 | 0.4 | 41,591 | 0.5 |
| Mining, quarrying, and oil and gas extraction | -3.4 | -1.0 | -2.3 | 2.4 | 0.9 | 3.3 | 159,076 | 8.5 |
| Utilities | -1.3 | 2.0 | 4.1 | -2.6 | -0.8 | 1.2 | 42,733 | 5.3 |
| Construction | 0.4 | -0.3 | 2.2 | 1.2 | 1.1 | 0.0 | 155,023 | -0.3 |
| Manufacturing | 1.3 | 1.1 | 0.3 | 0.5 | 1.5 | 0.3 | 196,944 | 6.3 |
| Services-producing industries | 0.6 | 0.0 | -0.4 | 0.8 | 0.5 | 0.1 | 1,457,943 | 5.3 |
| Wholesale trade | 2.5 | 0.5 | 0.1 | -1.0 | -0.8 | -0.3 | 107,281 | 0.3 |
| Retail trade | 0.3 | -2.6 | 2.8 | -0.4 | -0.2 | 0.9 | 106,454 | 4.7 |
| Transportation and warehousing | 0.9 | 0.2 | -2.6 | 2.2 | 2.2 | 2.2 | 79,322 | 12.1 |
| Information and cultural industries | 0.9 | 0.7 | -0.8 | 1.2 | 0.2 | 0.2 | 72,062 | 7.0 |
| Finance and insurance | 0.5 | 0.1 | 0.1 | 0.1 | 0.4 | -0.7 | 152,153 | 3.7 |
| Real estate, and rental and leasing | 0.2 | 0.2 | 0.3 | 0.4 | -0.4 | -0.8 | 267,770 | 0.8 |
| Professional, scientific and technical services | 0.6 | 0.6 | 0.4 | 0.9 | 0.8 | 0.2 | 135,217 | 8.2 |
| Management of companies and enterprises | -2.8 | -3.1 | -3.4 | -2.5 | -2.0 | -2.0 | 2,097 | -28.5 |
| Administrative and support, waste management and remediation services | 0.6 | 1.0 | 0.1 | 1.0 | 0.4 | 0.4 | 49,430 | 4.9 |
| Educational services | 0.3 | 0.2 | -0.6 | 0.4 | -0.3 | 0.0 | 107,128 | 6.1 |
| Health care and social assistance | 0.1 | -0.1 | -0.3 | 0.4 | 0.2 | -0.1 | 145,165 | 1.5 |
| Arts, entertainment and recreation | 4.5 | -3.4 | -11.1 | 8.0 | 12.9 | 7.0 | 13,947 | 74.3 |
| Accommodation and food services | 2.3 | -1.7 | -13.2 | 14.0 | 10.9 | 4.6 | 43,553 | 50.5 |
| Other services (except public administration) | 0.6 | -0.1 | -0.2 | 0.4 | 0.6 | 0.6 | 37,844 | 9.5 |
| Public administration | 0.4 | 0.3 | -0.3 | 1.0 | 0.3 | -0.4 | 139,972 | 2.1 |
| Other aggregations | ||||||||
| Industrial production | -0.5 | 0.6 | 0.0 | 0.7 | 1.0 | 1.3 | 402,976 | 6.8 |
| Non-durable manufacturing industries | 0.8 | 1.6 | -0.5 | 0.2 | 0.8 | -0.2 | 92,123 | 3.8 |
| Durable manufacturing industries | 1.7 | 0.7 | 1.1 | 0.7 | 2.2 | 0.8 | 104,806 | 8.7 |
| Information and communication technologies industries | 1.2 | 0.9 | 0.6 | 1.2 | 0.2 | 0.4 | 112,796 | 8.8 |
| Energy sector | -2.4 | -0.2 | 0.2 | 0.9 | 0.3 | 2.7 | 183,428 | 8.5 |
| Public sector | 0.3 | 0.1 | -0.4 | 0.6 | 0.1 | -0.2 | 392,359 | 2.9 |
|
p preliminary r revised
|
||||||||
Start of text box
Sustainable development goals
On January 1, 2016, the world officially began implementing the 2030 Agenda for Sustainable Development—the United Nations' transformative plan of action that addresses urgent global challenges over the following 15 years. The plan is based on 17 specific sustainable development goals.
The release on gross domestic product by industry is an example of how Statistics Canada supports global sustainable development goal reporting. This release will be used to help measure the following goal:

End of text box
Start of text box
Note to readers
Monthly data on gross domestic product (GDP) by industry at basic prices are chained volume estimates with 2012 as the reference year. This means that the data for each industry and each aggregate are obtained from a chained volume index multiplied by the industry's value added in 2012. The monthly data are benchmarked to annually chained Fisher volume indexes of GDP obtained from the constant-price supply and use tables (SUTs) up to the latest SUT year (2018).
For the period starting in January 2019, data are derived by chaining a fixed-weight Laspeyres volume index to the prior period. The fixed weights are 2018 industry prices.
This approach makes the monthly GDP by industry data more comparable with expenditure-based GDP data, which are chained quarterly.
All data in this release are seasonally adjusted. For information on seasonal adjustment, see Seasonally adjusted data – Frequently asked questions.
An advance estimate of industrial production for May 2022 is available upon request.
For more information on GDP, see the video "What is Gross Domestic Product (GDP)?"
Revisions
With this release of monthly GDP by industry, revisions have been made back to January 2021.
Each month, newly available administrative and survey data from various industries in the economy are integrated, resulting in statistical revisions. Updated and revised administrative data (including taxation statistics), new information provided by respondents to industry surveys, data confrontation and reconciliation process and standard changes to seasonal adjustment calculations are incorporated with each release.
Real-time table
Real-time table 36-10-0491-01 will be updated on July 11.
Next release
Data on GDP by industry for May will be released on July 29.
End of text box
Products
Available tables: 36-10-0434-01 and 36-10-0449-01.
Definitions, data sources and methods: survey number 1301.
The User Guide: Canadian System of Macroeconomic Accounts (13-606-G) is available.
The Methodological Guide: Canadian System of Macroeconomic Accounts (13-607-X) is also available.
The Economic accounts statistics portal, accessible from the Subjects module of the Statistics Canada website, features an up-to-date portrait of national and provincial economies and their structure.
Contact information
For more information, or to enquire about the concepts, methods or data quality of this release, contact us (toll-free 1-800-263-1136; 514-283-8300; infostats@statcan.gc.ca) or Media Relations (statcan.mediahotline-ligneinfomedias.statcan@statcan.gc.ca).
- Date modified: