
Analysis in Brief
Trends in household non-mortgage loans: The evolution of Canadian household debt before and during COVID-19
Skip to text
Text begins
Acknowledgments
This work would not have been possible without the invaluable contributions and expertise of innumerable dedicated staff from Statistics Canada including Carolina Cabañas-Leòn, Lydia Couture, Gilbert Côté, Yves Gauthier, Thomas Haines, Roland Hébert, Lei He, Dragos Ifrim, Alexander Li, Daniela Ravindra, Zaid Shadid, and Jennifer Withington.
Introduction
Policy makers and financial markets pay close attention to household debt to assess prospects for economic growth as well as risks to financial stability.Note 1 In the Bank of Canada’s recent Financial System ReviewNote 2 household indebtedness was identified as one of the key vulnerabilitiesNote 3 in the financial system. It warrants monitoring due to the potential impact it may have on the economy and the fiscal health of Canadian households and those who lend to them. When it comes to debt, households rely on two principal forms of financing. The first, mortgage debt, involves the incurrence of a debt obligation related to the purchase of a property with the latter serving as the collateral. The recent and rapid accumulation of mortgage debt and its potential impact on the financial system continues to be discussed at length in the news and among policy-makers especially given the strength of the Canadian housing market over the course of the pandemic.Note 4 The pandemic’s effect on mortgage borrowing was reviewed in an earlier segment of this COVID-19 debt series in a paper titled “Trends in the Canadian Mortgage Market: Before and during COVID-19”, which focused on the record amount of new mortgage debt drawn in 2020 despite pandemic restrictions.Note 5 The second form of financing, and the one on which this review will focus, involves non-mortgage debt, which is the incurrence of a liability to obtain funds that can be directed to a wide variety of uses. The importance of this type of debt was discussed at length in the Bank of Canada’s annual Financial System Review, with non-mortgage loans accounting for 32% of all outstanding debt as of March 2021, and mortgage debt comprising the remaining 68%.Note 6 A general distinction can be drawn between non-mortgage debt related to consumption, such as the purchase of durable and non-durable goods, and debt unrelated to current consumption, including for investment in financial products or financing for the purchase of fixed assets including renovations. Examples of these uses are provided in the appendix, although given the fungible nature of money, in most cases it is impossible to ultimately determine the precise uses of non-mortgage financing.
Household non-mortgage debt’s growth leading up to, and during the pandemic
Household non-mortgage debt in Canada has grown steadily since the mid-1990s, as interest rates have continued to decline from their peak in the early 1990’s, and credit has become easier to access. As banks tailored new credit products to customers following the 1990’s recession, strong annual growth was observed beginning in 1997, which continued for the next ten years with year-over-year growth reaching a peak in 2005. Following the financial crisis in 2009, annual growth in non-mortgage debt slowed, matching the rate of nominal gross domestic product (GDP) where it has since remained. Non-mortgage borrowing saw a small bump in February 2020, as fears about the impacts of COVID-19 began to set in and households stocked up on supplies and sought to bolster their financial positions against an uncertain future. However, as lockdowns came into full effect and non-essential businesses were forced to close their doors in late March, household consumption plummeted, and the year-over-year growth in non-mortgage debt slowed to near zero in April. Despite resilient household incomes and the roll-out of government support measures to Canadians, households had few places to spend, and many used the pandemic lockdown as an opportunity to save and pay down existing debt. As disposable incomes surged, May 2020 marked the first year-over-year decline in the outstanding balance of non-mortgage debt in nearly three decades. Growth remained negative for the duration of 2020 and into 2021, with March 2021 balances still $11.5 billion below their pre-pandemic levels.

Data table for Chart 1
| Reference Period | Household non-mortgage loans (left axis) | Year-over-year growth in household non-mortgage loans, seasonally adjusted (right axis) |
|---|---|---|
| billions $CAD | percent | |
| 1990 | ||
| January | 121 | Note ...: not applicable |
| February | 122 | Note ...: not applicable |
| March | 123 | Note ...: not applicable |
| April | 123 | Note ...: not applicable |
| May | 124 | Note ...: not applicable |
| June | 124 | Note ...: not applicable |
| July | 125 | Note ...: not applicable |
| August | 125 | Note ...: not applicable |
| September | 126 | Note ...: not applicable |
| October | 126 | Note ...: not applicable |
| November | 126 | Note ...: not applicable |
| December | 126 | Note ...: not applicable |
| 1991 | ||
| January | 127 | 4.27 |
| February | 127 | 3.73 |
| March | 126 | 3.03 |
| April | 127 | 3.30 |
| May | 128 | 3.51 |
| June | 128 | 3.42 |
| July | 128 | 3.18 |
| August | 129 | 3.00 |
| September | 128 | 2.35 |
| October | 128 | 2.11 |
| November | 128 | 1.67 |
| December | 128 | 1.44 |
| 1992 | ||
| January | 129 | 1.47 |
| February | 129 | 1.51 |
| March | 129 | 1.72 |
| April | 129 | 0.93 |
| May | 129 | 0.44 |
| June | 129 | 0.32 |
| July | 129 | 0.64 |
| August | 129 | 0.35 |
| September | 129 | 0.82 |
| October | 130 | 0.96 |
| November | 129 | 0.64 |
| December | 129 | 0.82 |
| 1993 | ||
| January | 130 | 0.83 |
| February | 130 | 0.67 |
| March | 130 | 1.02 |
| April | 130 | 1.28 |
| May | 131 | 1.69 |
| June | 131 | 1.83 |
| July | 132 | 1.93 |
| August | 133 | 2.77 |
| September | 133 | 2.45 |
| October | 133 | 2.55 |
| November | 134 | 3.75 |
| December | 135 | 4.42 |
| 1994 | ||
| January | 135 | 4.35 |
| February | 136 | 4.71 |
| March | 136 | 5.08 |
| April | 137 | 4.99 |
| May | 137 | 4.65 |
| June | 137 | 4.57 |
| July | 138 | 4.49 |
| August | 138 | 4.02 |
| September | 139 | 4.99 |
| October | 141 | 5.82 |
| November | 142 | 5.73 |
| December | 143 | 5.61 |
| 1995 | ||
| January | 143 | 5.82 |
| February | 143 | 5.72 |
| March | 144 | 5.36 |
| April | 145 | 5.68 |
| May | 145 | 6.23 |
| June | 146 | 6.49 |
| July | 147 | 6.64 |
| August | 148 | 6.98 |
| September | 149 | 6.77 |
| October | 150 | 6.31 |
| November | 151 | 6.61 |
| December | 152 | 6.39 |
| 1996 | ||
| January | 153 | 6.90 |
| February | 154 | 7.51 |
| March | 155 | 7.97 |
| April | 156 | 8.17 |
| May | 157 | 8.26 |
| June | 159 | 8.80 |
| July | 160 | 8.71 |
| August | 160 | 8.53 |
| September | 161 | 8.41 |
| October | 162 | 8.59 |
| November | 163 | 8.03 |
| December | 164 | 8.07 |
| 1997 | ||
| January | 165 | 7.89 |
| February | 167 | 8.36 |
| March | 169 | 9.12 |
| April | 170 | 9.04 |
| May | 172 | 9.10 |
| June | 173 | 8.57 |
| July | 174 | 9.04 |
| August | 176 | 9.83 |
| September | 179 | 10.75 |
| October | 180 | 10.95 |
| November | 182 | 11.59 |
| December | 184 | 12.52 |
| 1998 | ||
| January | 186 | 12.79 |
| February | 188 | 12.25 |
| March | 190 | 12.40 |
| April | 193 | 13.31 |
| May | 194 | 12.73 |
| June | 195 | 13.24 |
| July | 197 | 13.25 |
| August | 198 | 12.45 |
| September | 199 | 11.48 |
| October | 200 | 11.18 |
| November | 201 | 10.29 |
| December | 202 | 9.63 |
| 1999 | ||
| January | 204 | 9.44 |
| February | 206 | 9.66 |
| March | 208 | 9.17 |
| April | 209 | 8.25 |
| May | 210 | 8.64 |
| June | 212 | 8.33 |
| July | 213 | 7.83 |
| August | 213 | 7.72 |
| September | 215 | 8.15 |
| October | 217 | 8.40 |
| November | 220 | 9.53 |
| December | 222 | 9.82 |
| 2000 | ||
| January | 218 | 9.82 |
| February | 234 | 10.67 |
| March | 230 | 10.67 |
| April | 231 | 10.35 |
| May | 233 | 10.58 |
| June | 233 | 10.25 |
| July | 236 | 10.97 |
| August | 238 | 11.74 |
| September | 241 | 11.70 |
| October | 243 | 11.90 |
| November | 245 | 11.25 |
| December | 246 | 10.54 |
| 2001 | ||
| January | 248 | 10.54 |
| February | 248 | 8.11 |
| March | 249 | 8.11 |
| April | 250 | 8.28 |
| May | 251 | 7.87 |
| June | 252 | 8.04 |
| July | 254 | 7.51 |
| August | 255 | 6.98 |
| September | 256 | 6.59 |
| October | 257 | 5.94 |
| November | 259 | 5.73 |
| December | 260 | 5.92 |
| 2002 | ||
| January | 262 | 5.60 |
| February | 264 | 6.21 |
| March | 266 | 6.87 |
| April | 267 | 7.03 |
| May | 269 | 7.02 |
| June | 270 | 7.05 |
| July | 272 | 7.15 |
| August | 274 | 7.60 |
| September | 277 | 8.04 |
| October | 279 | 8.41 |
| November | 281 | 8.50 |
| December | 282 | 8.58 |
| 2003 | ||
| January | 283 | 8.09 |
| February | 285 | 7.90 |
| March | 286 | 7.41 |
| April | 289 | 7.91 |
| May | 291 | 8.43 |
| June | 294 | 8.85 |
| July | 298 | 9.60 |
| August | 298 | 8.64 |
| September | 300 | 8.46 |
| October | 302 | 8.39 |
| November | 305 | 8.76 |
| December | 308 | 9.10 |
| 2004 | ||
| January | 311 | 9.75 |
| February | 313 | 9.88 |
| March | 316 | 10.62 |
| April | 319 | 10.64 |
| May | 323 | 10.92 |
| June | 326 | 11.00 |
| July | 329 | 10.47 |
| August | 332 | 11.18 |
| September | 333 | 11.00 |
| October | 337 | 11.35 |
| November | 341 | 11.81 |
| December | 345 | 11.83 |
| 2005 | ||
| January | 351 | 12.83 |
| February | 356 | 13.76 |
| March | 361 | 14.18 |
| April | 363 | 13.71 |
| May | 365 | 13.12 |
| June | 369 | 13.01 |
| July | 371 | 12.61 |
| August | 374 | 12.73 |
| September | 377 | 13.01 |
| October | 380 | 12.78 |
| November | 382 | 12.06 |
| December | 385 | 11.77 |
| 2006 | ||
| January | 389 | 10.89 |
| February | 391 | 9.90 |
| March | 395 | 9.44 |
| April | 398 | 9.51 |
| May | 402 | 9.97 |
| June | 404 | 9.59 |
| July | 408 | 10.08 |
| August | 412 | 10.19 |
| September | 416 | 10.53 |
| October | 419 | 10.36 |
| November | 423 | 10.62 |
| December | 427 | 10.98 |
| 2007 | ||
| January | 431 | 10.89 |
| February | 434 | 11.00 |
| March | 438 | 11.03 |
| April | 442 | 11.23 |
| May | 447 | 11.37 |
| June | 451 | 11.72 |
| July | 455 | 11.65 |
| August | 459 | 11.37 |
| September | 462 | 10.86 |
| October | 465 | 11.00 |
| November | 468 | 10.71 |
| December | 470 | 10.05 |
| 2008 | ||
| January | 474 | 10.01 |
| February | 477 | 9.94 |
| March | 482 | 9.96 |
| April | 485 | 9.74 |
| May | 489 | 9.39 |
| June | 493 | 9.16 |
| July | 497 | 9.03 |
| August | 499 | 8.87 |
| September | 502 | 8.82 |
| October | 504 | 8.42 |
| November | 505 | 7.75 |
| December | 508 | 8.02 |
| 2009 | ||
| January | 511 | 7.84 |
| February | 515 | 7.96 |
| March | 519 | 7.66 |
| April | 522 | 7.48 |
| May | 526 | 7.39 |
| June | 530 | 7.57 |
| July | 533 | 7.27 |
| August | 536 | 7.34 |
| September | 539 | 7.25 |
| October | 545 | 8.02 |
| November | 548 | 8.65 |
| December | 551 | 8.43 |
| 2010 | ||
| January | 552 | 8.00 |
| February | 554 | 7.50 |
| March | 555 | 6.99 |
| April | 557 | 6.73 |
| May | 557 | 6.02 |
| June | 557 | 5.03 |
| July | 559 | 4.90 |
| August | 561 | 4.61 |
| September | 563 | 4.49 |
| October | 566 | 3.82 |
| November | 568 | 3.69 |
| December | 570 | 3.39 |
| 2011 | ||
| January | 577 | 4.52 |
| February | 577 | 4.14 |
| March | 577 | 3.91 |
| April | 580 | 4.08 |
| May | 580 | 4.07 |
| June | 582 | 4.50 |
| July | 583 | 4.42 |
| August | 584 | 4.21 |
| September | 585 | 3.93 |
| October | 585 | 3.43 |
| November | 590 | 3.81 |
| December | 591 | 3.77 |
| 2012 | ||
| January | 592 | 2.48 |
| February | 592 | 2.54 |
| March | 592 | 2.71 |
| April | 594 | 2.42 |
| May | 596 | 2.70 |
| June | 597 | 2.69 |
| July | 598 | 2.46 |
| August | 601 | 2.87 |
| September | 603 | 3.05 |
| October | 604 | 3.31 |
| November | 605 | 2.57 |
| December | 607 | 2.65 |
| 2013 | ||
| January | 607 | 2.56 |
| February | 613 | 3.60 |
| March | 613 | 3.55 |
| April | 614 | 3.48 |
| May | 616 | 3.37 |
| June | 616 | 3.16 |
| July | 619 | 3.52 |
| August | 621 | 3.24 |
| September | 622 | 3.15 |
| October | 623 | 3.04 |
| November | 625 | 3.19 |
| December | 627 | 3.37 |
| 2014 | ||
| January | 629 | 3.65 |
| February | 631 | 2.89 |
| March | 632 | 3.04 |
| April | 633 | 3.10 |
| May | 635 | 3.14 |
| June | 637 | 3.42 |
| July | 639 | 3.35 |
| August | 642 | 3.39 |
| September | 644 | 3.60 |
| October | 646 | 3.77 |
| November | 648 | 3.72 |
| December | 650 | 3.59 |
| 2015 | ||
| January | 652 | 3.61 |
| February | 653 | 3.55 |
| March | 656 | 3.71 |
| April | 658 | 3.95 |
| May | 661 | 4.16 |
| June | 664 | 4.26 |
| July | 666 | 4.16 |
| August | 668 | 4.06 |
| September | 670 | 3.98 |
| October | 671 | 3.82 |
| November | 673 | 3.88 |
| December | 674 | 3.72 |
| 2016 | ||
| January | 676 | 3.79 |
| February | 678 | 3.87 |
| March | 681 | 3.95 |
| April | 685 | 4.11 |
| May | 688 | 3.97 |
| June | 690 | 3.84 |
| July | 692 | 3.92 |
| August | 692 | 3.60 |
| September | 693 | 3.40 |
| October | 696 | 3.73 |
| November | 698 | 3.78 |
| December | 702 | 4.22 |
| 2017 | ||
| January | 707 | 4.47 |
| February | 710 | 4.68 |
| March | 716 | 5.00 |
| April | 719 | 4.91 |
| May | 722 | 4.97 |
| June | 725 | 5.09 |
| July | 729 | 5.35 |
| August | 730 | 5.52 |
| September | 732 | 5.63 |
| October | 734 | 5.44 |
| November | 736 | 5.38 |
| December | 738 | 5.07 |
| 2018 | ||
| January | 740 | 4.77 |
| February | 743 | 4.61 |
| March | 747 | 4.35 |
| April | 751 | 4.47 |
| May | 756 | 4.74 |
| June | 760 | 4.86 |
| July | 764 | 4.79 |
| August | 766 | 4.95 |
| September | 770 | 5.18 |
| October | 772 | 5.15 |
| November | 775 | 5.30 |
| December | 775 | 5.01 |
| 2019 | ||
| January | 774 | 4.58 |
| February | 775 | 4.35 |
| March | 778 | 4.19 |
| April | 784 | 4.31 |
| May | 787 | 4.10 |
| June | 791 | 4.02 |
| July | 793 | 3.77 |
| August | 794 | 3.61 |
| September | 795 | 3.31 |
| October | 796 | 3.20 |
| November | 797 | 2.80 |
| December | 798 | 3.04 |
| 2020 | ||
| January | 799 | 3.22 |
| February | 802 | 3.53 |
| March | 796 | 2.36 |
| April | 785 | 0.15 |
| May | 779 | -1.03 |
| June | 780 | -1.42 |
| July | 780 | -1.65 |
| August | 782 | -1.44 |
| September | 784 | -1.44 |
| October | 784 | -1.49 |
| November | 786 | -1.28 |
| December | 783 | -1.95 |
| 2021 | ||
| January | 782 | -2.15 |
| February | 783 | -2.38 |
| March | 785 | -1.44 |
| April | 789 | 0.59 |
| May | 791 | 1.52 |
|
... not applicable Source: Statistics Canada, Table 36-10-0639-01, Credit liabilities of households. Grey highlights denote recessionary periods. |
||
| 1991-1999 | 2000-2009 | 2010-2019 | 2020 | 2021Q1 | |
|---|---|---|---|---|---|
| annual percent growth (%) | |||||
| Household non-mortgage debt | 6.6 | 9.5 | 3.8 | -1.9 | -1.4 |
| Household mortgage debt | 5.2 | 9.2 | 5.5 | 7.0 | 7.2 |
| Nominal GDP | 3.9 | 4.9 | 3.7 | 0.4 | 5.6 |
| Source: Statistics Canada, Table 36-10-0639-01, Credit liabilities of households. Statistics Canada, Table 36-10-0103-01, Gross domestic product, income-based, quarterly. | |||||
Impact of COVID-19 on household disposable income
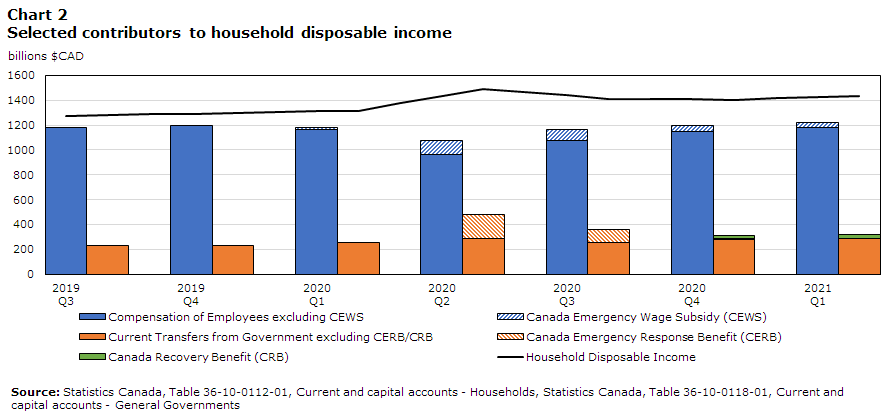
As the effects of the pandemic intensified and the various levels of government issued stay-at-home orders in late March, household labour incomes experienced a significant contraction with many workers facing widespread layoffs, reduced hours, and modified work arrangements. Even as the income support measures were rolled out by all levels of government to help those impacted by COVID-19 restrictions, the aggregate compensation of employees fell 8.5% in the second quarter of 2020.Note 7 A key support for labour income involved the Canada Emergency Wage Subsidy (CEWS) program for which companies could apply and receive funds to keep their staff on payroll so long as they satisfied certain criteria; without this support, compensation of employees may have fallen by a much sharper 17% in the second quarter.Note 8 Despite reduced compensation, the combined effects of the government’s Canadian Emergency Response Benefit (CERB) and subsequent transition to the Canada Recovery Benefit (CRB), helped propel disposable household incomes to record levels. While employee compensation rebounded as restrictions eased into the third and fourth quarters of 2020, it had yet to fully recover to pre-pandemic levels by the end of 2020; however, by the first quarter of 2021 it had regained all lost ground and surpassed the levels from the end of 2019. Government transfers to households remained 25.8% higher than the levels observed in the first quarter of 2020 as the government supports continued to bolster incomes.Note 9
Data table for Chart 2
| Household Disposable Income | Compensation of Employees excluding CEWS | Canada Emergency Wage Subsidy (CEWS) | Current Transfers from Government excluding CERB/CRB | Canada Emergency Response Benefit | Canada Recovery Benefit | |
|---|---|---|---|---|---|---|
| in millions $CAD | ||||||
| 2019Q3 | 1,276,048 | 1,178,132 | 0 | 231,316 | 0 | 0 |
| 2019Q4 | 1,291,528 | 1,193,364 | 0 | 233,248 | 0 | 0 |
| 2020Q1 | 1,309,219 | 1,161,668 | 17,436 | 252,592 | 0 | 0 |
| 2020Q2 | 1,430,896 | 960,932 | 117,404 | 291,052 | 192,876 | 0 |
| 2020Q3 | 1,437,473 | 1,071,548 | 90,844 | 257,220 | 99,344 | 0 |
| 2020Q4 | 1,405,753 | 1,149,232 | 42,812 | 281,352 | 6,272 | 24,292 |
| 2021Q1 | 1,424,236 | 1,183,884 | 33,228 | 288,552 | 0 | 29,120 |
| Source: Statistics Canada, Table 36-10-0112-01, Current and capital accounts - Households, Statistics Canada, Table 36-10-0118-01, Current and capital accounts - General Governments | ||||||
Household expenditures decline in early 2020
As the various levels of government ordered the closure of all non-essential businesses during the first lockdown in early 2020, households were not able to easily access goods and services through traditional brick and mortar retailers and retail sales declined 10.4% from February 2020 to March 2020. While in-store sales plunged in March, e-commerce sales jumped 22.5% on a seasonally adjusted basis, as consumers moved online. The decline in overall retail sales continued into April with overall sales down another 24.9%.Note 10 Note 11
The other side of the retail equation, household consumption expenditure (seasonally adjusted) recorded a sharp decrease with the second quarter of 2020 declining 14.6% from the previous quarter, and down 14.7% from the year prior.Note 12 This marked both the largest monthly and year-over-year declines since this time series began in 1961. While spending rebounded slightly throughout the summer as restrictions eased, household expenditure remained suppressed for the remainder of the year. Despite an improving labour market, continued assistance from all levels of government, and generally improved business conditions, net household expenditure ended the first quarter of 2021 2.6% below pre-pandemic highs. Among the hardest hit industries were those related to travel, as well as other service-oriented industries with direct client interaction such as cinemas, bars, and restaurants. Although expenditures declined, with the majority of consumers spending more time at home, specific industries saw large increases, including outdoor furniture, used cars, and major appliances.

Data table for Chart 3
| Estimates | Household final consumption expenditure |
|---|---|
| percent | |
| 1991 | |
| Q1 | 1.9 |
| Q2 | 4.7 |
| Q3 | 4.1 |
| Q4 | 3.2 |
| 1992 | |
| Q1 | 3.8 |
| Q2 | 2.2 |
| Q3 | 2.8 |
| Q4 | 3.5 |
| 1993 | |
| Q1 | 3.8 |
| Q2 | 4.0 |
| Q3 | 3.7 |
| Q4 | 4.1 |
| 1994 | |
| Q1 | 4.5 |
| Q2 | 3.9 |
| Q3 | 3.8 |
| Q4 | 4.2 |
| 1995 | |
| Q1 | 3.1 |
| Q2 | 4.0 |
| Q3 | 4.3 |
| Q4 | 2.9 |
| 1996 | |
| Q1 | 4.4 |
| Q2 | 4.1 |
| Q3 | 3.7 |
| Q4 | 5.7 |
| 1997 | |
| Q1 | 6.0 |
| Q2 | 6.2 |
| Q3 | 7.0 |
| Q4 | 6.0 |
| 1998 | |
| Q1 | 4.3 |
| Q2 | 4.5 |
| Q3 | 4.0 |
| Q4 | 3.3 |
| 1999 | |
| Q1 | 4.8 |
| Q2 | 4.8 |
| Q3 | 5.7 |
| Q4 | 6.7 |
| 2000 | |
| Q1 | 6.5 |
| Q2 | 6.4 |
| Q3 | 6.7 |
| Q4 | 6.0 |
| 2001 | |
| Q1 | 5.4 |
| Q2 | 5.3 |
| Q3 | 3.5 |
| Q4 | 3.7 |
| 2002 | |
| Q1 | 4.7 |
| Q2 | 5.5 |
| Q3 | 6.5 |
| Q4 | 7.0 |
| 2003 | |
| Q1 | 6.0 |
| Q2 | 4.5 |
| Q3 | 4.6 |
| Q4 | 3.1 |
| 2004 | |
| Q1 | 4.1 |
| Q2 | 4.7 |
| Q3 | 4.4 |
| Q4 | 5.4 |
| 2005 | |
| Q1 | 5.4 |
| Q2 | 5.5 |
| Q3 | 5.6 |
| Q4 | 5.6 |
| 2006 | |
| Q1 | 5.5 |
| Q2 | 5.4 |
| Q3 | 5.5 |
| Q4 | 5.4 |
| 2007 | |
| Q1 | 5.4 |
| Q2 | 6.1 |
| Q3 | 5.9 |
| Q4 | 7.0 |
| 2008 | |
| Q1 | 6.3 |
| Q2 | 5.2 |
| Q3 | 4.9 |
| Q4 | 1.0 |
| 2009 | |
| Q1 | -0.8 |
| Q2 | -0.8 |
| Q3 | -0.2 |
| Q4 | 3.3 |
| 2010 | |
| Q1 | 5.2 |
| Q2 | 5.2 |
| Q3 | 5.0 |
| Q4 | 5.0 |
| 2011 | |
| Q1 | 4.5 |
| Q2 | 4.8 |
| Q3 | 4.3 |
| Q4 | 3.9 |
| 2012 | |
| Q1 | 3.9 |
| Q2 | 3.1 |
| Q3 | 3.1 |
| Q4 | 2.7 |
| 2013 | |
| Q1 | 3.2 |
| Q2 | 4.0 |
| Q3 | 4.4 |
| Q4 | 4.5 |
| 2014 | |
| Q1 | 4.4 |
| Q2 | 4.8 |
| Q3 | 4.6 |
| Q4 | 4.8 |
| 2015 | |
| Q1 | 3.7 |
| Q2 | 3.0 |
| Q3 | 3.3 |
| Q4 | 3.2 |
| 2016 | |
| Q1 | 3.2 |
| Q2 | 2.9 |
| Q3 | 2.4 |
| Q4 | 2.7 |
| 2017 | |
| Q1 | 4.1 |
| Q2 | 5.0 |
| Q3 | 5.0 |
| Q4 | 5.1 |
| 2018 | |
| Q1 | 4.7 |
| Q2 | 4.2 |
| Q3 | 4.4 |
| Q4 | 3.3 |
| 2019 | |
| Q1 | 3.1 |
| Q2 | 3.2 |
| Q3 | 2.9 |
| Q4 | 3.6 |
| 2020 | |
| Q1 | 0.8 |
| Q2 | -14.7 |
| Q3 | -3.4 |
| Q4 | -3.6 |
| 2021 | |
| Q1 | -0.8 |
| Source: Statistics Canada, Table 36-10-0124-01, Detailed household final consumption expenditure. | |

Data table for Chart 4
| Industry | Percent Change |
|---|---|
| Major tools and equipment | 55.0 |
| Major household appliances | 46.7 |
| Food | 14.3 |
| New trucks, vans and SUVs | 12.8 |
| Stock and bond commissions | 11.4 |
| Gas | 6.2 |
| Used motor vehicles | 4.7 |
| Electricity | 2.5 |
| New passenger cars | -9.3 |
| Fuels and lubricants | -19.4 |
| Clothing and footwear | -20.6 |
| Garments | -22.3 |
| Child care outside the home | -36.3 |
| Alcoholic beverage services | -54.2 |
| Urban transit | -64.2 |
| Air transport | -91.0 |
| Cinemas | -96.9 |
| Source: Statistics Canada, Table 36-10-0124-01, Detailed household final consumption expenditure. | |
Strong households’ savings and reduced reliance on non-mortgage financing
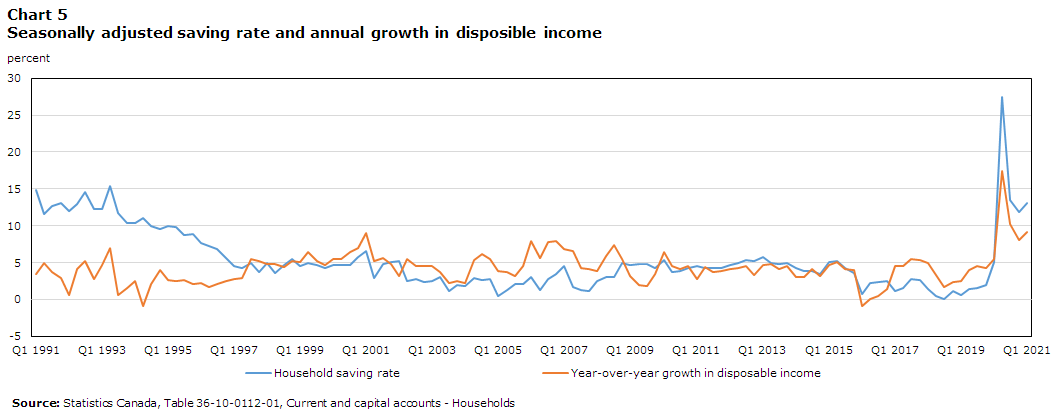
With disposable incomes surging and softening household expenditures, overall household sector savings–the proportion of disposable income available to increase net worth–experienced significant growth through 2020, reaching the highest rate since this series’ inception in 1961.Note 13 Both disposable incomes and the savings rate remained elevated for the remainder of 2020 and into 2021, as continued support from all levels of government, directly through transfers and indirectly through business subsidies, continued to buttress household incomes. Over the course of the year and into the first quarter of 2021, households recorded four consecutive quarters of double-digit savings rates and nearly the same level of overall annual savings in 2020 as the previous seven years combined.
Data table for Chart 5
| Estimates | Household saving rate | Year-over-year growth in disposable income |
|---|---|---|
| percent | ||
| 1991 | ||
| Q1 | 14.8 | 3.5 |
| Q2 | 11.6 | 4.9 |
| Q3 | 12.7 | 3.8 |
| Q4 | 13.1 | 2.9 |
| 1992 | ||
| Q1 | 12.0 | 0.6 |
| Q2 | 13.0 | 4.1 |
| Q3 | 14.6 | 5.3 |
| Q4 | 12.2 | 2.7 |
| 1993 | ||
| Q1 | 12.3 | 4.6 |
| Q2 | 15.4 | 6.9 |
| Q3 | 11.7 | 0.5 |
| Q4 | 10.4 | 1.5 |
| 1994 | ||
| Q1 | 10.3 | 2.4 |
| Q2 | 11.0 | -0.9 |
| Q3 | 10.0 | 2.1 |
| Q4 | 9.6 | 4.0 |
| 1995 | ||
| Q1 | 10.0 | 2.6 |
| Q2 | 9.8 | 2.5 |
| Q3 | 8.7 | 2.6 |
| Q4 | 8.9 | 2.1 |
| 1996 | ||
| Q1 | 7.6 | 2.2 |
| Q2 | 7.2 | 1.7 |
| Q3 | 6.9 | 2.0 |
| Q4 | 5.6 | 2.5 |
| 1997 | ||
| Q1 | 4.5 | 2.8 |
| Q2 | 4.3 | 2.9 |
| Q3 | 4.9 | 5.5 |
| Q4 | 3.7 | 5.2 |
| 1998 | ||
| Q1 | 4.9 | 4.8 |
| Q2 | 3.6 | 4.8 |
| Q3 | 4.6 | 4.4 |
| Q4 | 5.5 | 5.2 |
| 1999 | ||
| Q1 | 4.5 | 5.1 |
| Q2 | 5.0 | 6.4 |
| Q3 | 4.6 | 5.2 |
| Q4 | 4.2 | 4.7 |
| 2000 | ||
| Q1 | 4.6 | 5.5 |
| Q2 | 4.6 | 5.5 |
| Q3 | 4.7 | 6.5 |
| Q4 | 5.8 | 7.0 |
| 2001 | ||
| Q1 | 6.5 | 9.0 |
| Q2 | 2.9 | 5.2 |
| Q3 | 4.8 | 5.6 |
| Q4 | 5.1 | 4.9 |
| 2002 | ||
| Q1 | 5.2 | 3.2 |
| Q2 | 2.5 | 5.5 |
| Q3 | 2.7 | 4.5 |
| Q4 | 2.4 | 4.5 |
| 2003 | ||
| Q1 | 2.5 | 4.5 |
| Q2 | 3.0 | 3.7 |
| Q3 | 1.2 | 2.2 |
| Q4 | 2.0 | 2.5 |
| 2004 | ||
| Q1 | 1.8 | 2.3 |
| Q2 | 2.9 | 5.3 |
| Q3 | 2.6 | 6.2 |
| Q4 | 2.7 | 5.5 |
| 2005 | ||
| Q1 | 0.4 | 3.8 |
| Q2 | 1.3 | 3.6 |
| Q3 | 2.1 | 3.2 |
| Q4 | 2.1 | 4.5 |
| 2006 | ||
| Q1 | 3.1 | 8.0 |
| Q2 | 1.3 | 5.7 |
| Q3 | 2.8 | 7.8 |
| Q4 | 3.5 | 7.9 |
| 2007 | ||
| Q1 | 4.5 | 6.9 |
| Q2 | 1.7 | 6.5 |
| Q3 | 1.3 | 4.3 |
| Q4 | 1.1 | 4.1 |
| 2008 | ||
| Q1 | 2.5 | 3.9 |
| Q2 | 3.0 | 5.9 |
| Q3 | 3.1 | 7.4 |
| Q4 | 5.0 | 5.5 |
| 2009 | ||
| Q1 | 4.6 | 3.1 |
| Q2 | 4.8 | 1.9 |
| Q3 | 4.8 | 1.9 |
| Q4 | 4.3 | 3.5 |
| 2010 | ||
| Q1 | 5.4 | 6.4 |
| Q2 | 3.7 | 4.5 |
| Q3 | 3.8 | 4.2 |
| Q4 | 4.2 | 4.6 |
| 2011 | ||
| Q1 | 4.5 | 2.7 |
| Q2 | 4.3 | 4.4 |
| Q3 | 4.3 | 3.7 |
| Q4 | 4.3 | 3.8 |
| 2012 | ||
| Q1 | 4.7 | 4.1 |
| Q2 | 4.9 | 4.2 |
| Q3 | 5.4 | 4.6 |
| Q4 | 5.2 | 3.4 |
| 2013 | ||
| Q1 | 5.8 | 4.7 |
| Q2 | 5.0 | 4.8 |
| Q3 | 4.8 | 4.1 |
| Q4 | 4.9 | 4.5 |
| 2014 | ||
| Q1 | 4.3 | 3.0 |
| Q2 | 3.9 | 3.0 |
| Q3 | 3.8 | 4.1 |
| Q4 | 3.5 | 3.2 |
| 2015 | ||
| Q1 | 5.1 | 4.7 |
| Q2 | 5.2 | 5.0 |
| Q3 | 4.3 | 4.1 |
| Q4 | 3.6 | 4.0 |
| 2016 | ||
| Q1 | 0.7 | -0.9 |
| Q2 | 2.2 | 0.1 |
| Q3 | 2.4 | 0.4 |
| Q4 | 2.5 | 1.4 |
| 2017 | ||
| Q1 | 1.1 | 4.5 |
| Q2 | 1.5 | 4.5 |
| Q3 | 2.8 | 5.5 |
| Q4 | 2.6 | 5.4 |
| 2018 | ||
| Q1 | 1.4 | 4.9 |
| Q2 | 0.5 | 3.4 |
| Q3 | 0.1 | 1.7 |
| Q4 | 1.2 | 2.3 |
| 2019 | ||
| Q1 | 0.6 | 2.6 |
| Q2 | 1.4 | 4.0 |
| Q3 | 1.6 | 4.5 |
| Q4 | 2.0 | 4.2 |
| 2020 | ||
| Q1 | 5.1 | 5.5 |
| Q2 | 27.4 | 17.4 |
| Q3 | 13.5 | 10.3 |
| Q4 | 11.9 | 8.1 |
| 2021 | ||
| Q1 | 13.1 | 9.1 |
| Source: Statistics Canada, Table 36-10-0112-01, Current and capital accounts - Households | ||
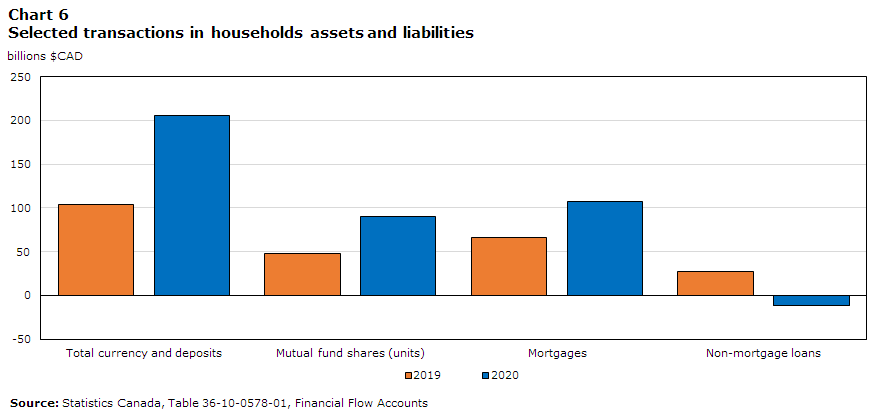
Excess household savings can be used to invest in housing and other structures, which adds to non-financial wealth, or households may purchase financial assets or reduce financial liabilities, which increases their net financial worth. However, households may still purchase consumer goods or invest in housing without sufficient savings by simply obtaining financing in the form of mortgage and non-mortgage loans.
Data table for Chart 6
| Total currency and deposits | Mutual fund shares (units) | Mortgages | Non-mortgage loans | |
|---|---|---|---|---|
| billions $CAD | ||||
| 2019 | 104 | 48 | 66 | 27 |
| 2020 | 206 | 91 | 108 | -12 |
| Source: Statistics Canada, Table 36-10-0578-01, Financial Flow Accounts | ||||
In 2020, investment in new fixed capital assets, primarily newly constructed residential structures, increased 10.8% as an ebullient housing market pushed home prices upward. Households also added significantly to their net financial worth as their transactions in financial assets exceeded those in liabilities (i.e., borrowing) for the first time in decades. While households added over $205.6 billion to their currency and depositsNote 14 during 2020, nearly double the increase of the previous year, they also increased their investment in mutual funds. Robust savings also meant less reliance by households on credit as they recorded a net reduction in non-mortgage loan balances in 2020, which remained into the first quarter of 2021.Note 15

Data table for Chart 7
| Cumulative credit card growth | Cumulative growth in personal deposits | |
|---|---|---|
| index Jan 2018=1 | ||
| 2018 | ||
| January | 1.000 | 1.000000 |
| February | 0.997 | 0.989550862 |
| March | 1.001 | 0.98756937 |
| April | 1.009 | 1.002907586 |
| May | 1.022 | 1.003298992 |
| June | 1.025 | 1.006674868 |
| July | 1.029 | 1.010655325 |
| August | 1.028 | 1.007807149 |
| September | 1.034 | 1.014010232 |
| October | 1.037 | 1.005808183 |
| November | 1.034 | 1.009547507 |
| December | 1.026 | 1.030767295 |
| 2019 | ||
| January | 1.011 | 1.025434391 |
| February | 1.024 | 1.017421055 |
| March | 1.029 | 1.016379636 |
| April | 1.056 | 1.033059815 |
| May | 1.069 | 1.036767687 |
| June | 1.067 | 1.044078589 |
| July | 1.071 | 1.043872402 |
| August | 1.067 | 1.050701036 |
| September | 1.073 | 1.058913569 |
| October | 1.074 | 1.060884577 |
| November | 1.062 | 1.071616786 |
| December | 1.062 | 1.09185107 |
| 2020 | ||
| January | 1.090 | 1.087625984 |
| February | 1.113 | 1.085875142 |
| March | 1.050 | 1.103754001 |
| April | 0.974 | 1.187853838 |
| May | 0.968 | 1.241207347 |
| June | 0.972 | 1.266753568 |
| July | 0.969 | 1.282514643 |
| August | 0.973 | 1.306984498 |
| September | 0.963 | 1.324824916 |
| October | 0.957 | 1.422061311 |
| November | 0.971 | 1.429781092 |
| December | 0.936 | 1.479318395 |
| 2021 | ||
| January | 0.909 | 1.492542321 |
| February | 0.921 | 1.499566658 |
| March | 0.931 | 1.505769742 |
| April | 0.936 | 1.55701595 |
| May | 0.938 | 1.580937137 |
| Source: Statistics Canada, Table 36-10-0639-01, Credit liabilities of households, Bank of Canada, Chartered bank selected liabilties: month-end (formerly C2). | ||
New non-mortgage borrowing drops then hits record as servicing costs decline
With interest rates remaining at record lows throughout 2020, interest expenses on existing non-mortgage debt fell along with obligated payments of principal. Those borrowers with variable rate products or those able to refinance or consolidate their debt at lower rates were able to reduce their interest costs and potentially direct a larger share of their overall debt servicing to reducing their outstanding principal. Additionally, reduced consumption owing to pandemic related restrictions and other reasons for delaying purchases resulted in a reduced pace of new borrowing. While more recent provincial responses to COVID-19 have been mixed, generally easing restrictions into 2021 brought strong new non-mortgage borrowing, with April borrowing setting a record looking back as far as 2010 when this data began collection. With March and April of 2020 marking the lows of the pandemic for borrowing activity, March and April of 2021 showed exceptionally strong growth in new borrowing on a year-over-year basis.

Data table for Chart 8
| Total individual new lending (left axis) | Month over month growth in individual new lending (right axis) | Year over year growth in individual new lending (right axis) | |
|---|---|---|---|
| billions $CAD | percent | ||
| 2018 | |||
| January | 20 | -4 | 7.4 |
| February | 19 | -1 | 4.2 |
| March | 19 | 0 | 2.2 |
| April | 19 | -2 | -1.2 |
| May | 19 | 0 | -3.3 |
| June | 19 | 1 | -5.2 |
| July | 19 | -1 | -4.8 |
| August | 19 | -1 | -2.4 |
| September | 19 | -1 | -0.9 |
| October | 19 | 0 | -2.0 |
| November | 18 | -1 | -4.6 |
| December | 18 | -1 | -9.3 |
| 2019 | |||
| January | 18 | -2 | -8.1 |
| February | 18 | 1 | -6.2 |
| March | 18 | -1 | -6.9 |
| April | 18 | 2 | -3.1 |
| May | 18 | 0 | -3.1 |
| June | 18 | 0 | -3.7 |
| July | 19 | 1 | -2.0 |
| August | 19 | 3 | 1.7 |
| September | 19 | -2 | 0.9 |
| October | 19 | 1 | 1.6 |
| November | 19 | 1 | 2.9 |
| December | 19 | 1 | 4.8 |
| 2020 | |||
| January | 19 | 1 | 7.6 |
| February | 20 | 1 | 7.2 |
| March | 21 | 8 | 16.9 |
| April | 14 | -34 | -24.7 |
| May | 14 | 1 | -23.6 |
| June | 15 | 9 | -17.4 |
| July | 17 | 12 | -8.3 |
| August | 18 | 9 | -3.3 |
| September | 20 | 9 | 7.7 |
| October | 21 | 4 | 11.2 |
| November | 21 | 1 | 12.0 |
| December | 22 | 2 | 12.7 |
| 2021 | |||
| January | 22 | 3 | 14.9 |
| February | 22 | -1 | 13.1 |
| March | 23 | 5 | 10.6 |
| April | 23 | -3 | 63.1 |
| May | 22 | -3 | 57.0 |
| Source: Bank of Canada, Report on new and existing lending (A4). | |||
Payment deferrals also had an impact on debt servicing in 2020, although to a lesser extent for non-mortgage borrowing than mortgage. Overall, the bulk of deferrals occurred in the second quarter and resulted in lower payments of obligated principal than without the deferrals. By the fourth quarter, these deferrals had largely ended with most debtors resuming their payment schedules.

Data table for Chart 9
| Obligated non-mortgage principal payments (left axis) | Deferred non-mortgage principal payments (left axis) | Non-mortgage interest paid (left axis) | Non-mortgage debt service ratio (right axis) | |
|---|---|---|---|---|
| in millions $CAD | ||||
| 2019Q1 | 15,514 | 0 | 12,078 | 8.19 |
| 2019Q2 | 15,962 | 0 | 12,152 | 8.20 |
| 2019Q3 | 16,113 | 0 | 12,304 | 8.21 |
| 1209Q4 | 16,373 | 0 | 12,244 | 8.18 |
| 2020Q1 | 15,946 | 219 | 12,126 | 7.92 |
| 2020Q2 | 14,366 | 1,272 | 10,980 | 6.90 |
| 2020Q3 | 15,125 | 614 | 10,565 | 6.68 |
| 2020Q4 | 15,658 | 0 | 10,529 | 6.94 |
| 2021Q1 | 15,898 | 0 | 10,384 | 6.92 |
| Source: Statistics Canada, Table 11-10-0065-01, Debt service indicators of households | ||||
Chartered banks supply majority of non-mortgage loans, unchanged by pandemic
As household non-mortgage debt steadily grew over the last 30 years, continued industry consolidation increased the market share of major banks relative to other lending sectors, leading to a growing share of financing originating from chartered banks. As home valuations steadily rose, the rise in popularity of Home Equity Lines Of Credit (HELOCs) through the mid-2000s further exacerbated the divide, as banks were able to tap into a much larger share of Canadian household mortgages against which borrowers could unlock additional funds. Perhaps emboldened by the strength of the Canadian housing market over the last decade and steadily declining interest rates, HELOCs grew to become the product of choice for household non-mortgage borrowing. Despite changes in borrowing preferences that have resulted from the pandemic, the market share between banks and non-banks continues to remain relatively unchanged since 2011, with chartered banks holding 74% of non-mortgage debt.

Data table for Chart 10
| Chartered banks | Government | Credit unions and caisse populaires | Other non-bank lenders | |
|---|---|---|---|---|
| billions $CAD | ||||
| 1990 | ||||
| January | 78 | 0 | 16 | 27 |
| February | 78 | 0 | 16 | 27 |
| March | 79 | 0 | 16 | 27 |
| April | 79 | 0 | 16 | 28 |
| May | 79 | 0 | 16 | 28 |
| June | 79 | 0 | 16 | 28 |
| July | 80 | 0 | 16 | 28 |
| August | 81 | 0 | 16 | 28 |
| September | 81 | 0 | 16 | 27 |
| October | 82 | 0 | 16 | 27 |
| November | 82 | 0 | 16 | 27 |
| December | 82 | 0 | 16 | 28 |
| 1991 | ||||
| January | 82 | 0 | 17 | 28 |
| February | 82 | 0 | 17 | 28 |
| March | 81 | 0 | 17 | 28 |
| April | 82 | 0 | 17 | 28 |
| May | 83 | 0 | 17 | 28 |
| June | 83 | 0 | 17 | 28 |
| July | 83 | 0 | 17 | 28 |
| August | 83 | 0 | 17 | 28 |
| September | 82 | 0 | 17 | 29 |
| October | 82 | 0 | 18 | 29 |
| November | 82 | 0 | 18 | 29 |
| December | 82 | 0 | 18 | 29 |
| 1992 | ||||
| January | 82 | 0 | 18 | 29 |
| February | 82 | 0 | 18 | 29 |
| March | 81 | 0 | 18 | 29 |
| April | 81 | 0 | 18 | 29 |
| May | 81 | 0 | 18 | 29 |
| June | 81 | 0 | 18 | 29 |
| July | 82 | 0 | 18 | 29 |
| August | 82 | 0 | 18 | 29 |
| September | 82 | 0 | 18 | 29 |
| October | 82 | 0 | 18 | 29 |
| November | 81 | 0 | 18 | 29 |
| December | 82 | 0 | 18 | 29 |
| 1993 | ||||
| January | 82 | 0 | 19 | 28 |
| February | 83 | 0 | 18 | 28 |
| March | 83 | 0 | 19 | 29 |
| April | 83 | 0 | 19 | 29 |
| May | 83 | 0 | 19 | 29 |
| June | 84 | 0 | 19 | 29 |
| July | 84 | 0 | 19 | 29 |
| August | 85 | 0 | 19 | 29 |
| September | 86 | 0 | 19 | 28 |
| October | 86 | 0 | 19 | 28 |
| November | 87 | 0 | 19 | 28 |
| December | 87 | 0 | 19 | 28 |
| 1994 | ||||
| January | 87 | 0 | 19 | 28 |
| February | 88 | 0 | 19 | 28 |
| March | 88 | 0 | 19 | 29 |
| April | 88 | 0 | 20 | 29 |
| May | 88 | 0 | 20 | 29 |
| June | 88 | 0 | 20 | 29 |
| July | 89 | 0 | 20 | 29 |
| August | 90 | 0 | 19 | 29 |
| September | 90 | 0 | 20 | 29 |
| October | 91 | 0 | 20 | 29 |
| November | 92 | 0 | 20 | 29 |
| December | 93 | 0 | 20 | 30 |
| 1995 | ||||
| January | 93 | 0 | 20 | 30 |
| February | 94 | 0 | 20 | 30 |
| March | 94 | 0 | 20 | 30 |
| April | 94 | 0 | 20 | 30 |
| May | 95 | 0 | 21 | 30 |
| June | 95 | 0 | 21 | 30 |
| July | 96 | 0 | 21 | 30 |
| August | 96 | 0 | 21 | 31 |
| September | 97 | 0 | 21 | 31 |
| October | 98 | 0 | 21 | 31 |
| November | 99 | 0 | 21 | 31 |
| December | 99 | 0 | 21 | 31 |
| 1996 | ||||
| January | 99 | 0 | 21 | 32 |
| February | 100 | 0 | 22 | 33 |
| March | 100 | 0 | 22 | 33 |
| April | 101 | 0 | 22 | 34 |
| May | 101 | 0 | 22 | 34 |
| June | 102 | 0 | 22 | 35 |
| July | 102 | 0 | 22 | 35 |
| August | 102 | 0 | 23 | 36 |
| September | 102 | 0 | 23 | 36 |
| October | 103 | 0 | 23 | 37 |
| November | 103 | 0 | 23 | 37 |
| December | 103 | 0 | 23 | 37 |
| 1997 | ||||
| January | 104 | 0 | 23 | 38 |
| February | 105 | 0 | 23 | 39 |
| March | 107 | 0 | 23 | 40 |
| April | 108 | 0 | 23 | 40 |
| May | 108 | 0 | 23 | 41 |
| June | 108 | 0 | 23 | 41 |
| July | 109 | 0 | 23 | 42 |
| August | 110 | 0 | 23 | 44 |
| September | 112 | 0 | 23 | 44 |
| October | 110 | 0 | 23 | 47 |
| November | 111 | 0 | 23 | 48 |
| December | 112 | 0 | 24 | 49 |
| 1998 | ||||
| January | 113 | 0 | 24 | 49 |
| February | 114 | 0 | 24 | 50 |
| March | 115 | 0 | 24 | 51 |
| April | 115 | 0 | 24 | 54 |
| May | 114 | 0 | 24 | 56 |
| June | 114 | 0 | 24 | 57 |
| July | 115 | 0 | 24 | 58 |
| August | 114 | 0 | 24 | 60 |
| September | 114 | 0 | 24 | 61 |
| October | 114 | 0 | 24 | 62 |
| November | 114 | 0 | 24 | 63 |
| December | 115 | 0 | 24 | 64 |
| 1999 | ||||
| January | 115 | 0 | 24 | 64 |
| February | 116 | 0 | 25 | 65 |
| March | 116 | 0 | 25 | 67 |
| April | 117 | 0 | 25 | 67 |
| May | 118 | 0 | 25 | 67 |
| June | 119 | 0 | 25 | 68 |
| July | 119 | 0 | 25 | 69 |
| August | 119 | 0 | 25 | 69 |
| September | 119 | 0 | 25 | 71 |
| October | 119 | 0 | 25 | 73 |
| November | 121 | 0 | 25 | 74 |
| December | 122 | 0 | 25 | 75 |
| 2000 | ||||
| January | 123 | 0 | 25 | 70 |
| February | 138 | 0 | 26 | 70 |
| March | 134 | 0 | 26 | 70 |
| April | 134 | 0 | 26 | 71 |
| May | 135 | 0 | 26 | 71 |
| June | 136 | 0 | 26 | 71 |
| July | 137 | 0 | 27 | 72 |
| August | 139 | 0 | 27 | 73 |
| September | 141 | 0 | 26 | 73 |
| October | 143 | 1 | 27 | 72 |
| November | 144 | 1 | 27 | 73 |
| December | 144 | 1 | 27 | 73 |
| 2001 | ||||
| January | 145 | 2 | 27 | 74 |
| February | 145 | 2 | 28 | 74 |
| March | 144 | 2 | 28 | 74 |
| April | 144 | 2 | 28 | 75 |
| May | 144 | 2 | 28 | 76 |
| June | 145 | 2 | 28 | 77 |
| July | 145 | 2 | 29 | 77 |
| August | 146 | 3 | 29 | 77 |
| September | 147 | 3 | 30 | 77 |
| October | 147 | 3 | 30 | 77 |
| November | 148 | 3 | 30 | 78 |
| December | 148 | 3 | 31 | 78 |
| 2002 | ||||
| January | 150 | 3 | 31 | 78 |
| February | 152 | 3 | 31 | 78 |
| March | 153 | 3 | 31 | 78 |
| April | 154 | 3 | 32 | 78 |
| May | 155 | 3 | 32 | 79 |
| June | 156 | 3 | 32 | 79 |
| July | 156 | 3 | 32 | 80 |
| August | 158 | 4 | 33 | 80 |
| September | 160 | 4 | 33 | 81 |
| October | 161 | 4 | 33 | 81 |
| November | 162 | 4 | 33 | 81 |
| December | 163 | 4 | 34 | 81 |
| 2003 | ||||
| January | 165 | 4 | 34 | 80 |
| February | 167 | 4 | 34 | 79 |
| March | 169 | 4 | 34 | 78 |
| April | 171 | 5 | 35 | 79 |
| May | 172 | 5 | 35 | 79 |
| June | 173 | 5 | 35 | 80 |
| July | 176 | 5 | 35 | 81 |
| August | 175 | 6 | 35 | 82 |
| September | 176 | 6 | 36 | 83 |
| October | 178 | 6 | 36 | 83 |
| November | 179 | 6 | 36 | 84 |
| December | 182 | 6 | 36 | 84 |
| 2004 | ||||
| January | 183 | 7 | 36 | 85 |
| February | 184 | 7 | 36 | 85 |
| March | 186 | 7 | 37 | 86 |
| April | 189 | 7 | 37 | 86 |
| May | 191 | 7 | 37 | 87 |
| June | 194 | 8 | 37 | 87 |
| July | 197 | 8 | 38 | 87 |
| August | 199 | 8 | 38 | 87 |
| September | 200 | 8 | 38 | 87 |
| October | 203 | 8 | 38 | 88 |
| November | 207 | 8 | 38 | 88 |
| December | 210 | 8 | 39 | 88 |
| 2005 | ||||
| January | 212 | 9 | 39 | 91 |
| February | 214 | 9 | 39 | 94 |
| March | 216 | 9 | 39 | 97 |
| April | 217 | 9 | 39 | 98 |
| May | 217 | 9 | 39 | 100 |
| June | 219 | 9 | 39 | 101 |
| July | 220 | 9 | 39 | 102 |
| August | 222 | 10 | 40 | 102 |
| September | 224 | 10 | 40 | 103 |
| October | 225 | 10 | 40 | 104 |
| November | 227 | 10 | 40 | 105 |
| December | 228 | 10 | 40 | 106 |
| 2006 | ||||
| January | 230 | 11 | 40 | 107 |
| February | 231 | 11 | 41 | 108 |
| March | 234 | 11 | 41 | 109 |
| April | 236 | 11 | 41 | 110 |
| May | 239 | 11 | 41 | 110 |
| June | 241 | 11 | 41 | 110 |
| July | 243 | 12 | 42 | 112 |
| August | 245 | 12 | 42 | 113 |
| September | 248 | 12 | 42 | 115 |
| October | 247 | 12 | 43 | 117 |
| November | 248 | 12 | 43 | 120 |
| December | 250 | 12 | 43 | 122 |
| 2007 | ||||
| January | 252 | 12 | 43 | 123 |
| February | 254 | 12 | 43 | 124 |
| March | 257 | 12 | 43 | 126 |
| April | 259 | 13 | 44 | 127 |
| May | 262 | 13 | 44 | 128 |
| June | 265 | 13 | 45 | 129 |
| July | 268 | 13 | 45 | 130 |
| August | 270 | 13 | 45 | 131 |
| September | 272 | 13 | 45 | 131 |
| October | 276 | 13 | 46 | 130 |
| November | 280 | 13 | 46 | 130 |
| December | 283 | 13 | 46 | 129 |
| 2008 | ||||
| January | 286 | 13 | 46 | 129 |
| February | 288 | 13 | 46 | 130 |
| March | 292 | 14 | 46 | 130 |
| April | 295 | 14 | 47 | 130 |
| May | 298 | 14 | 47 | 130 |
| June | 301 | 14 | 47 | 130 |
| July | 305 | 14 | 47 | 130 |
| August | 308 | 14 | 48 | 129 |
| September | 311 | 15 | 48 | 128 |
| October | 315 | 15 | 48 | 127 |
| November | 315 | 15 | 49 | 126 |
| December | 320 | 15 | 49 | 125 |
| 2009 | ||||
| January | 324 | 15 | 49 | 123 |
| February | 329 | 15 | 50 | 122 |
| March | 333 | 15 | 50 | 120 |
| April | 337 | 15 | 50 | 119 |
| May | 342 | 15 | 50 | 118 |
| June | 348 | 15 | 51 | 116 |
| July | 351 | 15 | 51 | 115 |
| August | 355 | 15 | 51 | 114 |
| September | 359 | 16 | 52 | 113 |
| October | 365 | 16 | 52 | 112 |
| November | 369 | 16 | 52 | 111 |
| December | 373 | 16 | 52 | 110 |
| 2010 | ||||
| January | 376 | 16 | 52 | 108 |
| February | 379 | 16 | 52 | 107 |
| March | 381 | 16 | 53 | 106 |
| April | 383 | 16 | 52 | 105 |
| May | 385 | 16 | 52 | 104 |
| June | 385 | 16 | 52 | 103 |
| July | 387 | 16 | 52 | 102 |
| August | 390 | 17 | 53 | 102 |
| September | 392 | 17 | 53 | 101 |
| October | 395 | 17 | 53 | 100 |
| November | 398 | 17 | 53 | 100 |
| December | 399 | 17 | 53 | 100 |
| 2011 | ||||
| January | 409 | 17 | 54 | 98 |
| February | 410 | 17 | 54 | 96 |
| March | 411 | 17 | 54 | 94 |
| April | 414 | 18 | 54 | 94 |
| May | 414 | 18 | 54 | 94 |
| June | 416 | 18 | 54 | 94 |
| July | 418 | 18 | 54 | 93 |
| August | 419 | 18 | 55 | 93 |
| September | 420 | 18 | 54 | 93 |
| October | 420 | 18 | 55 | 91 |
| November | 444 | 18 | 56 | 72 |
| December | 445 | 18 | 56 | 72 |
| 2012 | ||||
| January | 445 | 18 | 56 | 72 |
| February | 445 | 18 | 57 | 72 |
| March | 446 | 18 | 57 | 71 |
| April | 446 | 19 | 57 | 72 |
| May | 448 | 19 | 57 | 72 |
| June | 449 | 19 | 57 | 72 |
| July | 450 | 19 | 58 | 71 |
| August | 454 | 19 | 58 | 71 |
| September | 455 | 19 | 58 | 71 |
| October | 456 | 20 | 58 | 71 |
| November | 456 | 20 | 58 | 71 |
| December | 457 | 20 | 58 | 71 |
| 2013 | ||||
| January | 457 | 20 | 59 | 70 |
| February | 463 | 21 | 59 | 70 |
| March | 464 | 21 | 59 | 69 |
| April | 464 | 21 | 59 | 70 |
| May | 465 | 21 | 59 | 70 |
| June | 466 | 21 | 59 | 70 |
| July | 467 | 22 | 60 | 71 |
| August | 467 | 22 | 60 | 72 |
| September | 468 | 22 | 60 | 72 |
| October | 468 | 22 | 60 | 73 |
| November | 468 | 23 | 60 | 73 |
| December | 470 | 23 | 61 | 74 |
| 2014 | ||||
| January | 471 | 23 | 61 | 74 |
| February | 472 | 23 | 61 | 75 |
| March | 472 | 23 | 61 | 75 |
| April | 472 | 23 | 62 | 76 |
| May | 473 | 23 | 62 | 76 |
| June | 475 | 24 | 63 | 76 |
| July | 476 | 24 | 63 | 77 |
| August | 477 | 24 | 63 | 77 |
| September | 479 | 24 | 63 | 78 |
| October | 480 | 24 | 63 | 79 |
| November | 480 | 24 | 64 | 80 |
| December | 481 | 24 | 64 | 80 |
| 2015 | ||||
| January | 482 | 25 | 64 | 81 |
| February | 484 | 25 | 64 | 81 |
| March | 486 | 25 | 64 | 81 |
| April | 488 | 25 | 64 | 81 |
| May | 490 | 25 | 64 | 82 |
| June | 492 | 26 | 65 | 82 |
| July | 493 | 26 | 65 | 83 |
| August | 494 | 26 | 65 | 83 |
| September | 496 | 26 | 65 | 84 |
| October | 496 | 26 | 65 | 84 |
| November | 498 | 26 | 65 | 84 |
| December | 498 | 26 | 65 | 85 |
| 2016 | ||||
| January | 499 | 26 | 65 | 86 |
| February | 500 | 26 | 65 | 87 |
| March | 502 | 26 | 65 | 89 |
| April | 504 | 26 | 66 | 90 |
| May | 505 | 26 | 66 | 91 |
| June | 506 | 26 | 66 | 92 |
| July | 508 | 26 | 66 | 92 |
| August | 506 | 26 | 67 | 93 |
| September | 507 | 26 | 67 | 93 |
| October | 509 | 27 | 67 | 94 |
| November | 510 | 27 | 67 | 94 |
| December | 513 | 27 | 68 | 95 |
| 2017 | ||||
| January | 515 | 27 | 68 | 97 |
| February | 516 | 27 | 68 | 99 |
| March | 519 | 27 | 68 | 101 |
| April | 521 | 27 | 69 | 101 |
| May | 523 | 28 | 69 | 102 |
| June | 526 | 28 | 69 | 102 |
| July | 529 | 28 | 70 | 103 |
| August | 529 | 28 | 70 | 103 |
| September | 530 | 28 | 70 | 104 |
| October | 531 | 28 | 71 | 103 |
| November | 533 | 28 | 71 | 103 |
| December | 535 | 28 | 71 | 103 |
| 2018 | ||||
| January | 536 | 28 | 72 | 104 |
| February | 538 | 29 | 72 | 104 |
| March | 540 | 29 | 73 | 105 |
| April | 543 | 29 | 74 | 105 |
| May | 547 | 29 | 74 | 106 |
| June | 549 | 29 | 75 | 106 |
| July | 552 | 30 | 76 | 107 |
| August | 554 | 30 | 76 | 107 |
| September | 557 | 30 | 76 | 107 |
| October | 558 | 30 | 76 | 107 |
| November | 560 | 30 | 77 | 108 |
| December | 560 | 30 | 77 | 108 |
| 2019 | ||||
| January | 560 | 30 | 77 | 107 |
| February | 562 | 30 | 76 | 107 |
| March | 565 | 31 | 76 | 106 |
| April | 569 | 31 | 77 | 107 |
| May | 571 | 31 | 78 | 108 |
| June | 574 | 31 | 78 | 108 |
| July | 575 | 31 | 78 | 108 |
| August | 577 | 31 | 78 | 108 |
| September | 578 | 31 | 79 | 108 |
| October | 578 | 31 | 79 | 108 |
| November | 578 | 32 | 79 | 108 |
| December | 579 | 32 | 79 | 109 |
| 2020 | ||||
| January | 583 | 32 | 79 | 106 |
| February | 587 | 32 | 79 | 104 |
| March | 582 | 32 | 80 | 102 |
| April | 572 | 32 | 78 | 102 |
| May | 567 | 33 | 77 | 102 |
| June | 568 | 33 | 77 | 102 |
| July | 569 | 33 | 77 | 102 |
| August | 571 | 33 | 77 | 101 |
| September | 573 | 33 | 77 | 101 |
| October | 574 | 33 | 77 | 100 |
| November | 576 | 33 | 77 | 100 |
| December | 573 | 33 | 77 | 99 |
| 2020 | ||||
| January | 573 | 34 | 76 | 98 |
| February | 576 | 34 | 77 | 97 |
| March | 578 | 34 | 77 | 96 |
| April | 582 | 34 | 77 | 96 |
| May | 584 | 34 | 78 | 95 |
|
Note: IFRS update in 2011 resulted in changes in the accounting of select products Source: Statistics Canada, Table 36-10-0639-01, Credit liabilities of households. |
||||
Data table for Chart 11
| Non-Mortgage Loans | Chartered banks | Government | Credit unions and caisse populaires | Other non-bank lenders | |
|---|---|---|---|---|---|
| milions $CAD | |||||
| 2019 | |||||
| January | -565 | -84 | 139 | -152 | -468 |
| February | 980 | 1,836 | 100 | -327 | -629 |
| March | 2,814 | 3,019 | 206 | 0 | -411 |
| April | 5,561 | 3,757 | 176 | 802 | 826 |
| May | 3,449 | 2,394 | 90 | 409 | 556 |
| June | 3,857 | 2,666 | 113 | 487 | 591 |
| July | 2,083 | 1,826 | 152 | 241 | -136 |
| August | 905 | 1,095 | 109 | 8 | -307 |
| September | 1,307 | 1,208 | 150 | 169 | -220 |
| October | 1,197 | 627 | 109 | 59 | 402 |
| November | 303 | -137 | 163 | 16 | 261 |
| December | 1,627 | 1,042 | 172 | 90 | 323 |
| 2020 | |||||
| January | 870 | 3,243 | 79 | -113 | -2,339 |
| February | 3,357 | 4,790 | 25 | 483 | -1,941 |
| March | -6,118 | -4,852 | 26 | 499 | -1,791 |
| April | -11,634 | -10,414 | 371 | -1,453 | -138 |
| May | -5,846 | -5,281 | 334 | -632 | -267 |
| June | 685 | 1,090 | 339 | -268 | -476 |
| July | 244 | 676 | 29 | -409 | -52 |
| August | 2,590 | 2,565 | 29 | 396 | -400 |
| September | 1,247 | 1,423 | 56 | 183 | -415 |
| October | 785 | 1,335 | 98 | -404 | -244 |
| November | 2,012 | 2,587 | 102 | -280 | -397 |
| December | -3,735 | -3,217 | 130 | -26 | -622 |
| 2021 | |||||
| January | -803 | 236 | 157 | -220 | -976 |
| February | 1,463 | 2,414 | 123 | 144 | -1,218 |
| March | 1,500 | 2,186 | 155 | 238 | -1,079 |
| April | 4,515 | 4,349 | 223 | 232 | -289 |
| May | -562 | 288 | 146 | -128 | -870 |
| Source: Statistics Canada, Table 36-10-0639-01, Credit liabilities of households. | |||||
Households’ reliance on non-mortgage loans varies by product
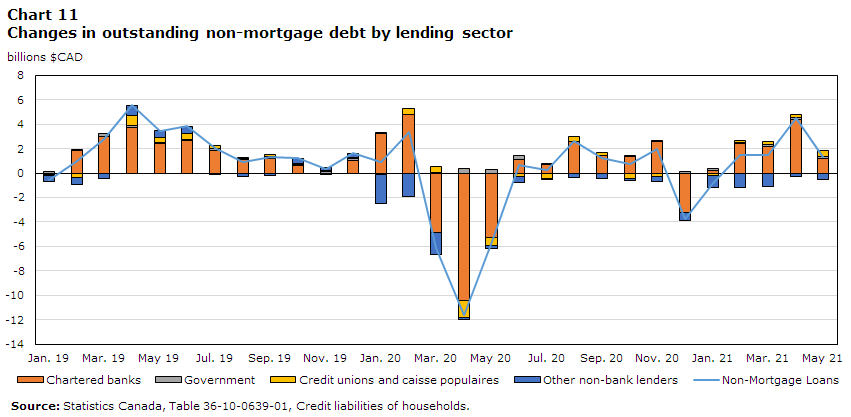
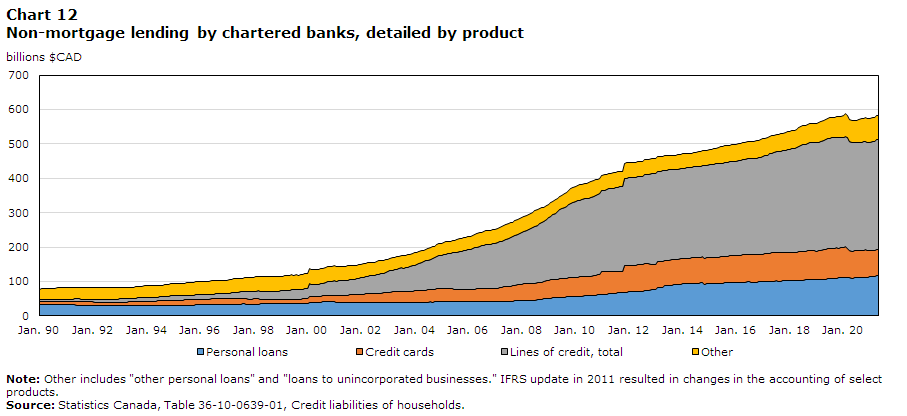
On an aggregate basis, non-mortgage household debt reached a peak of $802 billion in February of 2020, and declined to a low of $779 billion in May of 2020, where it has remained relatively unchanged since, ending March 2021 with a balance of $785 billion. The majority of this debt is with chartered banks, which held 74.0% of all household non-mortgage debt as of March 2021. Within this, more expensive debt such as credit cards and unsecured lines of credit have declined significantly through the pandemic, while other categories such as secured lines of credit and personal loans have continued to grow.
Data table for Chart 12
| Credit liabilities of households | ||||
|---|---|---|---|---|
| Personal loans | Credit cards | Lines of credit, total | Other | |
| billions $CAD | ||||
| 1990 | ||||
| January | 32 | 9 | 6 | 31 |
| February | 32 | 9 | 6 | 32 |
| March | 32 | 9 | 6 | 32 |
| April | 32 | 9 | 6 | 32 |
| May | 32 | 9 | 6 | 32 |
| June | 32 | 9 | 6 | 32 |
| July | 32 | 9 | 6 | 32 |
| August | 33 | 10 | 6 | 32 |
| September | 33 | 10 | 7 | 32 |
| October | 33 | 10 | 7 | 33 |
| November | 33 | 10 | 7 | 33 |
| December | 33 | 10 | 7 | 33 |
| 1991 | ||||
| January | 32 | 10 | 7 | 33 |
| February | 32 | 10 | 7 | 33 |
| March | 32 | 10 | 7 | 32 |
| April | 32 | 10 | 7 | 33 |
| May | 32 | 10 | 7 | 33 |
| June | 32 | 10 | 8 | 34 |
| July | 31 | 10 | 8 | 33 |
| August | 31 | 10 | 8 | 33 |
| September | 31 | 10 | 8 | 33 |
| October | 31 | 10 | 8 | 33 |
| November | 31 | 10 | 8 | 33 |
| December | 31 | 10 | 8 | 33 |
| 1992 | ||||
| January | 30 | 10 | 8 | 33 |
| February | 30 | 10 | 8 | 33 |
| March | 30 | 10 | 8 | 33 |
| April | 30 | 10 | 9 | 33 |
| May | 30 | 10 | 9 | 33 |
| June | 29 | 10 | 9 | 33 |
| July | 29 | 10 | 9 | 33 |
| August | 29 | 10 | 9 | 33 |
| September | 29 | 10 | 9 | 33 |
| October | 29 | 10 | 9 | 33 |
| November | 29 | 11 | 9 | 33 |
| December | 29 | 11 | 9 | 33 |
| 1993 | ||||
| January | 29 | 11 | 9 | 33 |
| February | 29 | 11 | 9 | 33 |
| March | 29 | 11 | 9 | 33 |
| April | 29 | 11 | 10 | 33 |
| May | 29 | 11 | 10 | 33 |
| June | 29 | 11 | 10 | 33 |
| July | 29 | 12 | 10 | 33 |
| August | 29 | 12 | 10 | 34 |
| September | 29 | 12 | 11 | 34 |
| October | 29 | 12 | 11 | 33 |
| November | 29 | 13 | 11 | 34 |
| December | 30 | 13 | 11 | 34 |
| 1994 | ||||
| January | 29 | 13 | 11 | 34 |
| February | 29 | 13 | 11 | 34 |
| March | 30 | 13 | 11 | 34 |
| April | 30 | 13 | 11 | 34 |
| May | 30 | 14 | 11 | 34 |
| June | 30 | 14 | 11 | 33 |
| July | 30 | 14 | 12 | 34 |
| August | 30 | 14 | 12 | 34 |
| September | 30 | 14 | 12 | 34 |
| October | 30 | 14 | 12 | 34 |
| November | 31 | 15 | 12 | 35 |
| December | 31 | 15 | 13 | 35 |
| 1995 | ||||
| January | 31 | 15 | 13 | 35 |
| February | 31 | 15 | 13 | 35 |
| March | 31 | 15 | 13 | 35 |
| April | 31 | 15 | 13 | 35 |
| May | 31 | 15 | 13 | 36 |
| June | 31 | 16 | 13 | 36 |
| July | 31 | 16 | 13 | 36 |
| August | 31 | 16 | 13 | 36 |
| September | 31 | 16 | 13 | 37 |
| October | 32 | 16 | 13 | 37 |
| November | 32 | 16 | 13 | 37 |
| December | 32 | 16 | 13 | 37 |
| 1996 | ||||
| January | 32 | 16 | 13 | 37 |
| February | 32 | 16 | 14 | 37 |
| March | 33 | 16 | 14 | 37 |
| April | 33 | 16 | 14 | 38 |
| May | 33 | 16 | 14 | 38 |
| June | 33 | 16 | 14 | 38 |
| July | 33 | 16 | 14 | 38 |
| August | 33 | 17 | 14 | 38 |
| September | 33 | 17 | 15 | 38 |
| October | 33 | 17 | 15 | 38 |
| November | 33 | 17 | 15 | 38 |
| December | 33 | 17 | 16 | 38 |
| 1997 | ||||
| January | 33 | 17 | 16 | 38 |
| February | 33 | 17 | 16 | 39 |
| March | 34 | 17 | 17 | 39 |
| April | 34 | 17 | 17 | 39 |
| May | 34 | 17 | 17 | 40 |
| June | 34 | 17 | 18 | 39 |
| July | 34 | 17 | 18 | 39 |
| August | 35 | 17 | 19 | 39 |
| September | 35 | 16 | 20 | 40 |
| October | 33 | 16 | 21 | 40 |
| November | 33 | 15 | 21 | 41 |
| December | 34 | 15 | 22 | 41 |
| 1998 | ||||
| January | 34 | 15 | 22 | 42 |
| February | 34 | 15 | 22 | 42 |
| March | 34 | 15 | 23 | 42 |
| April | 35 | 14 | 23 | 42 |
| May | 35 | 12 | 24 | 43 |
| June | 35 | 12 | 24 | 43 |
| July | 35 | 12 | 24 | 43 |
| August | 35 | 11 | 25 | 43 |
| September | 35 | 11 | 25 | 43 |
| October | 36 | 11 | 25 | 43 |
| November | 36 | 11 | 25 | 42 |
| December | 36 | 11 | 25 | 42 |
| 1999 | ||||
| January | 36 | 11 | 26 | 42 |
| February | 36 | 11 | 26 | 43 |
| March | 37 | 11 | 26 | 43 |
| April | 37 | 11 | 27 | 43 |
| May | 37 | 11 | 27 | 43 |
| June | 37 | 11 | 27 | 43 |
| July | 37 | 11 | 27 | 43 |
| August | 37 | 12 | 28 | 43 |
| September | 37 | 12 | 28 | 43 |
| October | 37 | 12 | 28 | 43 |
| November | 37 | 12 | 28 | 43 |
| December | 37 | 13 | 29 | 43 |
| 2000 | ||||
| January | 37 | 13 | 30 | 43 |
| February | 40 | 15 | 38 | 45 |
| March | 40 | 16 | 35 | 44 |
| April | 40 | 16 | 34 | 43 |
| May | 40 | 17 | 34 | 44 |
| June | 40 | 17 | 35 | 44 |
| July | 40 | 18 | 36 | 44 |
| August | 41 | 18 | 37 | 44 |
| September | 41 | 19 | 37 | 44 |
| October | 41 | 19 | 39 | 44 |
| November | 41 | 20 | 39 | 44 |
| December | 41 | 19 | 40 | 44 |
| 2001 | ||||
| January | 41 | 19 | 41 | 43 |
| February | 40 | 20 | 41 | 44 |
| March | 40 | 20 | 42 | 42 |
| April | 40 | 20 | 43 | 42 |
| May | 40 | 21 | 42 | 42 |
| June | 40 | 21 | 43 | 41 |
| July | 40 | 21 | 43 | 42 |
| August | 40 | 22 | 44 | 41 |
| September | 40 | 22 | 44 | 41 |
| October | 40 | 23 | 45 | 40 |
| November | 40 | 23 | 45 | 40 |
| December | 39 | 23 | 46 | 39 |
| 2002 | ||||
| January | 40 | 23 | 48 | 40 |
| February | 40 | 24 | 49 | 39 |
| March | 40 | 24 | 50 | 39 |
| April | 40 | 25 | 51 | 39 |
| May | 39 | 25 | 52 | 39 |
| June | 39 | 25 | 53 | 38 |
| July | 39 | 26 | 53 | 38 |
| August | 39 | 26 | 55 | 38 |
| September | 38 | 27 | 56 | 38 |
| October | 39 | 28 | 57 | 38 |
| November | 39 | 28 | 58 | 37 |
| December | 39 | 29 | 59 | 37 |
| 2003 | ||||
| January | 39 | 29 | 60 | 37 |
| February | 39 | 31 | 61 | 37 |
| March | 39 | 32 | 62 | 36 |
| April | 39 | 32 | 64 | 36 |
| May | 39 | 32 | 65 | 36 |
| June | 39 | 32 | 66 | 36 |
| July | 39 | 33 | 67 | 37 |
| August | 39 | 32 | 68 | 36 |
| September | 39 | 32 | 69 | 36 |
| October | 39 | 32 | 71 | 36 |
| November | 39 | 32 | 72 | 36 |
| December | 39 | 33 | 74 | 36 |
| 2004 | ||||
| January | 39 | 33 | 75 | 35 |
| February | 39 | 33 | 77 | 35 |
| March | 39 | 33 | 79 | 35 |
| April | 39 | 34 | 81 | 35 |
| May | 40 | 34 | 83 | 35 |
| June | 40 | 35 | 85 | 34 |
| July | 40 | 35 | 87 | 34 |
| August | 40 | 36 | 89 | 34 |
| September | 40 | 36 | 90 | 34 |
| October | 41 | 36 | 92 | 34 |
| November | 43 | 36 | 94 | 34 |
| December | 43 | 36 | 96 | 34 |
| 2005 | ||||
| January | 42 | 37 | 97 | 35 |
| February | 43 | 37 | 99 | 36 |
| March | 43 | 37 | 100 | 36 |
| April | 43 | 36 | 101 | 36 |
| May | 43 | 36 | 103 | 36 |
| June | 43 | 36 | 105 | 36 |
| July | 41 | 36 | 107 | 36 |
| August | 41 | 36 | 108 | 36 |
| September | 41 | 36 | 110 | 37 |
| October | 41 | 36 | 112 | 37 |
| November | 41 | 36 | 113 | 37 |
| December | 41 | 36 | 114 | 37 |
| 2006 | ||||
| January | 41 | 36 | 116 | 37 |
| February | 41 | 35 | 117 | 37 |
| March | 41 | 36 | 119 | 38 |
| April | 41 | 36 | 120 | 38 |
| May | 41 | 37 | 122 | 39 |
| June | 41 | 38 | 123 | 40 |
| July | 41 | 38 | 125 | 40 |
| August | 41 | 39 | 126 | 40 |
| September | 41 | 39 | 127 | 40 |
| October | 41 | 39 | 126 | 40 |
| November | 41 | 39 | 128 | 40 |
| December | 41 | 39 | 129 | 41 |
| 2007 | ||||
| January | 41 | 40 | 130 | 41 |
| February | 42 | 39 | 131 | 42 |
| March | 42 | 40 | 133 | 42 |
| April | 42 | 41 | 134 | 42 |
| May | 42 | 42 | 136 | 42 |
| June | 42 | 43 | 138 | 42 |
| July | 43 | 43 | 139 | 42 |
| August | 43 | 43 | 141 | 43 |
| September | 43 | 44 | 143 | 43 |
| October | 43 | 45 | 144 | 43 |
| November | 44 | 47 | 146 | 44 |
| December | 44 | 47 | 148 | 43 |
| 2008 | ||||
| January | 44 | 48 | 150 | 44 |
| February | 45 | 48 | 152 | 43 |
| March | 45 | 49 | 155 | 44 |
| April | 45 | 49 | 158 | 43 |
| May | 45 | 49 | 160 | 44 |
| June | 46 | 49 | 162 | 44 |
| July | 46 | 50 | 165 | 45 |
| August | 47 | 50 | 167 | 44 |
| September | 47 | 51 | 170 | 44 |
| October | 47 | 51 | 172 | 44 |
| November | 50 | 51 | 175 | 40 |
| December | 51 | 52 | 178 | 40 |
| 2009 | ||||
| January | 51 | 52 | 182 | 39 |
| February | 52 | 53 | 186 | 39 |
| March | 52 | 53 | 189 | 39 |
| April | 53 | 53 | 192 | 39 |
| May | 53 | 54 | 196 | 39 |
| June | 54 | 54 | 200 | 39 |
| July | 54 | 54 | 203 | 39 |
| August | 55 | 54 | 207 | 39 |
| September | 55 | 55 | 210 | 39 |
| October | 56 | 55 | 212 | 42 |
| November | 55 | 55 | 215 | 44 |
| December | 56 | 56 | 217 | 44 |
| 2010 | ||||
| January | 56 | 56 | 219 | 44 |
| February | 57 | 56 | 221 | 44 |
| March | 57 | 56 | 223 | 44 |
| April | 58 | 57 | 224 | 44 |
| May | 58 | 57 | 225 | 45 |
| June | 58 | 56 | 226 | 45 |
| July | 59 | 56 | 228 | 45 |
| August | 59 | 56 | 229 | 45 |
| September | 60 | 57 | 231 | 45 |
| October | 60 | 58 | 232 | 45 |
| November | 61 | 59 | 234 | 45 |
| December | 62 | 59 | 234 | 45 |
| 2011 | ||||
| January | 62 | 66 | 235 | 45 |
| February | 63 | 66 | 236 | 45 |
| March | 63 | 66 | 237 | 45 |
| April | 65 | 66 | 239 | 45 |
| May | 65 | 64 | 240 | 45 |
| June | 66 | 64 | 242 | 45 |
| July | 66 | 64 | 243 | 45 |
| August | 67 | 63 | 244 | 45 |
| September | 67 | 63 | 245 | 45 |
| October | 68 | 63 | 246 | 44 |
| November | 68 | 78 | 252 | 45 |
| December | 69 | 78 | 253 | 45 |
| 2012 | ||||
| January | 70 | 78 | 254 | 44 |
| February | 70 | 77 | 254 | 44 |
| March | 71 | 77 | 254 | 44 |
| April | 71 | 77 | 255 | 44 |
| May | 71 | 77 | 256 | 44 |
| June | 71 | 78 | 257 | 44 |
| July | 72 | 77 | 258 | 44 |
| August | 74 | 77 | 259 | 43 |
| September | 74 | 77 | 260 | 43 |
| October | 75 | 77 | 260 | 43 |
| November | 76 | 74 | 263 | 43 |
| December | 76 | 75 | 263 | 43 |
| 2013 | ||||
| January | 76 | 74 | 263 | 43 |
| February | 83 | 74 | 263 | 43 |
| March | 84 | 74 | 263 | 43 |
| April | 84 | 75 | 263 | 43 |
| May | 87 | 72 | 263 | 42 |
| June | 88 | 72 | 263 | 42 |
| July | 89 | 73 | 263 | 42 |
| August | 89 | 73 | 263 | 42 |
| September | 90 | 73 | 263 | 42 |
| October | 91 | 73 | 262 | 42 |
| November | 92 | 73 | 262 | 42 |
| December | 93 | 74 | 262 | 42 |
| 2014 | ||||
| January | 94 | 73 | 262 | 42 |
| February | 94 | 74 | 262 | 42 |
| March | 94 | 74 | 263 | 42 |
| April | 94 | 74 | 263 | 42 |
| May | 95 | 74 | 263 | 41 |
| June | 95 | 75 | 263 | 41 |
| July | 95 | 75 | 264 | 41 |
| August | 95 | 75 | 264 | 42 |
| September | 96 | 75 | 265 | 43 |
| October | 97 | 75 | 265 | 43 |
| November | 93 | 75 | 269 | 43 |
| December | 93 | 75 | 269 | 43 |
| 2015 | ||||
| January | 93 | 76 | 270 | 43 |
| February | 94 | 76 | 270 | 44 |
| March | 94 | 76 | 271 | 44 |
| April | 94 | 76 | 272 | 46 |
| May | 94 | 77 | 272 | 47 |
| June | 95 | 77 | 272 | 49 |
| July | 94 | 77 | 273 | 49 |
| August | 96 | 77 | 273 | 48 |
| September | 97 | 77 | 273 | 48 |
| October | 97 | 78 | 273 | 48 |
| November | 97 | 78 | 274 | 48 |
| December | 98 | 78 | 274 | 49 |
| 2016 | ||||
| January | 98 | 78 | 274 | 49 |
| February | 98 | 78 | 275 | 49 |
| March | 98 | 78 | 275 | 50 |
| April | 99 | 80 | 277 | 50 |
| May | 99 | 79 | 278 | 49 |
| June | 99 | 80 | 279 | 49 |
| July | 99 | 80 | 280 | 50 |
| August | 99 | 79 | 279 | 49 |
| September | 98 | 80 | 279 | 50 |
| October | 99 | 80 | 280 | 50 |
| November | 99 | 80 | 281 | 50 |
| December | 99 | 80 | 283 | 51 |
| 2017 | ||||
| January | 99 | 81 | 284 | 51 |
| February | 100 | 81 | 285 | 51 |
| March | 100 | 81 | 286 | 51 |
| April | 101 | 82 | 288 | 51 |
| May | 101 | 82 | 290 | 50 |
| June | 101 | 82 | 292 | 50 |
| July | 102 | 83 | 294 | 50 |
| August | 101 | 82 | 295 | 50 |
| September | 101 | 83 | 295 | 50 |
| October | 102 | 83 | 296 | 50 |
| November | 102 | 83 | 297 | 52 |
| December | 102 | 82 | 298 | 53 |
| 2018 | ||||
| January | 103 | 81 | 301 | 51 |
| February | 103 | 81 | 301 | 52 |
| March | 103 | 81 | 303 | 53 |
| April | 104 | 82 | 304 | 53 |
| May | 104 | 83 | 305 | 54 |
| June | 104 | 83 | 308 | 55 |
| July | 104 | 84 | 310 | 55 |
| August | 105 | 84 | 311 | 55 |
| September | 105 | 84 | 312 | 55 |
| October | 105 | 84 | 313 | 56 |
| November | 106 | 84 | 315 | 56 |
| December | 106 | 84 | 315 | 55 |
| 2019 | ||||
| January | 106 | 82 | 316 | 56 |
| February | 105 | 83 | 317 | 56 |
| March | 106 | 84 | 317 | 57 |
| April | 107 | 86 | 318 | 58 |
| May | 107 | 87 | 318 | 58 |
| June | 108 | 87 | 320 | 59 |
| July | 108 | 87 | 321 | 59 |
| August | 109 | 87 | 321 | 59 |
| September | 110 | 87 | 321 | 59 |
| October | 110 | 87 | 321 | 59 |
| November | 111 | 86 | 322 | 60 |
| December | 111 | 87 | 322 | 60 |
| 2020 | ||||
| January | 111 | 89 | 318 | 65 |
| February | 112 | 91 | 318 | 67 |
| March | 112 | 85 | 321 | 65 |
| April | 111 | 79 | 318 | 64 |
| May | 110 | 79 | 314 | 64 |
| June | 111 | 79 | 314 | 65 |
| July | 111 | 79 | 313 | 65 |
| August | 112 | 79 | 314 | 66 |
| September | 112 | 78 | 315 | 67 |
| October | 112 | 78 | 316 | 68 |
| November | 113 | 79 | 316 | 68 |
| December | 113 | 76 | 316 | 68 |
| 2021 | ||||
| January | 115 | 74 | 316 | 69 |
| February | 115 | 75 | 317 | 69 |
| March | 115 | 76 | 317 | 70 |
| April | 116 | 76 | 319 | 71 |
| May | 116 | 76 | 319 | 71 |
|
Note: Other includes "other personal loans" and "loans to unincorporated businesses." IFRS update in 2011 resulted in changes in the accounting of select products. Source: Statistics Canada, Table 36-10-0639-01, Credit liabilities of households. |
||||

Data table for Chart 13
| Personal loans | Credit cards | Lines of credit excluding home equity lines of credit | HELOCs | Other personal loans | |
|---|---|---|---|---|---|
| billions $CAD | |||||
| 2020 | |||||
| January | 0 | 0 | 0 | 0 | 0 |
| February | 1 | 2 | 0 | 1 | 0 |
| March | 1 | -3 | 0 | 3 | -1 |
| April | 0 | -9 | -2 | 2 | -1 |
| May | -1 | -10 | -4 | 1 | -1 |
| June | 0 | -10 | -4 | 0 | -1 |
| July | 1 | -10 | -5 | 0 | 0 |
| August | 1 | -10 | -5 | 1 | 0 |
| September | 1 | -10 | -5 | 2 | 1 |
| October | 2 | -11 | -5 | 3 | 2 |
| November | 2 | -10 | -6 | 4 | 2 |
| December | 2 | -13 | -6 | 5 | 3 |
| 2021 | |||||
| January | 4 | -15 | -6 | 4 | 4 |
| February | 4 | -14 | -7 | 6 | 4 |
| March | 5 | -13 | -7 | 6 | 5 |
| April | 6 | -13 | -7 | 8 | 6 |
| May | 6 | -12 | -8 | 9 | 6 |
| Source: Statistics Canada, Table 36-10-0639-01, Credit liabilities of households. | |||||
As interest rates remained relatively low and home valuations have climbed over the last 20 years, the growth in HELOC balances dwarfed all other forms of non-mortgage borrowing. HELOCs as a proportion of non-mortgage debt grew from 10.5% in January 2000, to 32% by January 2021.Note 16 Looking solely at chartered banks, HELOCs accounted for nearly 44% of outstanding non-mortgage debt as of March 2021. Despite the aggregate balance of outstanding non-mortgage debt declining as COVID-19 lockdowns set in, HELOC balances were up 2.5% in March 2021 from January 2020, while aggregate non-mortgage balances declined 1.8% over the same period.Note 17 However, some banks include mortgage balances in their reported HELOC balances. Specifically, with combined plans there is both a mortgage and HELOC component, but these combined plans are sometimes classified entirely as HELOCs. This mortgage component that can be identified in HELOC balances has been a sizeable contributor to the overall growth in HELOCs as explained by the Bank of Canada in their article “Reassessing the Growth of HELOCs in Canada Using New Regulatory Data.” After removing this mortgage component to derive a direct measure of HELOC debt, it is estimated that between the first quarters of 2020 and 2021, total HELOCs actually declined by over $10 billion.
A potential risk among households is the increased potential to add an unsustainable amount debt as rising home values unlock the possibility of expanded credit lines. Rising home valuations create more equity for home owners to draw from, and a potential use of HELOCs is to perform home renovations, which saw an 11.5% increase in expenditure from January 2020 to March 2021.Note 18 However, increasing HELOC borrowing as a result of higher property values has not materialized given that, as discussed previously, total HELOC debt has declined substantially over 2020. Unsecured lines of credit on the other hand, which generally have higher interest rates than their secured counterparts, declined significantly through 2020, and continued to decline into 2021, with overall outstanding balances in March 2021 down 10% from January 2020.

Data table for Chart 14
| Credit liabilities of households | |||
|---|---|---|---|
| Lines of credit, total | Lines of credit: excluding home equity lines of credit | Home equity lines of credit | |
| billions $CAD | |||
| 2001 | |||
| January | 41 | 10 | 31 |
| February | 41 | 10 | 32 |
| March | 42 | 10 | 32 |
| April | 43 | 10 | 33 |
| May | 42 | 10 | 33 |
| June | 43 | 10 | 33 |
| July | 43 | 10 | 33 |
| August | 44 | 10 | 33 |
| September | 44 | 10 | 34 |
| October | 45 | 11 | 34 |
| November | 45 | 11 | 34 |
| December | 46 | 11 | 35 |
| 2002 | |||
| January | 48 | 12 | 36 |
| February | 49 | 12 | 37 |
| March | 50 | 12 | 38 |
| April | 51 | 12 | 39 |
| May | 52 | 13 | 39 |
| June | 53 | 13 | 40 |
| July | 53 | 13 | 40 |
| August | 55 | 13 | 41 |
| September | 56 | 14 | 42 |
| October | 57 | 14 | 43 |
| November | 58 | 14 | 44 |
| December | 59 | 14 | 45 |
| 2003 | |||
| January | 60 | 15 | 45 |
| February | 61 | 15 | 46 |
| March | 62 | 15 | 47 |
| April | 64 | 16 | 48 |
| May | 65 | 16 | 49 |
| June | 66 | 17 | 50 |
| July | 67 | 17 | 51 |
| August | 68 | 17 | 51 |
| September | 69 | 17 | 52 |
| October | 71 | 17 | 54 |
| November | 72 | 17 | 55 |
| December | 74 | 18 | 56 |
| 2004 | |||
| January | 75 | 18 | 57 |
| February | 77 | 18 | 59 |
| March | 79 | 19 | 60 |
| April | 81 | 19 | 62 |
| May | 83 | 20 | 63 |
| June | 85 | 20 | 64 |
| July | 87 | 21 | 66 |
| August | 89 | 21 | 67 |
| September | 90 | 22 | 69 |
| October | 92 | 22 | 70 |
| November | 94 | 22 | 72 |
| December | 96 | 23 | 73 |
| 2005 | |||
| January | 97 | 23 | 75 |
| February | 99 | 23 | 76 |
| March | 100 | 23 | 77 |
| April | 101 | 23 | 78 |
| May | 103 | 24 | 79 |
| June | 105 | 24 | 81 |
| July | 107 | 24 | 82 |
| August | 108 | 24 | 84 |
| September | 110 | 25 | 85 |
| October | 112 | 25 | 86 |
| November | 113 | 25 | 87 |
| December | 114 | 26 | 89 |
| 2006 | |||
| January | 116 | 26 | 90 |
| February | 117 | 27 | 91 |
| March | 119 | 27 | 91 |
| April | 120 | 28 | 93 |
| May | 122 | 28 | 94 |
| June | 123 | 28 | 95 |
| July | 125 | 28 | 96 |
| August | 126 | 29 | 97 |
| September | 127 | 29 | 98 |
| October | 126 | 29 | 98 |
| November | 128 | 29 | 99 |
| December | 129 | 29 | 100 |
| 2007 | |||
| January | 130 | 30 | 100 |
| February | 131 | 30 | 101 |
| March | 133 | 30 | 102 |
| April | 134 | 31 | 104 |
| May | 136 | 31 | 105 |
| June | 138 | 31 | 106 |
| July | 139 | 32 | 107 |
| August | 141 | 32 | 109 |
| September | 143 | 33 | 110 |
| October | 144 | 33 | 111 |
| November | 146 | 33 | 113 |
| December | 148 | 33 | 115 |
| 2008 | |||
| January | 150 | 34 | 116 |
| February | 152 | 35 | 118 |
| March | 155 | 35 | 119 |
| April | 158 | 36 | 122 |
| May | 160 | 36 | 124 |
| June | 162 | 37 | 126 |
| July | 165 | 37 | 127 |
| August | 167 | 38 | 129 |
| September | 170 | 38 | 132 |
| October | 172 | 39 | 134 |
| November | 175 | 39 | 136 |
| December | 178 | 39 | 138 |
| 2009 | |||
| January | 182 | 41 | 141 |
| February | 186 | 43 | 143 |
| March | 189 | 44 | 145 |
| April | 192 | 45 | 147 |
| May | 196 | 46 | 150 |
| June | 200 | 48 | 153 |
| July | 203 | 48 | 155 |
| August | 207 | 49 | 158 |
| September | 210 | 50 | 160 |
| October | 212 | 50 | 162 |
| November | 215 | 51 | 164 |
| December | 217 | 52 | 165 |
| 2010 | |||
| January | 219 | 52 | 167 |
| February | 221 | 53 | 169 |
| March | 223 | 53 | 170 |
| April | 224 | 53 | 172 |
| May | 225 | 53 | 172 |
| June | 226 | 52 | 173 |
| July | 228 | 53 | 175 |
| August | 229 | 54 | 176 |
| September | 231 | 54 | 177 |
| October | 232 | 55 | 178 |
| November | 234 | 55 | 179 |
| December | 234 | 55 | 179 |
| 2011 | |||
| January | 235 | 56 | 179 |
| February | 236 | 56 | 181 |
| March | 237 | 56 | 181 |
| April | 239 | 56 | 182 |
| May | 240 | 57 | 183 |
| June | 242 | 58 | 184 |
| July | 243 | 58 | 185 |
| August | 244 | 58 | 186 |
| September | 245 | 58 | 187 |
| October | 246 | 58 | 188 |
| November | 252 | 59 | 193 |
| December | 253 | 60 | 193 |
| 2012 | |||
| January | 254 | 56 | 198 |
| February | 254 | 55 | 199 |
| March | 254 | 55 | 199 |
| April | 255 | 55 | 200 |
| May | 256 | 55 | 201 |
| June | 257 | 55 | 202 |
| July | 258 | 55 | 202 |
| August | 259 | 55 | 203 |
| September | 260 | 56 | 204 |
| October | 260 | 56 | 205 |
| November | 263 | 58 | 205 |
| December | 263 | 58 | 205 |
| 2013 | |||
| January | 263 | 59 | 205 |
| February | 263 | 58 | 205 |
| March | 263 | 58 | 205 |
| April | 263 | 58 | 205 |
| May | 263 | 59 | 204 |
| June | 263 | 59 | 204 |
| July | 263 | 59 | 204 |
| August | 263 | 59 | 203 |
| September | 263 | 60 | 203 |
| October | 262 | 60 | 203 |
| November | 262 | 59 | 203 |
| December | 262 | 59 | 203 |
| 2014 | |||
| January | 262 | 59 | 203 |
| February | 262 | 59 | 203 |
| March | 263 | 60 | 203 |
| April | 263 | 60 | 203 |
| May | 263 | 60 | 203 |
| June | 263 | 60 | 203 |
| July | 264 | 61 | 203 |
| August | 264 | 61 | 203 |
| September | 265 | 61 | 203 |
| October | 265 | 61 | 203 |
| November | 269 | 65 | 204 |
| December | 269 | 66 | 204 |
| 2015 | |||
| January | 270 | 66 | 204 |
| February | 270 | 66 | 205 |
| March | 271 | 67 | 205 |
| April | 272 | 67 | 205 |
| May | 272 | 67 | 205 |
| June | 272 | 67 | 205 |
| July | 273 | 68 | 205 |
| August | 273 | 68 | 205 |
| September | 273 | 68 | 205 |
| October | 273 | 68 | 205 |
| November | 274 | 68 | 205 |
| December | 274 | 68 | 205 |
| 2016 | |||
| January | 274 | 69 | 205 |
| February | 275 | 70 | 205 |
| March | 275 | 69 | 206 |
| April | 277 | 70 | 207 |
| May | 278 | 70 | 207 |
| June | 279 | 70 | 208 |
| July | 280 | 71 | 209 |
| August | 279 | 70 | 209 |
| September | 279 | 69 | 210 |
| October | 280 | 70 | 211 |
| November | 281 | 70 | 212 |
| December | 283 | 71 | 212 |
| 2017 | |||
| January | 284 | 71 | 213 |
| February | 285 | 71 | 213 |
| March | 286 | 72 | 215 |
| April | 288 | 72 | 217 |
| May | 290 | 72 | 218 |
| June | 292 | 72 | 220 |
| July | 294 | 72 | 222 |
| August | 295 | 71 | 223 |
| September | 295 | 71 | 224 |
| October | 296 | 71 | 225 |
| November | 297 | 71 | 226 |
| December | 298 | 71 | 228 |
| 2018 | |||
| January | 301 | 72 | 228 |
| February | 301 | 72 | 229 |
| March | 303 | 72 | 230 |
| April | 304 | 73 | 232 |
| May | 305 | 72 | 233 |
| June | 308 | 73 | 234 |
| July | 310 | 74 | 236 |
| August | 311 | 73 | 237 |
| September | 312 | 74 | 239 |
| October | 313 | 73 | 240 |
| November | 315 | 74 | 241 |
| December | 315 | 74 | 241 |
| 2019 | |||
| January | 316 | 74 | 242 |
| February | 317 | 74 | 242 |
| March | 317 | 75 | 243 |
| April | 318 | 75 | 243 |
| May | 318 | 74 | 244 |
| June | 320 | 75 | 245 |
| July | 321 | 75 | 246 |
| August | 321 | 76 | 246 |
| September | 321 | 76 | 246 |
| October | 321 | 76 | 246 |
| November | 322 | 75 | 246 |
| December | 322 | 75 | 246 |
| 2020 | |||
| January | 318 | 71 | 247 |
| February | 318 | 70 | 248 |
| March | 321 | 71 | 250 |
| April | 318 | 69 | 249 |
| May | 314 | 67 | 248 |
| June | 314 | 66 | 247 |
| July | 313 | 66 | 247 |
| August | 314 | 66 | 248 |
| September | 315 | 66 | 249 |
| October | 316 | 65 | 250 |
| November | 316 | 65 | 251 |
| December | 316 | 64 | 251 |
| 2021 | |||
| January | 316 | 64 | 251 |
| February | 317 | 64 | 253 |
| March | 317 | 64 | 253 |
| April | 319 | 64 | 255 |
| May | 319 | 63 | 256 |
| Source: Statistics Canada table 36-10-0639-01, Credit liabilities of households | |||
Looking beyond the rise in outstanding HELOC balances, significant growth occurred in the use of credit cards over the last two decades. As households became accustomed to using their credit cards for everyday purchases and the product space evolved as competitors refined rewards systems and included additional perks, the outstanding balance carried on credit cards grew from $13.2 billion in January 2000 to a high of $90.6 billion in February 2020, an average annual growth of 20.7%. With credit cards typically being the most expensive form of debt, as non-essential spending declined and disposable incomes rose during the pandemic, outstanding credit card balances saw the largest negative annual growth since May of 1999. Outstanding credit card balances fell to a low of $74 billion in January 2021, a decline of 18.3% in less than twelve months. While other loan categories resumed some growth into the end of 2020 with businesses partially reopening, credit card balances continued to decline despite typically strong seasonal spending around the holidays.Note 19 With the expansion in currency and deposits among households and continued strong savings, the reliance on credit card debt may continue to be diminished for some time.

Data table for Chart 15
| Change in credit card balances from November to December | |
|---|---|
| millions $CAD | |
| 1990 | 477 |
| 1991 | 234 |
| 1992 | 583 |
| 1993 | 834 |
| 1994 | 858 |
| 1995 | 750 |
| 1996 | 447 |
| 1997 | 838 |
| 1998 | 776 |
| 1999 | 1,004 |
| 2000 | 573 |
| 2001 | 919 |
| 2002 | 1,404 |
| 2003 | 2,108 |
| 2004 | 1,834 |
| 2005 | 1,593 |
| 2006 | 1,302 |
| 2007 | 2,075 |
| 2008 | 2,593 |
| 2009 | 1,898 |
| 2010 | 1,727 |
| 2011 | 1,354 |
| 2012 | 1,760 |
| 2013 | 2,053 |
| 2014 | 1,811 |
| 2015 | 1,821 |
| 2016 | 2,482 |
| 2017 | 1,118 |
| 2018 | 1,466 |
| 2019 | 2,324 |
| 2020 | -2,386 |
| Source: Statistics Canada, Table 36-10-0639-01, Credit liabilities of households. | |
Bank margins widen as interest rates fall to record lows while riskiest debtors repay their loans
As lockdowns remained in effect, banks extended temporary credit relief to their customers through the summer, and as a result the average outstanding balance weighted APRs (Annualized Percentage Rate) for credit cards declined from their February highs. However, by September these measures had been largely curtailed, and average effective rates returned to their pre-pandemic levels. With interest at historic lows, and credit card APRs on the rise, the implicit cost of using credit cards reached a record level as measured by the difference between the costs of funds and the rates being charged. While one might conclude that average credit card rates rose in response to a shift in outstanding balances from higher credit rated borrowers to lower, the reality is that those with lower scores repaid their debt at a faster rate than those with higher scores throughout the pandemic.

Data table for Chart 16
| Credit card balances (left axis) | Credit card balance weighted APR rate (right axis) | |
|---|---|---|
| billions $CAD | percent | |
| 2017 | ||
| January | 71 | 18.4 |
| February | 70 | 18.8 |
| March | 70 | 18.3 |
| April | 70 | 18.3 |
| May | 71 | 18.6 |
| June | 72 | 18.7 |
| July | 72 | 18.6 |
| August | 72 | 18.5 |
| September | 73 | 18.9 |
| October | 73 | 18.7 |
| November | 74 | 18.8 |
| December | 76 | 18.7 |
| 2018 | ||
| January | 75 | 18.8 |
| February | 74 | 19.0 |
| March | 74 | 18.5 |
| April | 74 | 18.7 |
| May | 75 | 18.8 |
| June | 76 | 18.8 |
| July | 76 | 18.8 |
| August | 77 | 18.9 |
| September | 77 | 19.0 |
| October | 77 | 19.0 |
| November | 78 | 19.0 |
| December | 79 | 18.9 |
| 2019 | ||
| January | 78 | 19.2 |
| February | 77 | 19.4 |
| March | 77 | 18.9 |
| April | 78 | 19.0 |
| May | 79 | 19.1 |
| June | 79 | 19.1 |
| July | 79 | 19.1 |
| August | 80 | 19.1 |
| September | 80 | 19.3 |
| October | 80 | 19.2 |
| November | 81 | 19.3 |
| December | 82 | 19.2 |
| 2020 | ||
| January | 81 | 19.4 |
| February | 80 | 19.5 |
| March | 78 | 19.2 |
| April | 73 | 19.4 |
| May | 71 | 19.0 |
| June | 71 | 19.1 |
| July | 71 | 19.1 |
| August | 71 | 19.2 |
| September | 71 | 19.4 |
| October | 70 | 19.2 |
| November | 71 | 19.4 |
| December | 70 | 19.3 |
| 2021 | ||
| January | 68 | 19.4 |
| February | 66 | 19.5 |
| March | 67 | 19.1 |
| April | 66 | 19.3 |
| May | 66 | 19.3 |
| Source: Bank of Canada, Report on New and Existing Lending (A4). | ||

Data table for Chart 17
| Credit Score: No Score or No Hit | Credit Score: Less than 640 | Credit Score: 641 - 680 | Credit Score: 681 - 720 | Credit Score: 721 - 760 | Credit Score: 761 - 800 | Credit Score: 801+ | |
|---|---|---|---|---|---|---|---|
| billions $CAD | |||||||
| 2019Q4 | 3 | 15 | 12 | 16 | 16 | 13 | 16 |
| 2020Q1 | 3 | 14 | 12 | 16 | 15 | 11 | 12 |
| 2020Q2 | 3 | 12 | 11 | 14 | 14 | 11 | 14 |
| 2020Q3 | 3 | 10 | 11 | 14 | 15 | 12 | 15 |
| 2020Q4 | 3 | 10 | 10 | 14 | 14 | 12 | 15 |
| 2021Q1 | 3 | 9 | 10 | 13 | 14 | 11 | 14 |
| Source: Bank of Canada, Non-mortage Loans (A2). | |||||||

Data table for Chart 18
| Credit Score: Less than 640 | Credit Score: 641 - 680 | Credit Score: 681 - 720 | Credit Score: 721 - 760 | Credit Score: 761 - 800 | Credit Score: 801+ | |
|---|---|---|---|---|---|---|
| percent | ||||||
| 2019Q4 to 2021Q1 | -37 | -19 | -17 | -18 | -17 | -13 |
| Source: Bank of Canada, Non-mortage Loans (A2). | ||||||
The margins charged on other non-mortgage lending products can be calculated as the difference between the APRs charged and cost of funds that lenders would be paying to support these loans, with the overnight being a proxy for the funding rate.Note 20 Since the APRs on the majority of non-mortgage loans are variable and based off the prime rate plus a risk percentage, as interest rates fell to historic lows, on a percentage basis, the margins between the costs of funds and the rates charged on variable rate loans rose to record levels.
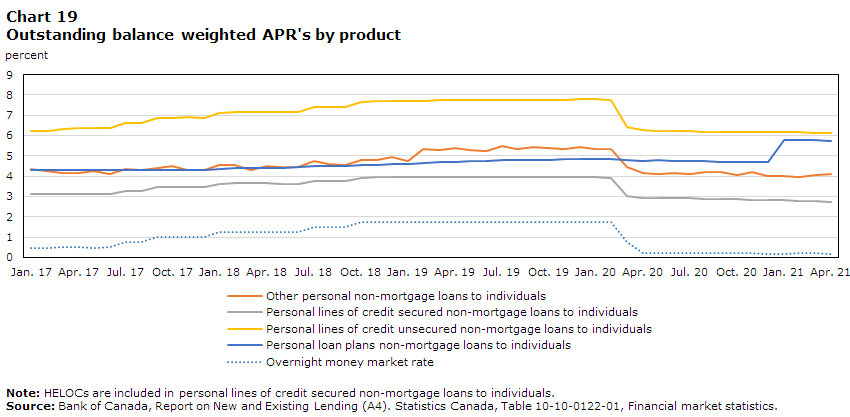
Data table for Chart 19
| Other personal non-mortgage loans to individuals | Personal lines of credit secured non-mortgage loans to individuals | Personal lines of credit unsecured non-mortgage loans to individuals | Personal loan plans non-mortgage loans to individuals | Overnight money market rate | |
|---|---|---|---|---|---|
| percent | |||||
| 2017 | |||||
| January | 4.3 | 3.1 | 6.2 | 4.3 | 0.5 |
| February | 4.3 | 3.1 | 6.2 | 4.3 | 0.5 |
| March | 4.2 | 3.1 | 6.3 | 4.3 | 0.5 |
| April | 4.1 | 3.1 | 6.4 | 4.3 | 0.5 |
| May | 4.2 | 3.1 | 6.4 | 4.3 | 0.5 |
| June | 4.1 | 3.1 | 6.4 | 4.3 | 0.5 |
| July | 4.4 | 3.3 | 6.6 | 4.3 | 0.7 |
| August | 4.3 | 3.3 | 6.6 | 4.3 | 0.7 |
| September | 4.4 | 3.5 | 6.9 | 4.3 | 1.0 |
| October | 4.5 | 3.5 | 6.9 | 4.3 | 1.0 |
| November | 4.3 | 3.5 | 6.9 | 4.3 | 1.0 |
| December | 4.3 | 3.5 | 6.9 | 4.3 | 1.0 |
| 2018 | |||||
| January | 4.5 | 3.6 | 7.1 | 4.4 | 1.2 |
| February | 4.5 | 3.6 | 7.1 | 4.4 | 1.2 |
| March | 4.3 | 3.6 | 7.2 | 4.4 | 1.2 |
| April | 4.5 | 3.6 | 7.2 | 4.4 | 1.2 |
| May | 4.5 | 3.6 | 7.2 | 4.4 | 1.2 |
| June | 4.4 | 3.6 | 7.2 | 4.4 | 1.2 |
| July | 4.7 | 3.8 | 7.4 | 4.5 | 1.5 |
| August | 4.6 | 3.8 | 7.4 | 4.5 | 1.5 |
| September | 4.5 | 3.8 | 7.4 | 4.5 | 1.5 |
| October | 4.8 | 3.9 | 7.6 | 4.5 | 1.7 |
| November | 4.8 | 3.9 | 7.7 | 4.6 | 1.7 |
| December | 5.0 | 4.0 | 7.7 | 4.6 | 1.8 |
| 2019 | |||||
| January | 4.7 | 3.9 | 7.7 | 4.6 | 1.7 |
| February | 5.3 | 4.0 | 7.7 | 4.7 | 1.7 |
| March | 5.3 | 4.0 | 7.7 | 4.7 | 1.7 |
| April | 5.4 | 4.0 | 7.8 | 4.7 | 1.7 |
| May | 5.3 | 4.0 | 7.8 | 4.7 | 1.7 |
| June | 5.3 | 4.0 | 7.8 | 4.8 | 1.7 |
| July | 5.5 | 4.0 | 7.8 | 4.8 | 1.7 |
| August | 5.3 | 4.0 | 7.7 | 4.8 | 1.7 |
| September | 5.5 | 3.9 | 7.7 | 4.8 | 1.7 |
| October | 5.4 | 3.9 | 7.7 | 4.8 | 1.7 |
| November | 5.3 | 3.9 | 7.8 | 4.8 | 1.7 |
| December | 5.4 | 3.9 | 7.8 | 4.8 | 1.7 |
| 2020 | |||||
| January | 5.3 | 3.9 | 7.8 | 4.8 | 1.7 |
| February | 5.3 | 3.9 | 7.8 | 4.9 | 1.7 |
| March | 4.4 | 3.0 | 6.4 | 4.8 | 0.7 |
| April | 4.2 | 2.9 | 6.3 | 4.8 | 0.2 |
| May | 4.1 | 2.9 | 6.2 | 4.8 | 0.2 |
| June | 4.2 | 2.9 | 6.2 | 4.8 | 0.2 |
| July | 4.1 | 2.9 | 6.2 | 4.7 | 0.2 |
| August | 4.2 | 2.9 | 6.2 | 4.7 | 0.2 |
| September | 4.2 | 2.9 | 6.2 | 4.7 | 0.2 |
| October | 4.1 | 2.9 | 6.2 | 4.7 | 0.2 |
| November | 4.2 | 2.8 | 6.2 | 4.7 | 0.2 |
| December | 4.0 | 2.8 | 6.2 | 4.7 | 0.2 |
| 2021 | |||||
| January | 4.0 | 2.8 | 6.2 | 5.8 | 0.2 |
| February | 4.0 | 2.8 | 6.2 | 5.8 | 0.2 |
| March | 4.1 | 2.8 | 6.1 | 5.8 | 0.2 |
| April | 4.1 | 2.7 | 6.1 | 5.8 | 0.1 |
|
Note: HELOCs are included in personal lines of credit secured non-mortgage loans to individuals. Source: Bank of Canada, Report on New and Existing Lending (A4). Statistics Canada, Table 10-10-0122-01, Financial market statistics. |
|||||
Expected credit losses grow to record levels, despite declines in outstanding debt
As part of their risk management activities, financial institutions estimate the proportion of their loan portfolios that may enter default each period. These expected credit losses (ECL) are based on actuarial assumptions that attempt to anticipate the default rates on their loans and – subsequently – the amount of impaired loans that may need to be written off in a given period. While banks factored in relatively little ECL for non-mortgage loans prior to the financial crisis of 2008, new banking regulations forced banks to set aside greater amounts to protect against credit losses. With low interest rates and a strengthening economy in the following years, ECL as percentage of outstanding debt declined from the 2008 highs. This trend continued until the COVID-19 lockdowns occurred, when banks ECL rates nearly doubled from 1.1% in the fourth quarter of 2019, to 2% by the second quarter of 2020.Note 21 With the various levels of government being quick to offer support measures and many able to work from home, losses were not as severe as anticipated. As a result, ECL rates remained relatively unchanged for the duration of the year and into the first quarter of 2021.
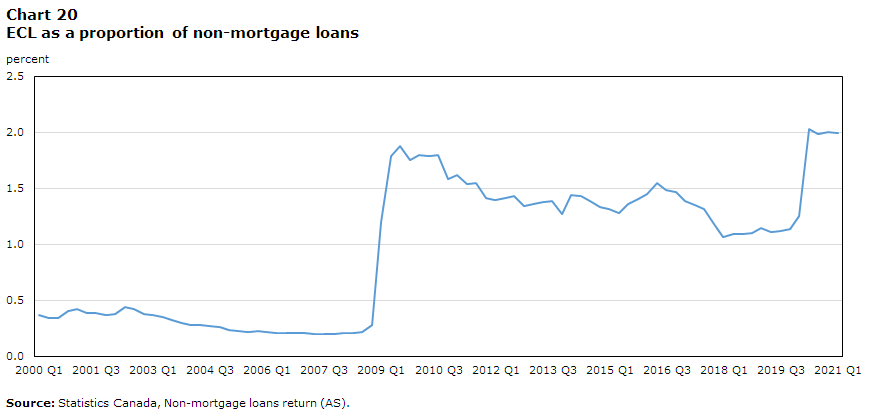
Data table for Chart 20
| Reference Period | ECL as a proportion of Non-Mortgage Loans |
|---|---|
| percent | |
| 2000Q1 | 0.36 |
| 2000Q2 | 0.34 |
| 2000Q3 | 0.34 |
| 2000Q4 | 0.40 |
| 2001Q1 | 0.42 |
| 2001Q2 | 0.39 |
| 2001Q3 | 0.38 |
| 2001Q4 | 0.37 |
| 2002Q1 | 0.37 |
| 2002Q2 | 0.43 |
| 2002Q3 | 0.42 |
| 2002Q4 | 0.38 |
| 2003Q1 | 0.37 |
| 2003Q2 | 0.35 |
| 2003Q3 | 0.33 |
| 2003Q4 | 0.30 |
| 2004Q1 | 0.28 |
| 2004Q2 | 0.28 |
| 2004Q3 | 0.27 |
| 2004Q4 | 0.26 |
| 2005Q1 | 0.23 |
| 2005Q2 | 0.23 |
| 2005Q3 | 0.22 |
| 2005Q4 | 0.22 |
| 2006Q1 | 0.22 |
| 2006Q2 | 0.21 |
| 2006Q3 | 0.20 |
| 2006Q4 | 0.21 |
| 2007Q1 | 0.20 |
| 2007Q2 | 0.20 |
| 2007Q3 | 0.19 |
| 2007Q4 | 0.20 |
| 2008Q1 | 0.21 |
| 2008Q2 | 0.21 |
| 2008Q3 | 0.21 |
| 2008Q4 | 0.27 |
| 2009Q1 | 1.20 |
| 2009Q2 | 1.79 |
| 2009Q3 | 1.87 |
| 2009Q4 | 1.75 |
| 2010Q1 | 1.79 |
| 2010Q2 | 1.78 |
| 2010Q3 | 1.80 |
| 2010Q4 | 1.58 |
| 2011Q1 | 1.61 |
| 2011Q2 | 1.54 |
| 2011Q3 | 1.55 |
| 2011Q4 | 1.42 |
| 2012Q1 | 1.40 |
| 2012Q2 | 1.41 |
| 2012Q3 | 1.43 |
| 2012Q4 | 1.34 |
| 2013Q1 | 1.36 |
| 2013Q2 | 1.37 |
| 2013Q3 | 1.39 |
| 2013Q4 | 1.27 |
| 2014Q1 | 1.43 |
| 2014Q2 | 1.43 |
| 2014Q3 | 1.39 |
| 2014Q4 | 1.33 |
| 2015Q1 | 1.31 |
| 2015Q2 | 1.27 |
| 2015Q3 | 1.36 |
| 2015Q4 | 1.41 |
| 2016Q1 | 1.45 |
| 2016Q2 | 1.54 |
| 2016Q3 | 1.48 |
| 2016Q4 | 1.46 |
| 2017Q1 | 1.39 |
| 2017Q2 | 1.35 |
| 2017Q3 | 1.31 |
| 2017Q4 | 1.18 |
| 2018Q1 | 1.07 |
| 2018Q2 | 1.09 |
| 2018Q3 | 1.09 |
| 2018Q4 | 1.10 |
| 2019Q1 | 1.14 |
| 2019Q2 | 1.11 |
| 2019Q3 | 1.12 |
| 2019Q4 | 1.13 |
| 2020Q1 | 1.25 |
| 2020Q2 | 2.03 |
| 2020Q3 | 1.98 |
| 2020Q4 | 2.00 |
| 2021Q1 | 1.99 |
| Source: Statistics Canada, Non-mortgage loans return (AS). | |
Conclusion
During the pandemic, household non-mortgage borrowing saw record declines, while household mortgage borrowing expanded to new highs. Due in large part to support measures from all levels of government, households saw their disposable incomes rise through the pandemic, as the cumulative effects of these support measures more than offset lost wages. As a result of increased disposable incomes and declining consumption, many households used the pandemic as an opportunity to pay down expensive debt, with the balances of unsecured lines of credit and credit cards being paid down in record amounts. Those who saw the greatest reduction in these outstanding balances were those with the lowest credit ratings, suggesting that those most vulnerable to financial hardships were able to use savings prudently during the pandemic. Despite an uptick in the economy as businesses reopened into the latter half of 2020, credit card debt continued to decline, while the total outstanding balance of non-mortgage debt ended the year below its pre-pandemic highs. With the economy looking to reopen fully, many Canadians will likely find themselves carrying lighter non-mortgage debt balances than they had going into the pandemic.
References
Bank of Canada (May 2021). Financial System Review – May 2021. Available at https://www.bankofcanada.ca/2021/05/financial-system-review-2021/
Bank of Canada (May 2021). Funds advanced and outstanding balances for new and existing lending by chartered banks. Available at https://www.bankofcanada.ca/rates/banking-and-financial-statistics/funds-advanced-and-outstanding-balances-for-new-and-existing-lending-by-chartered-banks/
Bank of Canada (May 2021). Historical selected credit measures (formerly E2). Available at https://www.bankofcanada.ca/rates/banking-and-financial-statistics/selected-credit-measures-formerly-e2/
Bank of Canada (May 2021). Reassessing the Growth of HELOCs in Canada Using New Regulatory Data – May 2021. Available at https://www.bankofcanada.ca/2019/05/staff-analytical-note-2019-14/
Statistics Canada (May 2021). “Credit liabilities of households.” Available at https://www150.statcan.gc.ca/t1/tbl1/en/cv.action?pid=3610063901.
Statistics Canada (May 2021). “Current and capital accounts – households, Canada, quarterly.” Available at https://www150.statcan.gc.ca/t1/tbl1/en/cv.action?pid=3610011201
Statistics Canada (May 2021). “Debt service indicators of households, national balance sheet accounts.” Available at https://www150.statcan.gc.ca/t1/tbl1/en/cv.action?pid=1110006501.
Statistics Canada (May 2021). “Household sector credit market summary table, seasonally adjusted estimates.” Available at https://www150.statcan.gc.ca/t1/tbl1/en/cv.action?pid=3810023801
Appendix
| Purpose of household financing | Examples |
|---|---|
| Credit extended to households for purchasing consumer goods and services. | Credit card balances owing, lines of credit (secured and unsecured), student loans, life insurance policy loans, auto loans, auto leases, payday loans, personal loans |
| Credit extended to households and unincorporated businesses (farm and non-farm) excluding consumer credit and mortgages. For purchasing non-consumer goods, financial investments, or for fixed capital formation. | Loans to purchase securities, loans to carry tax sheltered plans, loans to purchase mobile homes, loans for renovations of residential property, loans for business purposes |
- Date modified: