
Analysis in Brief
The Canadian Research and Development Pharmaceutical Sector
Skip to text
Text begins
Executive summary
This study examines the economic footprint created by the Canadian research and development pharmaceutical sector on the Canadian economy in 2018, including a focus on the contribution of Innovative Medicines Canada’s members. While the impact of the sector’s medical research is well known, less known are the economic impacts of the sector on the Canadian economy, such as the value generated, the jobs supported and the investments made. This study is designed to address this gap.
In 2018, the sector added almost $15 billion in value added (gross domestic product) to the Canadian economy and supported over 100,000 full-time equivalent jobs (FTE) within Canada. Additionally, it spent between $1.5 and $2.0 billion on research and development. The sector spent $1 billion on in-house research and development in Canada, while also spending $950 million outsourcing research and development work both domestically and outside Canada.
Innovative Medicines Canada (IMC) members generated over half of the sector’s value added, with an economic impact of almost $8 billion within Canada. IMC members directly employed more than 24,000 FTE persons and supported an additional 30,000 FTE Canadian jobs.
The R&D pharmaceutical sector is important to Canadians and the Canadian economy. It is hoped that further research will be able to build upon the findings contained within this study.
1. Introduction
This study examines the economic footprint of the research and development (R&D) pharmaceutical sector within Canada. Companies in the sector conduct R&D as a means to develop innovative medicines and drug therapies for medical treatment to prevent, remedy or mitigate diseases. The sector also supports R&D work done by other organizations, such as Canadian hospitals and universities, through outsourcing of R&D work in the form of collaborations and partnerships. The study will provide details for all R&D activities conducted by the sector. It will also focus on the economic impact of the members of Innovative Medicines Canada, an association of more than 40 research-based pharmaceutical companies, within the larger sector.
The Canadian R&D pharmaceutical sector is made up of more than 200 businesses which are mostly associated with three core industries: pharmaceutical and medicine manufacturers; pharmaceuticals and pharmacy supplies merchant wholesalers; and research and development in the physical, engineering and life sciencesNote . Not all pharmaceutical businesses were included in the study. For example, businesses that primarily focus on medical devices, generic pharmaceuticals or veterinary medicines were excluded.
The economic footprint of the R&D pharmaceutical sector and members within Innovative Medicines Canada will be established through several key indicators. These include value added (gross domestic product), employment, research and development activities (both in-house and outsourced), financial statistics and international trade. The reference period is 2018, the most recent year for which all these data are available.
2. The research and development pharmaceutical sector
2.1 Economic footprint
2.1.1 Value added
Sector contributed almost $15 billion in value added to the Canadian economy
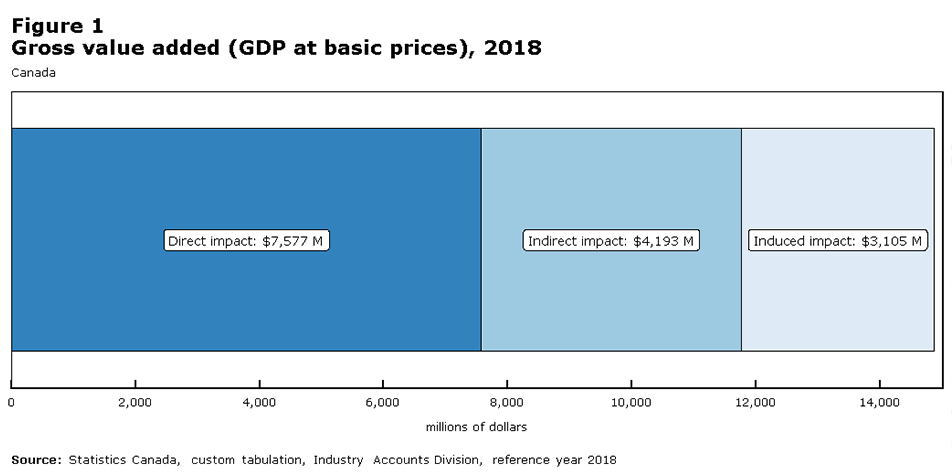
Gross value added is a measure of the contribution a sector makes to Canada’s economic output as measured by the gross domestic product (GDP). There are three ways that value added can be generated: directly through the industry’s production, indirectly through economic activities associated with supplying intermediate inputs to the goods and services produced by other economic actors, and induced, through purchasing power derived from labour income earned by those employed in the R&D pharmaceutical sector.
The R&D pharmaceutical sector contributed a gross value added of $14.9 billion in 2018, with just over half ($7.6 billion) generated from direct production activities. For context, this is just over 0.7% of Canada’s gross domestic product at basic prices in 2018.Note
Data table for Figure 1
Canada
Direct impact: $7,577 M
Indirect impact: $4,193 M
Induced impact: $3,105 M
Source: Statistics Canada, custom tabulation, Industry Accounts Division, reference year 2018
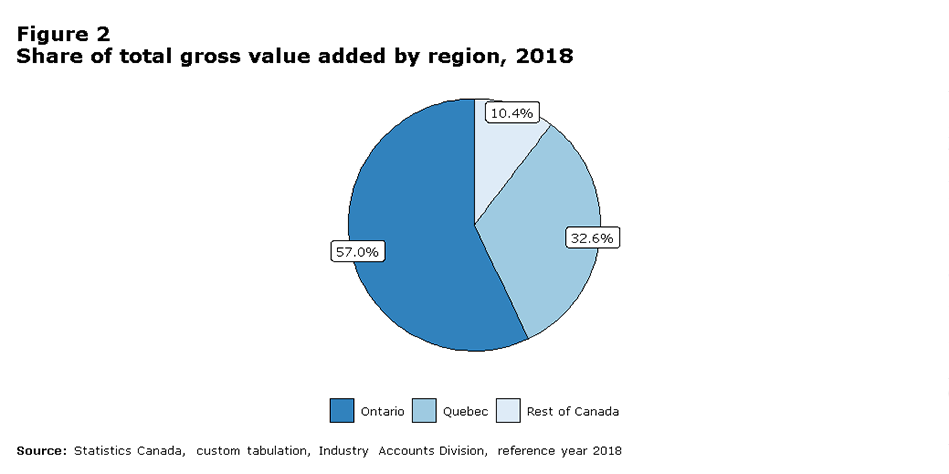
While the sector had impacts in all provinces and territories, about 90% of its gross value added was generated in Ontario ($8.5 billion) and Quebec ($4.8 billion).
Data table for Figure 2
Ontario: 57.0%
Quebec: 32.6%
Rest of Canada: 10.4%
Source: Statistics Canada, custom tabulation, Industry Accounts Division, reference year 2018
Sector reported $30 billion in operating revenue
R&D pharmaceutical companies generated $30.0 billion in operating revenue in 2018, 0.7% of all operating revenue in Canada.Note Operating profits totaled $1.9 billion. The sector’s operating profit margin was 6.2%, lower than the national economy average, across all sectors, of 11.2%.
2.1.2 Employment
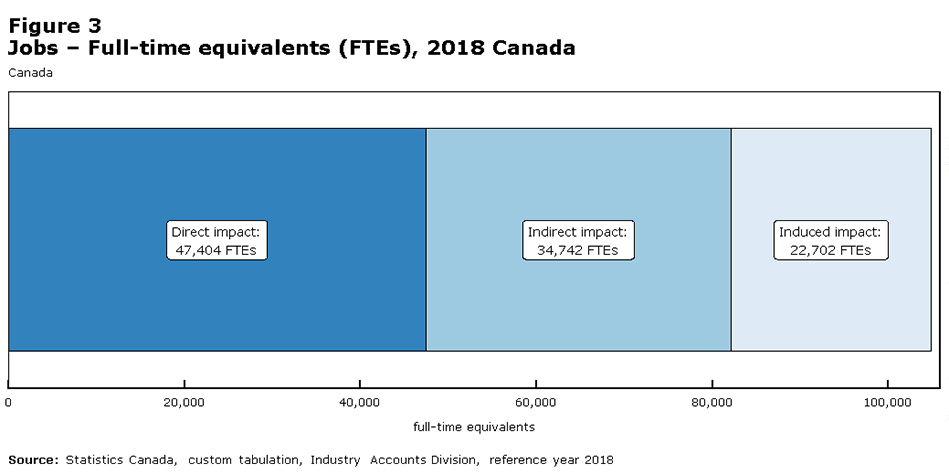
Sector supported over 100,000 full-time equivalent jobs in Canada
In addition to adding nearly $15 billion in gross value to Canada’s GDP, the R&D pharmaceutical sector supported the equivalent of about 105,000 full-time (FTE) jobs across the economy. Over half of these jobs were spun off from direct R&D pharmaceutical activity, including 58,000 in Ontario and 37,000 in Quebec.
Data table for Figure 3
Canada
Direct impact: 47,404 FTEs
Indirect impact: 34,742 FTEs
Induced impact: 22,702 FTEs
Source: Statistics Canada, custom tabulation, Industry Accounts Division, reference year 2018
While most of the sector’s direct production took place in Canada’s two largest provinces, the sector impacted (directly, indirectly, or induced) more than 10,000 FTE jobs in the rest of Canada.
2.1.3 Trade
Sector imported over $20 billion worth of goods
The R&D pharmaceutical sector depends heavily on trade, importing $20.6 billion worth of goods in 2018.Note The United States was the single largest country of origin ($7.5 billion), although Europe, as a whole, accounted for $11.5 billion worth of imports.
Businesses that traded tended to be well integrated into the global trading system, with almost 90% of importers buying goods from multiple countries.

Data table for Figure 4
United States: $7,526 M
Americas (excluding USA): $640 M
Europe: $11,538 M
Africa: $7 M
Asia and Oceania: $889 M
Source: Statistics Canada, custom tabulation, Industry Accounts Division, reference year 2018
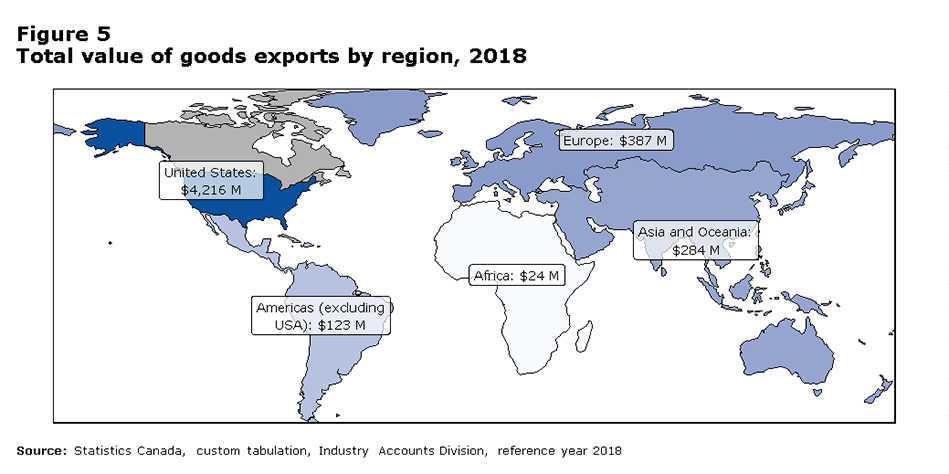
Most exports sent to the United States
The R&D pharmaceutical sector exported just over $5.0 billion in goods in 2018, roughly a quarter of what was imported. The vast majority of exports were destined for the United States ($4.2 billion), followed by Europe ($0.4 billion) and Asia and Oceania ($0.3 billion) pointing to large trade deficits, particularly with European partners.
The sector exported goods to 108 different countries and dependencies while importing from 96. However, fewer enterprises exported (74) than imported (168).
Data table for Figure 5
United States: $4,216 M
Americas (excluding USA): $123 M
Europe: $387 M
Africa: $24 M
Asia and Oceania: $284 M
Source: Statistics Canada, custom tabulation, Industry Accounts Division, reference year 2018
2.2 Research and development
2.2.1 Total R&D expenditures
Information on the R&D activities of Canadian businesses and industrial non-profit organizations is collected through the Annual Survey of Research and Development in Canadian Industry (RDCI). When reporting R&D, companies are asked to break down expenses into in-house R&D and outsourced R&D. In-house R&D refers to expenditures made within Canada for R&D performed within a business, by either the business’s employees or contractors who work on-site on the business’s R&D projects. Outsourced R&D, on the other hand, can refer to R&D payments made within or outside of Canada to other businesses, organizations, or individuals to fund the performance of R&D. Outsourced R&D takes the form of grants, fellowships, or contracts.
Statistics Canada generally reports in-house and outsourced R&D as separate values, as adding in-house and outsourced expenditures together could potentially lead to double counting domestically outsourced R&D. Although an exact estimate of total R&D performed by the R&D pharmaceutical sector cannot be produced for 2018, it is estimated that the amount would lie between $1.5 and $2.0 billion.
2.2.2 In-house R&D expenditures
Sector spent over $1 billion on in-house research and development
In-house research and development (R&D) expenditures in the Canadian R&D pharmaceutical sector totaled $1.03 billion in 2018, which accounted for 5.3% of all business enterprise expenditures on research and development (BERD) in Canada. As with gross value added, most in-house R&D work was conducted in Quebec ($437 million) and Ontario ($384 million), with the two provinces accounting for 80% of all in-house R&D expenditures.
As a knowledge-intensive industry, virtually all in-house R&D expenditures were current expenditures ($1 billion) as opposed to capital expenditures. This includes all spending on wages, materials and services used to support R&D activities, and other current R&D costs (e.g., overhead costs related to R&D).
Capital R&D expenditures (e.g., software, land, buildings, equipment) amounted to $31 million in 2018.Note
Research focused on clinical medicine, basic medicine and medical biotechnology
The field of medical and health sciences dominated in-house R&D within the sector, where clinical medicine ($286 million), basic medicine ($277 million) and medical biotechnology ($258 million) each accounted for approximately a quarter of in-house spending in 2018.

Data table for Figure 6
Medical and health sciences
Other medical: 3.5%
Clinical medicine: 27.7%
Health sciences: 6.7%
Medical biotechnology: 25.0%
Basic medicine: 26.8%
All other fields of research
All other: 10.3%
Source: Statistics Canada, custom tabulation, Survey of Research and Development in Canadian Industry, reference year 2018
Most research and development personnel were in Quebec and Ontario
R&D pharmaceutical companies employed 4% of all R&D personnel (6,136 FTEs) employed by Canadian businesses in 2018. The sector’s in-house expenditures per R&D personnel ($168,000) was above the Canadian average across all sectors ($129,000), in large part because of a higher share of spending on current costs such as services to support R&D, R&D materials, and overhead costs rather than wages and salaries, compared to other businesses conducting R&D.

Data table for Figure 7
Total direct jobs
Ontario: 56.5%
Quebec: 36.9%
Rest of Canada: 6.7%
Total R&D personnel
Ontario: 35.3%
Quebec: 43.1%
Rest of Canada: 21.6%
Source: Statistics Canada, custom tabulation, Industry Accounts Division, Survey of Research and Development in Canadian Industry, reference year 2018
Quebec had more FTE R&D personnel (2,643) than Ontario (2,169), even though Ontario had more total jobs within the sector. While over 90% of the sector’s total FTEs were located in either Ontario or Quebec, the sector’s R&D personnel were more evenly distributed across the country. Over 20% of R&D personnel were located outside of the two largest provinces. Much of the work done outside Quebec and Ontario was performed by small and medium-sized enterprises that focused exclusively on R&D.
The sector employed roughly an equal number of FTE researchers (2,820) and technical support staff (2,787). As well, 529 FTE consultants and contractors performed in-house R&D for these companies on site.
2.2.3 Outsourced R&D expenditures
Sector outsourced almost $1 billion in additional research and development
On top of conducting in-house R&D, R&D pharmaceutical businesses outsourced or contracted out $947 million worth of R&D work in 2018, with just over half ($500 million) outsourced internationally.
Foreign firms accounted for two-thirds of research and development expenditures
One in three R&D pharmaceutical companies were foreign-controlled. These companies tended to be bigger R&D spenders, with foreign-controlled companies accounting for around two-thirds of such expenditures and personnel within the sector.
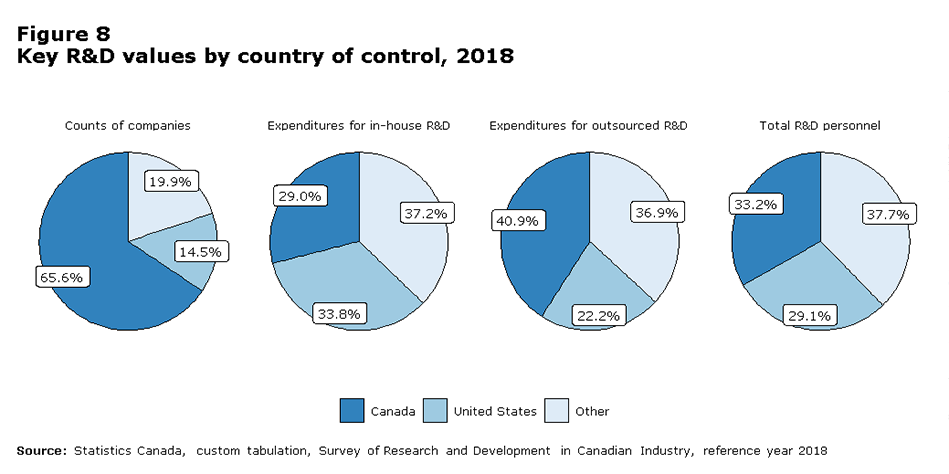
Data table for Figure 8
Counts of companies
Canada: 65.6%
United States: 14.5%
Other: 19.9%
Expenditures for in-house R&D
Canada: 29%
United States: 33.8%
Other: 37.2%
Expenditures for outsourced R&D
Canada: 40.9%
United States: 22.2%
Other: 36.9%
Total R&D personnel
Canada: 33.2%
United States: 29.1%
Other: 37.7%
Source: Statistics Canada, custom tabulation, Survey of Research and Development in Canadian Industry, reference year 2018
2.2.4 SR&ED eligible R&D expenditures
Sector claimed over $900 million worth of R&D work under the SR&ED Program
Some, but not all, R&D expenditures are reported to the Government of Canada under the Scientific Research and Experimental Development (SR&ED) Program, which is designed to support R&D by providing tax incentives for research work done inside Canada. R&D work outsourced outside of Canada is not eligible.
In 2018, businesses in the R&D pharmaceutical sector reported $909 million worth of allowable SR&ED expenditures, with $535 million performed in-house and the rest ($374 million) outsourced to other organizations in Canada.

Data table for Figure 9
In-house R&D
Claimed through SR&ED
Unclaimed
Outsourced R&D in Canada
Claimed through SR&ED
Unclaimed
Source: Statistics Canada, custom tabulation, Scientific Research and Experimental Development Expenditures Claim, Survey of Research and Development in Canadian Industry, reference year 2018
Under the SR&ED Program, R&D pharmaceutical companies claimed just over 50% of their in-house R&D expenditures, but declared well over 80% of their outsourced R&D within Canada. The vast majority of companies that reported both performing and outsourcing R&D claimed at least a portion of their expenditures through the SR&ED program.
Within the sector, most SR&ED claims were filed by large firms. Companies with over 250 employees claimed around 70% of all in-house and outsourced expenditures. Additionally, companies with revenues of $100 million or more comprised more than 70% of in-house and 80% of outsourced expenditures claimed under the program.
Foreign controlled companies also accounted for the majority of the sector’s expenditures claimed under the SR&ED program, comprising 76% of all in-house and 84% of outsourced expenditures.
3. Innovative Medicines Canada members
3.1 Economic footprint
3.1.1 Value added
Members contributed almost $8 billion in value added in Canada
Innovative Medicines Canada (IMC) is an organization that advocates on behalf of more than 40 R&D pharmaceutical companies in Canada. Its members include large established businesses as well as emerging start-ups.
IMC members had an economic impact of $7.8 billion in gross value added in 2018, making up more than half the total impact of the R&D pharmaceutical sector. Similar to the sector as a whole, most value added was concentrated in Ontario ($4.3 billion) and Quebec ($2.9 billion), although IMC members had some form of economic impact across the rest of Canada as well.

Data table for Figure 10
Canada
Direct impact: $3,998 M
Indirect impact: $2,210 M
Induced impact: $1,583 M
Source: Statistics Canada, custom tabulation, Industry Accounts Division, reference year 2018
3.1.2 Employment
Members directly employed or supported roughly 55,000 full-time equivalent jobs
IMC members supported around 55,000 FTE jobs, most of which were in Ontario (29,000) and Quebec (22,000). IMC members directly employed 24,000 FTEs, which was 51.4% of the sector’s total direct FTEs.
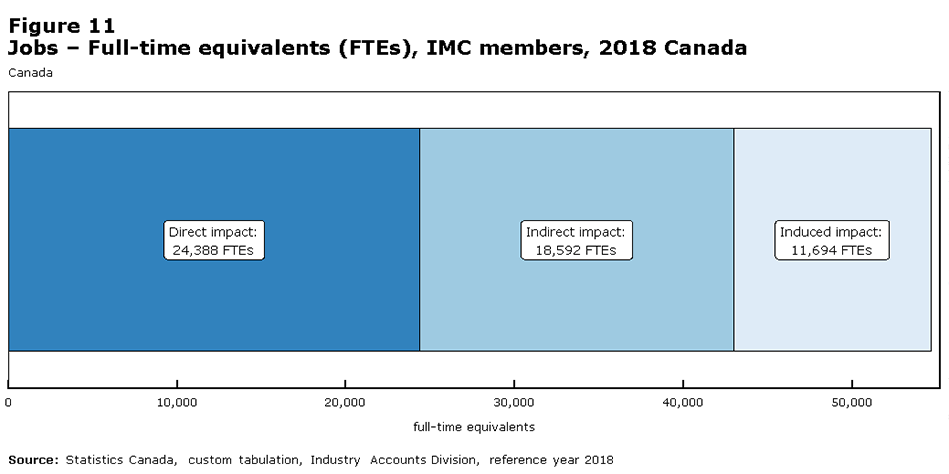
Data table for Figure 11
Canada
Direct impact: 24,388 FTEs
Indirect impact: 18,592 FTEs
Induced impact: 11,694 FTEs
Source: Statistics Canada, custom tabulation, Industry Accounts Division, reference year 2018
3.1.3 Trade
Exports to 85 different countries and dependencies
IMC members imported $13.2 billion worth of goods. $3.7 billion came from the United States, with Germany ($1.8 billion) and Switzerland ($1.7 billion) rounding out the top three.
The United States ($1.2 billion) was the primary destination of most of IMC members’ $1.7 billion worth of goods exports. In total, IMC members sold goods to 85 foreign countries and dependencies. Virtually all sales were of pharmaceutical products ($1.5 billion).
3.2 Research and development
3.2.1 Total R&D expenditures
As noted above, Statistics Canada generally reports in-house and outsourced R&D as separate values, as there exists a potential for double counting outsourced R&D performed in Canada when adding the two values together. Given this limitation, it can be estimated that IMC members performed between $0.8 and $1.2 billion of total R&D during 2018.
3.2.2 In-house R&D expenditures
IMC members had higher in-house research and development expenditures per employee
IMC members spent $623 million on in-house R&D in 2018, making up 60% of the sector’s total and 3.2% of all in-house R&D performed in Canada. Most expenditures were in Ontario ($315 million) and Quebec ($243 million).
This R&D work was carried out by 3,342 FTE R&D personnel. In-house expenditures per FTE personnel were higher among IMC members ($186,000) than the sector as a whole ($168,000).
IMC members focused more on research than development
Statistics Canada makes a strong distinction between the concepts of research and development. Research comprises work undertaken to acquire new knowledge (basic research) or to investigate a specific practical aim (applied research). Development, on the other hand, refers to work directed to produce or improve existing products or processes.
IMC members focused more on performing research than development. Approximately 70% of their in-house R&D expenditures were applied toward research, while the rest of the sector spent a similar share on experimental development instead.

Data table for Figure 12
R&D pharmaceutical sector
Research: 53.8%
Experimental development: 46.2%
IMC members
Research: 70.2%
Experimental development: 29.8%
Rest of sector
Research: 28.7%
Experimental development: 71.3%
Source: Statistics Canada, custom tabulation, Survey of Research and Development in Canadian Industry, reference year 2018
3.2.3 Outsourced R&D expenditures
Canadian hospitals and universities major recipients of outsourced research and development
In addition to their in-house expenditures, IMC members outsourced a total of $538 million of R&D, or 11.5% of total outsourced spending by business enterprises in Canada, in 2018.
IMC Members favoured outsourcing within Canada, with domestic recipients making up two-thirds of outsourced expenditures, while the rest of the R&D pharmaceutical sector mostly outsourced abroad.
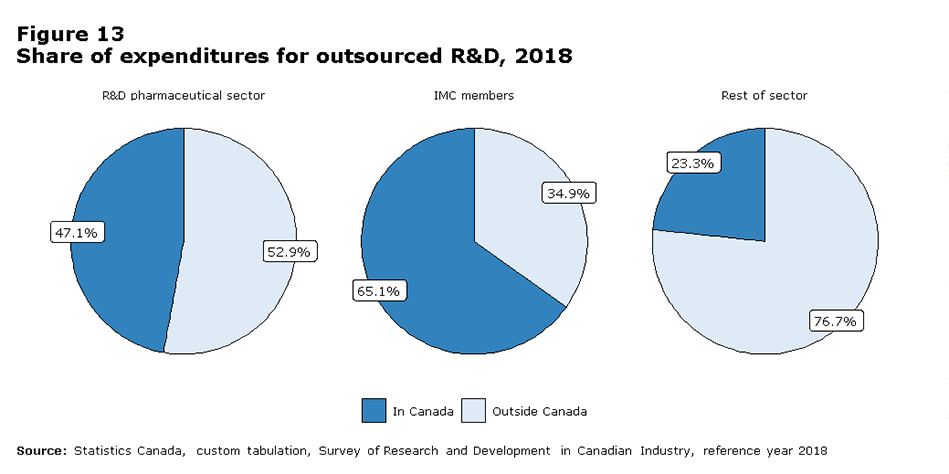
Data table for Figure 13
R&D pharmaceutical sector
In Canada: 47.1%
Outside Canada: 52.9%
IMC members
In Canada: 65.1%
Outside Canada: 34.9%
Rest of sector
In Canada: 23.3%
Outside Canada: 76.7%
Source: Statistics Canada, custom tabulation, Survey of Research and Development in Canadian Industry, reference year 2018
IMC members had significant outsourcing partnerships with Canadian hospitals and universities. 90% of the $144 million in R&D outsourced to Canadian hospitals and universities by R&D pharmaceutical companies came from IMC members.

Data table for Figure 14
Foreign recipients
IMC members: $188 M
Rest of the sector: $312 M
Canadian businesses
IMC members: $157 M
Rest of the sector: $59 M
Canadian hospitals and universities
IMC members: $132 M
Rest of the sector: $12 M
All other Canadian recipients
IMC members: $62 M
Rest of the sector: $25 M
Source: Statistics Canada, custom tabulation, Survey of Research and Development in Canadian Industry, reference year 2018
3.2.4 SR&ED eligible R&D expenditures
Members claimed majority of R&D work under the SR&ED Program
Under the SR&ED Program, IMC members claimed $360 million worth of in-house R&D work, as well as $304 million of outsourced R&D within Canada. Similar to the sector as a whole, IMC members claimed most of their outsourced R&D work conducted in Canada (86.6%), but submitted a lower share of their own in-house R&D expenditures (57.8%) for tax credit purposes. Almost all IMC members that reported conducting R&D in 2018 submitted claims for at least a portion of their in-house and outsourced R&D expenditures.
4. Limitations
This study examines the economic footprint of the research and development pharmaceutical sector within Canada in 2018 using a wide variety of data, including value added, employment, research and development activities, financial statistics and international trade.
Although comprehensive, the study was not able to incorporate in-depth employment characteristics related to the sector’s workforce. This could potentially be an area of interest in a future study. Incorporating an historical perspective would also provide insight into the sector which has taken on a greater profile in Canadian society given the impact of the novel coronavirus, which was first detected in Canada in early 2020. Estimation may be required for those businesses that do not have full historical information collected through key surveys.
In addition, it should be noted that the sectoral name used throughout this report to describe the cohort of companies examined in this study, the “research and development pharmaceutical sector”, is not an official name found in the North American Industry Classification System. Though it reflects the principal activities of the selected businesses, it may not be representative of the entire suite of activities of each business in 2018. The name was chosen based on the businesses’ reported R&D activities and their inclusion in the pharmaceutical-related NAICS identified in this study.
The data in this study are deemed to be of high quality; however, the success of any future study requires the continued active participation of companies in the sector to surveys administered by Statistics Canada.
5. Appendix
5.1 Glossary
Applied research is original investigation undertaken in order to acquire new knowledge. It is, however, directed primarily towards a specific, practical aim or objective. See also basic research; experimental development.
Basic research is experimental or theoretical work undertaken primarily to acquire new knowledge of the underlying foundations of phenomena and observable facts, without any particular application or use in view. See also applied research; experimental development.
Business Enterprise Research and Development (BERD) is all research and development performed in Canada by the business enterprise sector, as measured by the Annual Survey of Research and Development in Canadian Industry performed by Statistics Canada.
Capital R&D expenditures are the annual gross amount paid for the acquisition of fixed assets that are used repeatedly or continuously in the performance of R&D for more than one year. They should be reported in full for the period when they took place, whether acquired or developed in house, and should not be registered as an element of depreciation.
Country of control is the country of residence of the ultimate controlling parent corporation, family, trust, estate or related group. Each subsidiary within the global enterprise is assigned the same country of control as its parent. Country of control data are derived from ownership questionnaires filed annually with Statistics Canada by corporations subject to the Corporations Returns Act, and from information obtained from the Canada Revenue Agency's administrative records.
Current R&D expenditures are composed of labour costs and other current costs (including for external R&D personnel) used in R&D. Services and items (including equipment) used and consumed within one year are current expenditures. Annual fees or rents for the use of fixed assets should be included in current expenditures, as should overhead costs associated with research and development. See also other current costs.
Direct impacts are the effects directly attributed to an industry’s production. See also indirect impact; induced impact.
An economic footprint study aims to measure the total economic impact (direct, indirect, or induced) of an organization, sector or industry on a specific country or region during a given period. Economic impacts typically considered include gross value added and employment data. See also direct impact; indirect impact; induced impact.
Employees are all persons who work in or for the reporting unit, who have a contract of employment with the unit and who receive compensation in cash or in kind at regular intervals of time.
Experimental development is systematic work, drawing on knowledge gained from research and practical experience and producing additional knowledge, which is directed to producing new products or processes or to improving existing products or processes. See also applied research; basic research.
Exports are goods produced or manufactured in Canada that are subtracted from the stock of material resources in Canada, as a result of their movement out of the country.
Foreign controlled companies – see country of control.
Full-time equivalent (FTE) is the total hours worked divided by average annual hours worked in full-time jobs.
Full-time equivalent (FTE) R&D personnel is defined as the ratio of working hours actually spent on R&D during a specific reference period (usually a calendar year) divided by the total number of hours conventionally worked in the same period by an individual or by a group.
Gross Domestic Product (GDP) is the total unduplicated value of the goods and services produced in the economic territory of a country or region during a given period. See also value added.
Imports are goods that have entered the country by crossing territorial (customs) boundaries, whether for immediate domestic consumption or for storage in customs warehouses. Re-imports are included in Canadian trade data. These are goods, materials or articles that are imported in either the same condition in which they were exported or after undergoing repair or minor alterations (e.g., blending, packaging, bottling, cleaning or sorting) that leave them essentially unchanged. Domestic re-imports are goods of Canadian origin, whether grown, extracted, or manufactured in Canada that are exported to another country and then returned to Canada in 'the same state' as they were sent out. See also exports.
Indirect impacts are upstream economic activities associated with supplying intermediate inputs (the current expenditures on goods and services used up in the production process) to the directly impacted industries. See also direct impact; induced impact.
Induced impacts are additional economic activities derived from the labour income generated by both the direct and indirect effects when spent in the market place. See also direct impact; indirect impact.
An industry is a group of establishments engaged in the same, or similar, kinds of economic activity. See also North American Industry Classification System (NAICS); sector.
In-house R&D is expenditures within Canada for R&D performed within this business by employees or self-employed individuals or contractors who are working on-site on a business's R&D projects.
North American Industry Classification System (NAICS) is a business-classification system developed through a partnership among the United States, Mexico and Canada. Companies are classified by their same or similar production processes. NAICS Canada 2017 Version 3.0 divides the Canadian economy into 20 sectors, 102 subsectors, 324 industry groups, 710 industries and 928 Canadian industries. See also sector; industry.
Other current costs are non-capital purchases of materials, supplies, equipment and services to support R&D performed by the reporting unit in the reference year. Examples are water and fuel (including gas and electricity); books, journals, reference materials, subscriptions to libraries, scientific societies, etc.; imputed or actual costs of small prototypes or models made outside the reporting unit; and materials for laboratories (e.g., chemicals, animals, etc.). Other current costs include royalties or licences for the use of patents and other intellectual property rights, the lease of capital goods (machinery and equipment, etc.) and the rental of buildings to support R&D performed by the reporting unit in the reference year. Overhead costs associated with R&D are also included in other current costs. See also current R&D expenditures.
Outsourced R&D are payments made within or outside Canada to other businesses, organizations or individuals to fund R&D performance through grants, fellowships, or contracts.
R&D personnel are all persons engaged directly in R&D, whether employed by the reporting unit or external contributors fully integrated into the reporting unit’s R&D activities, as well as those providing direct services for the R&D activities (such as R&D managers, administrators, technicians and clerical staff).
The reporting unit is the unit from which data are reported. This corresponds to the unit that would receive a questionnaire or interview. In the case of administrative data, it would correspond to the unit that is represented by the individual record.
Research and development (R&D) is creative and systematic work undertaken in order to increase the stock of knowledge – including knowledge of humankind, culture and society – and to devise new applications of available knowledge. See also applied research; basic research; experimental development.
Research and Development in Canadian Industry (RDCI) is an annual survey that collects R&D expenditures and personnel data used to monitor science and technology related activities of business and industrial non-profit organizations in Canada.
Researchers are professionals engaged in the conception or creation of new knowledge. They conduct research and improve or develop concepts, theories, models, techniques instrumentation, software or operational methods.
The Scientific Research and Experimental Development (SR&ED) Program is a tax incentive program intended to encourage Canadian businesses of all sizes and in all sectors to conduct research and development in Canada.
A sector is a high level section of the economy encompassing economic activity in several related industry groups. See also industry; North American Industry Classification System (NAICS).
Value added is a measure of the contribution a sector makes to Canada’s economic output as measured by the gross domestic product (GDP). See also gross domestic product (GDP).
5.2 Populations
Innovative Medicines Canada (IMC) provided two cohort lists to Statistics Canada. The first was a list of its members. The second was a list of peer companies, comprising those in the pharmaceutical space that were actively involved in developing new medicines and treatments. It excluded generic pharmaceutical manufacturers, wholesalers without R&D in Canada, pure medical device manufacturers and businesses primarily involved in veterinary medicines. Statistics Canada supplemented the peer list with companies whose R&D was primarily focused on human medicine and health sciences. Data in the report comprised estimates for the R&D pharmaceutical sector (both IMC members and the peer group) and IMC members only.
5.3 Business structures
Statistics Canada collects a wide variety of business data through multiple surveys and integrated tax data modelling. The level of the entity surveyed depends on the nature of the data being sought. For simple businesses, there is no practical difference between the levels. For complex businesses that comprise multiple locations and activities, different types of information are produced within the business at different levels. Surveys are targeted to match the content of the survey with the level of the business which can best provide the information being sought.
Here is an example illustration of a complex business (ABC Inc.) and a simple business (XYZ Corp.).

Data table for Figure 15
Complex and simple business structures
Complex structure: Enterprise ABC Inc. breaks down into two companies, AB corp. and C Co. AB Corp has two establishments under it, A Ltd. and B Ltd. C Co. is the same at the establishment level.
Simple structure: XYZ Corp. is an enterprise, company and establishment.
The data used throughout this study were compiled from various program areas within Statistics Canada. The cohort lists provided to Statistics Canada were at the company level. Statistics Canada linked entities at the company level to those at the establishment and enterprise levels, depending on the suitable conceptual level for the data.
Data on gross value added and employment, as well as their associated impacts – direct, indirect and induced – were processed at the establishment level, the most granular level at which accounting data required to measure production is available.
Tax data are processed by Canada Revenue Agency at the business number or company level. R&D data are collected at the same level as tax data to reduce response burden by enabling reporting units to use the same accounting level used for reporting Scientific Research and Experimental Development tax credit claims.
Trade and financial data are collected at the highest level within the business operations in Canada at the enterprise level. This is the level at which businesses keep these types of records.
Where a complex enterprise has a company which is part of the R&D pharmaceutical sector and another company which is not, both companies were included so that the entire enterprise structure is covered by each of the data extractions.
5.4 Methods
Where microdata were provided, analysts undertook a data review to confirm the suitability of the data for use in this report. As a result, one tax-modelled record was manually adjusted for R&D estimates and one enterprise record was modified to include only business activities in Canada.
The R&D data were comprised primarily of actual respondent data. Where companies did not respond to the the reference year (RY) 2018 survey, data were imputed using historical values and SR&ED tax data.
5.4.1 Economic impacts
The direct economic impacts of the Canadian R&D pharmaceutical sector were measured on the basis of the industry’s outputs and gross value added. Outputs include the measurement of goods and services produced by an establishment. Gross value added measures the value of output less the value of intermediate consumption, which consists of all goods and services used up in the course of production within an accounting period.
The calculation of the economic impacts were derived using the 2018 tax data associated with the companies and enterprises identified as members of Innovative Medicine Canada, as well as the overall sector. This information was entered into the Statistics Canada Interprovincial Input-Output Model (Statistics Canada service 36-23-0002) which provided estimates for the other direct impact metrics such as labour income, jobs and FTEs, as well as the indirect and induced economic impact for all variables.
The Statistics Canada Interprovincial Input-Output Model is derived from the Supply and Use Tables (Statistics Canada catalogue 15-602-X). The model is updated every year to coincide with the most recent version of the Supply and Use Tables. The Input-Output model used in the economic impact study is based on the 2017 version of the Supply and Use tables, which were released on November 9, 2020.
The impact estimates provided by the model for output, gross value added and labour income are derived from information included in the Supply and Use Tables. The impact estimates provided by the model for jobs and FTEs are derived from the labour productivity and related measures by business sector industry and by non-commercial activity consistent with the industry accounts (Statistics Canada table 36-10-0480-01).
- Date modified: