
Analysis in Brief
Wastewater-based Estimates of Cannabis and Drug Use in Canada: Pilot test Detailed Results
by Tim Werschler and Andrew Brennan
Acknowledgements
This pilot study would not have been possible without the collaboration and professionalism of the municipal wastewater staff in the pilot cities, and the dedication and expert support provided by the Yargeau Laboratory of McGill University’s Department of Chemical Engineering. This collaboration has resulted in new insights into the potential of wastewater as a data-source.
Introduction
Over the past two years, Statistics Canada has been working to update its statistical programs to better capture the social and economic impacts related to the legalization of cannabis, which took place on October 17, 2018, and to the misuse of opioids and other drugs with higher risk of being abused. Accurate measures of total societal use of cannabis and misused drugs are difficult to obtain. The stigma associated with use and reluctance to disclose purchases from non-regulated suppliers are two factors that could contribute to some under-reporting on surveys. To support the survey-based data, Statistics Canada is exploring the use of a technique called wastewater-based epidemiology (WBE), which has been used in Europe since 2007 to report on the consumption of different types of drugs in large cities (European Monitoring Centre for Drugs and Drug Addiction, 2016).
In March 2018, the agency implemented a pilot project to collect and test municipal wastewater samples for traces of cannabis, and a dozen other drugs to examine if the resulting data could be used to make estimates of the extent of drug use in different cities across Canada and change in use over time. The pilot test is the largest ever conducted in North America in terms of population covered. The advantages of this technique include its low cost, timeliness, the ability to monitor change over time at the city level, and importantly, the potential to determine the total amount of a drug consumed, whether legally or illegally acquired. One limitation of this approach is that it does not provide information on the number or characteristics of individuals who consumed or how the drugs were consumed, but Statistics Canada uses other surveys to help determine these more detailed data.
The pilot project covered 14 wastewater treatment plants in five large urban centres across the country, and serving close to 8.4 million people, which is over 20% of the Canadian population (Table 1). Wastewater from each site was sampled at least every 30 minutes for seven consecutive days starting on the second Monday of each month, from March 2018 to February 2019.
| Test Site | Wastewater Treatment Plants | 2018 Population (millions of people) |
|---|---|---|
| Central Halifax | 3 | 0.2 |
| Montreal Island | 1 | 2.0 |
| Toronto City | 4 | 2.8 |
| Edmonton City | 1 | 1.0 |
| Vancouver metro area | 5 | 2.5 |
| Total | 14 | 8.4 |
| Source: Statistics Canada 2019 | ||
The wastewater samples were analyzed by McGill University, whose wastewater drug analysis methods met the technical standards of the Sewage Analysis CORe group Europe (SCORE). Samples were analyzed for concentrations of the following drugs:
| Drug Class | Target Drugs |
|---|---|
| Narcotics | Cannabis (THC-COOH) |
| Opioids | Acetylcodeine, Acetylmorphine, Codeine, Fentanyl, Heroin, Morphine, Oxycodone |
| Stimulants | Amphetamine, Benzoylecgonine, Cocaine, Ecstasy (MDMA), Methamphetamine |
The results presented include only drug metabolites that could be reliably detected in wastewater during the test period.
Interpretation of Results and Limitations
The wastewater pilot test was designed to gain understanding of the operational and technical challenges involved in using municipal wastewater as an anonymous data source for societal use of specified drugs, and to collect samples of wastewater in a few cities in order to establish a reference point for cannabis before legalization. Within this context, it is important to note the following limitations of the pilot-test results:
- Even though the pilot cities cover over eight million people, the study was not designed to be representative of the whole population of Canada. Caution should be taken in applying these results to any other city or province in Canada.
- The population coverage of each pilot site varies relative to the size of its metropolitan area. The Vancouver site had nearly complete coverage of the entire metropolitan area, whereas the Halifax site covered about 50% of the metropolitan population. These factors need to be considered when discussing applicability at the city level.
- Small differences in measured drug loads between cities may be influenced by factors such as the travel-time in the sewer system, biological conditions in the sewers, leaks, or chemicals introduced from commercial / industrial activities. As a result, only large differences between cities are identified and discussed at this time.
- The measured load of a drug metabolite in wastewater is not directly comparable to other drugs because the same mass of drug could have very different effects on the body (e.g. 0.5g of cannabis is very different from 0.5g of methamphetamine). The human body also processes and excretes each drug differently.
- For some drugs, there was a significant change in measured loads in some months, suggestive of a seasonal pattern. As the pilot test was conducted for only 12 months, more data are needed to determine if the observed variation is repeated.
- Sampling occurred during the entire second week of each month, and the results were used to represent the entire month. Preliminary tests suggest this assumption has some validity, but this assumption should be more thoroughly validated.
For additional details on study design and other limitations of the results, refer to Statistics Canada Publication 13-605-X201900100006, 2019, and Subedi, B. et al., 2019. Refer to the accompanying supplementary information for details on the data analysis and parameter values used here (Statistics Canada Publication 13-605-X201900100011, 2019).
Results for Cannabis
When cannabis is consumed (whether by smoking, eating, applying to skin, etc.), the body converts the main psychoactive compound, tetrahydrocannabinol (THC), into a variety of related non-psychoactive compounds, the most common and stable of which is 11-nor-9-carboxy-THC (THC-COOH). Less than 1% of the mass of cannabis consumed is ultimately excreted as THC-COOH into the wastewater. Since THC-COOH is only created in the body after cannabis consumption, THC-COOH in the wastewater indicates cannabis consumption within the service area.
The load of THC-COOH (grams per week) flowing through a sewer system was estimated at the 14 wastewater treatment plants located across the study sites. Chart 1 provides the estimated load per capita (grams per million people per week) by month for all sites combined (covering 8.4 million people).

Data table for Chart 1
| THC-COOH | |
|---|---|
| load per capita [grams per 1 million people per week] | |
| 2018 | |
| March | 424 |
| April | 271 |
| May | 1431 |
| June | 833 |
| July | 107 |
| August | 182 |
| September | 216 |
| October | 282 |
| November | 371 |
| December | 867 |
| 2019 | |
| January | 186 |
| February | 184 |
| Source: Statistics Canada, 2019. | |
The average load of THC-COOH found in wastewater for all sites combined was 450 grams per million people per week. However, large spikes occurred in May, June, and December 2018. It is uncertain whether these spikes are due to variations in wastewater flow rates, short-term changes in number of people consuming, the amount consumed, or factors related to the sampling. Pilot test results from the large sites showed weak or inconsistent relationship between flow rate and estimated load for a given drug, and in consistency of behavior of different drugs in the same site. This helps to rule-out systematic impact. It is still likely that there are sampling effects in the results owing to the highly variable wastewater flow and composition dynamics, but they are complex.
One objective of this study was to establish a baseline measure of THC-COOH in wastewater pre-legalization for purposes of historical reference. With eight months of data pre-legalization covering approximately 20% of Canada’s population, this has been achieved. However, given the monthly variability of the data, it is too early to determine if there has been a change in total cannabis consumption since October 2018, when recreational cannabis was legalized.
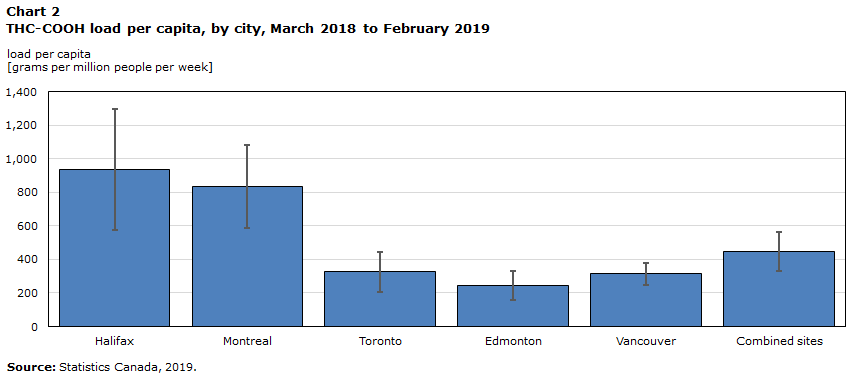
Chart 2 compares THC-COOH load across the pilot cities. The vertical bars represent the uncertainty in the 12-month average based on the variability in the data. The cities had large differences that repeated consistently over the months. Montreal and Halifax reported loads 2.5-3.8 times higher than Vancouver, Toronto, and Edmonton. These results demonstrate that consumption can be markedly different across the country.
Data table for Chart 2
| City | Average | Lower limit | Upper limit |
|---|---|---|---|
| load per capita [grams per 1 million people per week] | |||
| Halifax | 936 | 574 | 1297 |
| Montreal | 833 | 586 | 1080 |
| Toronto | 327 | 208 | 445 |
| Edmonton | 244 | 159 | 330 |
| Vancouver | 313 | 246 | 380 |
| Combined sites | 446 | 332 | 561 |
| Source: Statistics Canada, 2019. | |||
Statistics Canada’s quarterly National Cannabis Survey (NCS) indicates that percentage of self-reported users is higher than average in Nova Scotia, but lower than average in Quebec (Statistics Canada, National Cannabis Survey, 2019). The latter result seems at first to be contrary to what is seen in the Montreal wastewater, but it is possible that the consumption per user could be greater, and it was more difficult in the NCS to measure the self-reported mass of cannabis consumption. It is also possible that cannabis use in Montreal is measurably higher than for the rest of Quebec.
Results for Cocaine
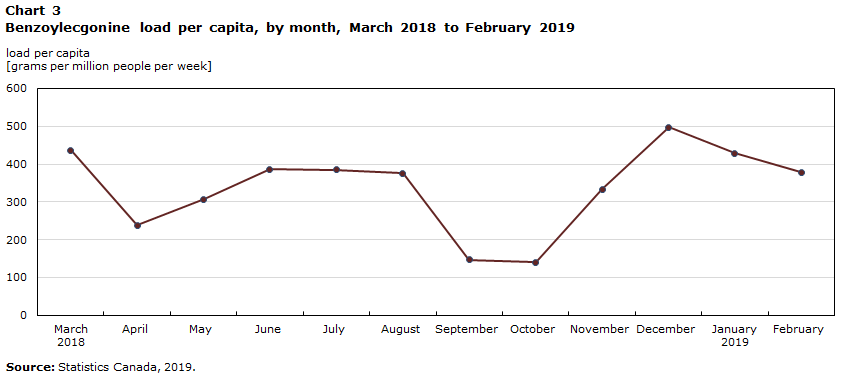
Cocaine is illegal in Canada. When a person consumes cocaine, the body converts a portion of it to benzoylecgonine, a compound that is quite stable in wastewater. Chart 3 shows the combined load of benzoylecgonine detected in the 14 wastewater treatment plants by month. The monthly loads were more stable than for the cannabis metabolite, averaging 340 grams per million people per week. The wastewater data suggest slightly higher cocaine consumption in the summer months, followed by a drop in early fall, and then an increase in winter. More data will be needed to determine if this is a regular pattern.
Data table for Chart 3
| Benzoylecgonine | |
|---|---|
| load per capita [grams per 1 million people per week] | |
| 2018 | |
| March | 437 |
| April | 239 |
| May | 307 |
| June | 386 |
| July | 385 |
| August | 376 |
| September | 148 |
| October | 140 |
| November | 333 |
| December | 497 |
| 2019 | |
| January | 429 |
| February | 378 |
| Source: Statistics Canada, 2019. | |
In contrast to THC-COOH, no significant differences between cities were apparent for benzoylecgonine
(Chart 4).

Data table for Chart 4
| City | Average | Lower limit | Upper limit |
|---|---|---|---|
| load per capita [grams per 1 million people per week] | |||
| Halifax | 385 | 316 | 453 |
| Montreal | 296 | 235 | 358 |
| Toronto | 309 | 269 | 349 |
| Edmonton | 268 | 228 | 308 |
| Vancouver | 425 | 378 | 472 |
| Combined sites | 338 | 306 | 370 |
| Source: Statistics Canada, 2019. | |||
Results for Methamphetamine
Like cocaine, methamphetamine is a stimulant and its sale in Canada is illegal. A large portion of this drug passes through the body unchanged, so its concentration in wastewater is used as a direct indicator of consumption within a population. A small number of other prescribed drugs are also metabolized into methamphetamine in the body, so their consumption would also result in methamphetamine in the wastewater. These drugs include Selegiline, Benzphetamine, and Famprofazone (Khan and Nicell, 2012). However, based on medication sales data provided by Health Canada, these drugs are expected to be responsible for less than 5% of the methamphetamine in the wastewater, and are thus considered negligible.
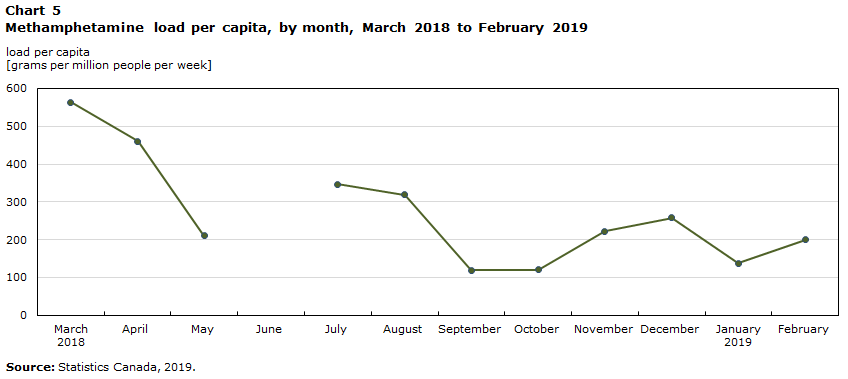
The combined methamphetamine load of the pilot sites averaged 270 grams per million people per week during the 12-month period, with no apparent seasonal variation (Chart 5). In June, however, an extremely large spike in methamphetamine levels (averaging 4200 grams per million people per week across all cities) was reported for all sites except Vancouver. The June data have been removed from the estimates. Such a large spike could result from a dumping event, since unconsumed methamphetamine is indistinguishable from excreted methamphetamine in the wastewater, or it could reflect sampling or processing anomalies in the pilot test.
Data table for Chart 5
| Methamphetamine | |
|---|---|
| load per capita [grams per 1 million people per week] | |
| 2018 | |
| March | 564 |
| April | 461 |
| May | 210 |
| June | Note ..: not available for a specific reference period |
| July | 347 |
| August | 319 |
| September | 120 |
| October | 120 |
| November | 222 |
| December | 258 |
| 2019 | |
| January | 137 |
| February | 200 |
|
.. not available for a specific reference period Source: Statistics Canada, 2019. |
|
Chart 6 reveals substantial variation in methamphetamine loads per capita across the pilot cities. Average levels for Edmonton and Vancouver were over 3.7 times higher than those in Montreal and Toronto. Recall that while Montreal reported high levels of cannabis metabolite, it had comparatively low levels for methamphetamine, suggesting that even large cities within the same country can have distinct drug-use profiles.

Data table for Chart 6
| City | Average | Lower limit | Upper limit |
|---|---|---|---|
| load per capita [grams per 1 million people per week] | |||
| Halifax | 14 | 13 | 16 |
| Montreal | 132 | 114 | 150 |
| Toronto | 93 | 67 | 120 |
| Edmonton | 534 | 340 | 728 |
| Vancouver | 490 | 352 | 629 |
| Combined sites | 269 | 226 | 312 |
| Source: Statistics Canada, 2019. | |||
However, methamphetamine levels in Halifax were very low, over 6 times lower than even Toronto, the next-lowest city. The recorded levels are well-below the observed variation in the other cities, and for other drugs. These findings should be compared with other data, such as from the justice sector, public health, vital statistics or health administrative data to help validate them.
Results for Opioids
Opioids are a family of compounds that include prescribed medications like fentanyl, oxycodone, morphine, codeine, and tramadol, but also some illicit drugs, such as heroin. According to the Canadian Institute for Health Information, Canada is the second-largest consumer of opioids per person in the world, behind the United States (CIHI, 2017: 6). Opioids are used within the healthcare system primarily for pain management, however, prescription opioid-related harms and non-medical use have been on the rise since 1999, leading to a growing crisis in Canada (Belzak & Halverson, 2018). One of the reasons for conducting the wastewater pilot test was to determine whether such drugs are detectable in municipal wastewater, and if so, whether the concentrations can be used to produce estimates of total consumption.
The research conducted for this pilot indicates that there are several obstacles to achieving this goal. First, many of these drugs degrade rapidly in wastewater, making them difficult to measure. Second, many of the opioids transform into the same compound, morphine, which is stable and measurable, but it then becomes difficult to determine what proportion of the morphine comes from which opioid. Third, for drugs that are legally dispensed through the healthcare system, methods are needed to estimate the proportion of the wastewater signal that should result from their use in order to estimate the component that can be attributed to non-prescribed use. This approach was taken in a recent study in Lausanne, Switzerland, with promising results (Been et al., 2015).
The pilot test results provide high-quality wastewater signals for two common opioids, codeine and morphine. It is important to note that codeine and heroin also partially transform into morphine, thus contributing to morphine’s wastewater signal. Codeine levels averaged 320 grams per million people per week, with lower levels in late summer and peaks in March and December. Morphine levels were stable across months, averaging 100 grams per million people per week.
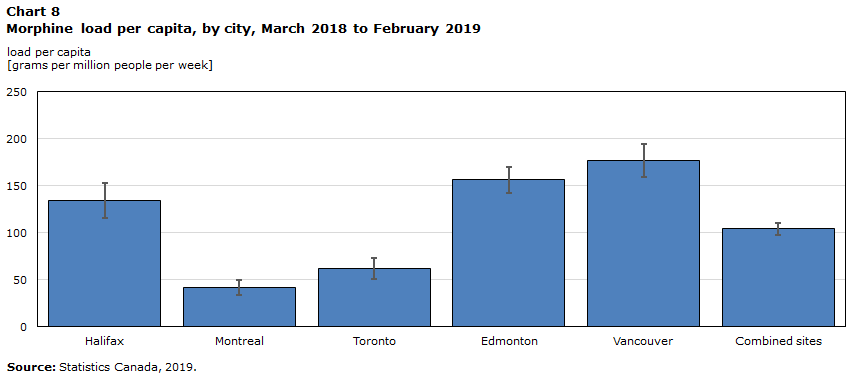
Chart 7 indicates measured codeine loads by city. Wastewater codeine levels in Edmonton were 2.5 times higher than the across-city average and 75% higher than the next-highest city, while Montreal was 6 times lower than average and 5 times lower than the next-lowest city. Chart 8 shows the average morphine loads by city. Morphine was 2-4 times lower in Montreal and Toronto compared with Vancouver, Edmonton, and Halifax.

Data table for Chart 7
| City | Average | Lower limit | Upper limit |
|---|---|---|---|
| load per capita [grams per 1 million people per week] | |||
| Halifax | 473 | 392 | 554 |
| Montreal | 53 | 39 | 68 |
| Toronto | 285 | 232 | 337 |
| Edmonton | 830 | 706 | 953 |
| Vancouver | 369 | 317 | 421 |
| Combined sites | 322 | 283 | 362 |
| Source: Statistics Canada, 2019. | |||
Data table for Chart 8
| City | Average | Lower limit | Upper limit |
|---|---|---|---|
| load per capita [grams per 1 million people per week] | |||
| Halifax | 134 | 115 | 153 |
| Montreal | 41 | 33 | 50 |
| Toronto | 62 | 50 | 73 |
| Edmonton | 156 | 143 | 170 |
| Vancouver | 177 | 159 | 194 |
| Combined sites | 104 | 97 | 110 |
| Source: Statistics Canada, 2019. | |||
If codeine and morphine are widely prescribed within the healthcare system, then their use should be relatively stable over time and space, assuming similar population characteristics and medical practice. However, recent reports on the use of opioids within the healthcare system reveal that per person spending on opioids does vary to an extent across the country. Per person spending is about 20% higher than the national average in Alberta and Ontario and 34% below average in Quebec (Morgan et al. 2013).
The wastewater codeine differences detected between cities are not well-explained by the provincial differences in healthcare opioid spending. Edmonton reported wastewater codeine levels much higher than the 20% expected from healthcare spending in Alberta, while Montreal is even lower than expected from provincial healthcare spending. The above-average spending in Ontario is not reflected in Toronto.
Similarly, inter-city differences in morphine loads are not well-explained by the provincial differences in healthcare opioid spending. Within Alberta and Ontario, where spending is marginally above average, Edmonton has high morphine in the wastewater while Toronto has low morphine. The low spending in Quebec agrees with the low morphine detected in Montreal wastewater, but the average spending in British Columbia does not explain the high morphine detected in Vancouver wastewater. The relatively high morphine loads observed in Vancouver, Edmonton, and to a lesser extent in Halifax may thus indicate some level of non-prescribed opioid use.
Wastewater-based Estimates of Total Cannabis and Other Drug Use
Until recently, the major sources of input to estimates of total societal drug use came from survey respondents and data on drug-related hospital admissions and crime statistics. These sources, among others, have been used by various governmental organizations to produce estimates of total cannabis consumption. Canada’s Parliamentary Budget Office (PBO) produced an estimate of 665 tonnes of cannabis consumed in 2018 (Office of the Parliamentary Budget Officer, 2016), and Statistics Canada’s most recent estimate was 773 tonnes in 2017 (Statistics Canada Publication, 2017). With cannabis legalization, reported sales for cannabis producers, wholesalers, and retailers for Canada are becoming available. Retail sales (non-medical cannabis) for the period November 2018 – March 2019 suggest a 12-month total of 66.8 tonnes of dried product at current retail prices (Statistics Canada Table 20-10-0008-01, and 2019-Q1 Cannabis prices, 2019). If these estimates are reasonable, they suggest that retail sales comprise 9-10% of total consumption at the national level. How does this compare to the wastewater-based estimates?
The wastewater-based approach to estimating total drug consumption requires several parameters to be defined. For this research, Statistics Canada developed a modelling approach that takes into consideration the uncertainty around each of the main parameters (Statistics Canada Publication 13-605-X201900100011, 2019). Table 2 provides the first-ever estimates of the total mass of cannabis and selected drugs used across the pilot cities as reported by wastewater analysis.
| Annual consumption in tonnes | Confidence LimitsNote * | ||
|---|---|---|---|
| Estimate | Low | High | |
| Cannabis (dried) | 84 | 27 | 268 |
| Cocaine | 0.37 | 0.27 | 0.54 |
| Methamphetamine | 0.31 | 0.19 | 0.56 |
|
|||
Total annual cannabis consumption is estimated at 84 tonnes of dried product within the pilot area, but the precision of the estimate comes with considerable uncertainty due primarily to the wide range of estimates in how much THC-COOH ends up in wastewater after consumption. The value of 84 tonnes implies that consumption in the pilot cities represents about 13% of the national total, as estimated by the PBO. Given that the pilot sites comprise over 22% of the national population, this would mean that the consumption rate across the pilot sites was approximately 50% lower than that for the rest of the country. This is unlikely, but using these data alone, it is impossible to determine the error in each component.
If per capita consumption is assumed to be the same in the pilot cities as in the rest of the country, then the wastewater results would correspond to national cannabis consumption of about 370 tonnes, which 44% lower than the PBO estimate. Further, the annualized non-medical cannabis retail sales estimate of 66.8 tonnes would then represent 18% of all consumption, a proportion two times higher than if the PBO estimate were used. This value is considered unrealistically high, especially given constraints in the roll-out of cannabis retail locations in the early months following legalization, particularly in the populous provinces of Ontario and Quebec.
Such discrepancies call into question some of the modelling inputs used in this research, the single most important one being how much THC-COOH is produced in human urine and feces by consuming one unit of THC. Indeed, given the confidence limits presented in Table 2, real consumption within the pilot-area could easily be 2 times higher, putting national consumption at par with the 2017 Statistics Canada estimate. The results obtained here demonstrate that further refinement of the wastewater model inputs may make it possible to use this technique to produce independent and sufficiently accurate estimates of total cannabis use at the societal level.
Turning to cocaine and methamphetamine, the study demonstrates that reasonably precise estimates of the total use can be produced, even at the city level. This is primarily because more research has been conducted on how the human body processes and disposes of these compounds. This is the first time such estimates have been produced using a consistent measurement technique across several cities. Total consumption is estimated at 370 kg for cocaine and at 310 kg for methamphetamine. For both of these substances, an estimate of the total economic value of their consumption could be derived if an estimate of price per gram were available.
Conclusions
The pilot-test results have provided new perspectives on drug use across several large urban centers in Canada, and provided many instructive lessons on the potential value of wastewater sampling as a data source. In terms of drug use, the pilot test revealed the potential for seasonal variability in the use of some drugs, including cannabis, cocaine, and codeine. Clear differences also emerged in the drug profiles of the different pilot-test cities. Cannabis use was higher in Montreal and Halifax, but Vancouver and Edmonton tended to have higher per person use of methamphetamine, morphine, and codeine. Methamphetamine levels were extremely low in Halifax, an interesting anomaly that should be further explored.
With respect to wastewater sampling as a technique, the pilot test demonstrated that a) it shows potential as a data source to measure total use of some drugs at the city level, b) it could be used, along with other data sources, to estimate total use of illicit drugs, c) it can be scaled to cover large urban centres using existing wastewater treatment facilities, d) it could address under-reporting in use of illegal drugs such as cocaine and methamphetamine, and e) it may be well-suited to measure relative changes in drug load over time, allowing for a kind of early warning system.
But challenges remain. Producing representative wastewater samples is difficult given significant variation in daily, or sometimes even hourly wastewater flows Planned legalization of cannabis edibles in late 2019 will add further complexity to the task of estimating cannabis consumption using the wastewater technique because edibles are expected to have different excretion rates. Given a range of different products, THC concentrations, and methods of consuming them, it becomes even more important that well-designed laboratory studies be conducted to establish the estimated proportion of target drug that can be detected in wastewater as a result of each method of consumption. Perhaps more importantly, the same challenge exists for opioids in general. Data are needed on the total mass of prescribed opioids by province or territory, and ideally for metropolitan areas. This will make it possible to estimate the proportion of the wastewater morphine signal likely due to non-prescribed use.
Statistics Canada is reviewing the findings of this pilot test together with other experts in this field to determine whether and how to improve the wastewater sampling technique so that it can provide needed inputs to national statistical programs in Canada, and abroad.
References
Been, F. & L. Benaglia et al. (2015). Data triangulation in the context of opioids monitoring via wastewater analyses. Drug and Alcohol Dependence 151 (2015) 203–210.
Belzak, L., & Halverson, J. (2018). The opioid crisis in Canada: a national perspective. Health promotion and chronic disease prevention in Canada: research, policy and practice, 38(6), 224–233.
Canadian Institute for Health Information (2017). Pan-Canadian Trends in the Prescribing of Opioids, 2012 to 2016. Ottawa, ON.
European Monitoring Centre for Drugs and Drug Addiction. 2016, Assessing illicit drugs in wastewater-based epidemiology, Insights 22, Publications Office of the European Union, Luxembourg.
Health Canada Office of Drug Research and Surveillance (2019). Extract of IMS Health CompuScript database on mass of selegeline prescriptions dispensed by Canadian retail pharmacies over March 2018 – February 2019.
Khan, U., & Nicell, J. A. (2012). Sewer epidemiology mass balances for assessing the illicit use of methamphetamine, amphetamine and tetrahydrocannabinol. Science of the Total Environment, 421-422, 144-162.
Morgan, S. and K. Smolina, et al. (2013). The Canadian Rx Atlas, 3rd Edition. University of British Columbia. Centre for Health Services and Policy Research. December 2013. enquire@chspr.ubc.ca
Office of the Parliamentary Budget Officer (2016). Legalized Cannabis: Fiscal Considerations. Ottawa, Canada. www.pbo-dpb.gc.ca
Statistics Canada (2019). Crowd-sourced Cannabis prices, First Quarter, 2019, as published in The Daily, 2019-04-29.
Statistics Canada Publication (2017). Volume of Cannabis Consumed in Canada. Publication 13-607-x.
Statistics Canada. Monthly Retail Trade Survey. Table 20-10-0008-01, April 2019. Unadjusted sales for Cannabis retailers (NAICS 453993).
Statistics Canada. Estimating cannabis consumption using markers in wastewater: methodological paper. Publication 13-605-X201900100006. 2019. https://www150.statcan.gc.ca/n1/en/catalogue/13-605-X201900100006
Statistics Canada (2019). National Cannabis Survey, fourth quarter 2018. The Daily.
Statistics Canada. Wastewater-based estimates of cannabis and drug use in Canada: Analytical methods and supplementary information. Publication 13-605-X201900100011. 2019. https://www150.statcan.gc.ca/n1/en/catalogue/13-605-X201900100011
Subedi, B. et al. eds. (2019). Wastewater-Based Epidemiology: Estimation of Community Consumption of Drugs and Diets. American Chemistry Society Symposium Series #1319. Canadian Pilot Test methods, early results and challenges.
- Date modified: