
Analysis in Brief
Exploring the significance of Asia’s corporate control in Canada
by Pamela Kinga Gill
Purpose
This paper aims to provide finer details on foreign corporate control in Canada, with a focus on Asia. New information is presented across five industry breakdowns: manufacturing, distributive trades, financial services, resources and mining, and a residual category which includes a composite of all remaining corporate sectors in the Canadian economy.
Methods
These findings are based on data collected by Statistics Canada via the Corporations Returns Act. Statistics Canada administers this Act and requires that all corporations in Canada above asset, revenue and/or foreign equity thresholds report ownership details on an annual frequency. The Annual Financial and Taxation Statistics in turn provide the financial measures of foreign control published in this paper.
The North American Industry Classification (NAICS) is used in identifying in which industry sector an enterprise will be classified. The appropriate NAICS is appended to an enterprise based on its principal economic activity, even if the enterprise operates across multiple industry sectors. For analysis purposes all available NAICS codes were clustered into five sectoral breakdowns to inform on new detail published in this paper.
Review of earlier findings on foreign control in Canada
Over the decade starting in 2007, foreign-controlled assets in the Canadian corporate economy grew 42.6% to reach a high of nearly two trillion dollars in 2016. In a paper published by Statistics CanadaNote 1 highlighting these findings, a key insight into the changing trends of foreign control in Canada illustrated how the share of foreign-owned assets in the Americas and Europe macro-regions fell between 2007 and 2016, while the macro-region of Asia saw its share increase.
Key findings with new detail
While foreign control from Asia has grown fast, its relative size in the Canadian economy remains small. Chart 1.1 shows the share of total foreign control in Canada across the macro-regions for the years 2007 and 2016. In 2007, enterprises controlled from Asia accounted for 7.6% of total assets under foreign control, with this figure increasing to 12.3% ten years later. The combined macro-regions of Oceania and Antarctica and its adjacent islands are the only other grouping to have increased their share over the same period. However, due to the fact that these macro-regions make up less than 2.0% of the foreign control total in Canada for 2016, they are omitted from further analysis in this paper.

Data table for Chart 1.1
| 2007 | 2016 | |
|---|---|---|
| percent | ||
| Americas | 57.5 | 54.1 |
| Europe | 34.1 | 32.0 |
| Asia | 7.6 | 12.3 |
| Oceania and Antarctica | 0.6 | 1.5 |
| Africa | 0.2 | 0.1 |
Foreign control from Asia
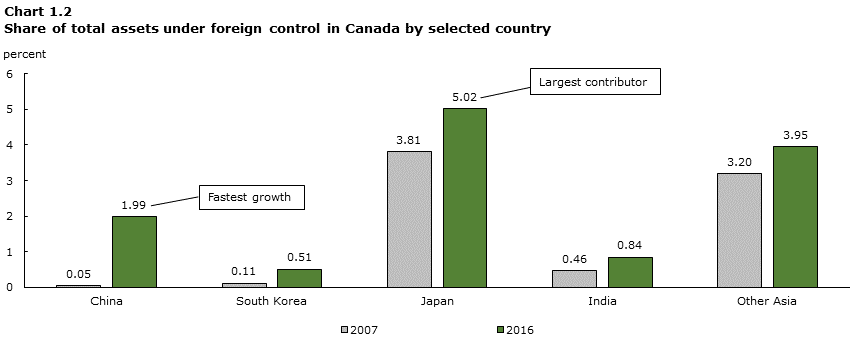
At the country level, Japanese enterprises are the largest contributor to foreign control from Asia, making up 5.0% of the total. Meanwhile, Chinese enterprises have seen their share grow the fastest to 2.0% in 2016, a jump from the previously held 0.1% in 2007. Chart 1.2 shows the share of control from Asia by select countries in the region.
The residual grouping given in Chart 1.2 labeled ‘Other Asia’ includes, amongst other jurisdictions, both Hong Kong and Macau Special Administration Region of China. For a complete list of countries included in the Asia macro-region as defined by the Standard Classification of Countries and Areas of Interest (SCCAI 2017), please refer to Appendix A.
Data table for Chart 1.2
| 2007 | 2016 | |
|---|---|---|
| percent | ||
| ChinaData table Note 1 | 0.05 | 1.99 |
| South Korea | 0.11 | 0.51 |
| JapanData table Note 2 | 3.81 | 5.02 |
| India | 0.46 | 0.84 |
| Other Asia | 3.20 | 3.95 |
|
||
This paper expands the findings on foreign control in Canada by providing new detail on the distribution and volume of corporate control activity, with a focus on Asia. Data tables showing these new statistics for the macro-regions of Asia, Europe, and the Americas for 2009 and 2016 are provided in Appendix B. These time periods were chosen in order to maximize available data while respecting confidentiality guidelines.
Chart 1.3 shows Asia’s control of Canadian corporations across the five industry groups for 2009 and 2016. This chart highlights the concentration of control in Canada’s resources and mining sector, which represents 35.5% of total assets from the region in 2016, an increase from the previously held 27.2% in 2009. The financial services sector is the second largest source of Asia’s share of control, increasing only marginally over the time period to make up 28.2% of the region’s total assets for 2016.

Data table for Chart 1.3
| Distributive trades | Financial services | Manufacturing | Resources and mining | Other | |
|---|---|---|---|---|---|
| percent | |||||
| 2009 | 12.3 | 27.6 | 23.1 | 27.2 | 9.8 |
| 2016 | 11.4 | 28.2 | 17.7 | 35.5 | 7.3 |
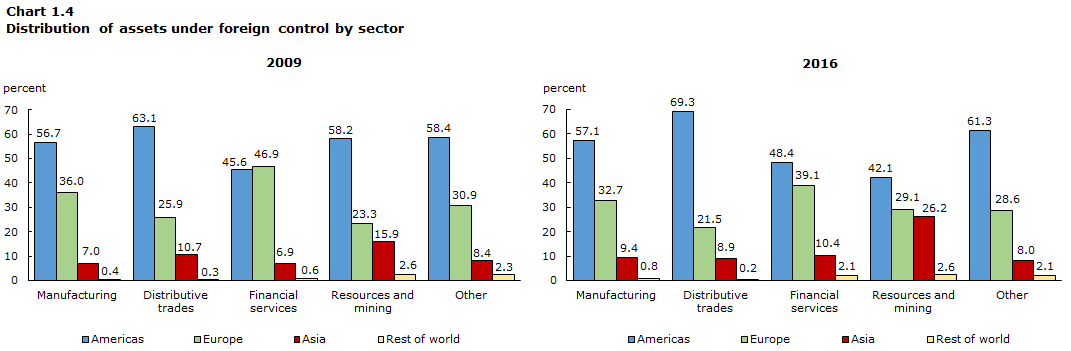
The distribution of control across the five industry groups is compared with the rest of the world in Chart 1.4. Shown below, Asia remains less influential than its counterparts per breakdown, especially when compared against the Americas whose influence is largest due to the proximity and historical trade relationship between Canada and the United States.
Most recent data shows how foreign control by macro-region is more evenly distributed in Canada’s resources and mining for 2016 when compared to the distributions for other sectors which are much more skewed towards the Americas. This is especially noteworthy in the context of Asia’s recent growth in foreign control; Asia’s ownership of total assets in the resources and mining sector nearly doubled from 15.9% in 2009 to 26.2% in 2016.
Data table for Chart 1.4
| Manufacturing | Distributive trades |
Financial services | Resources and mining | Other | |
|---|---|---|---|---|---|
| percent | |||||
| 2009 | |||||
| Americas | 56.7 | 63.1 | 45.6 | 58.2 | 58.4 |
| Europe | 36.0 | 25.9 | 46.9 | 23.3 | 30.9 |
| Asia | 7.0 | 10.7 | 6.9 | 15.9 | 8.4 |
| Rest of world | 0.4 | 0.3 | 0.6 | 2.6 | 2.3 |
| 2016 | |||||
| Americas | 57.1 | 69.3 | 48.4 | 42.1 | 61.3 |
| Europe | 32.7 | 21.5 | 39.1 | 29.1 | 28.6 |
| Asia | 9.4 | 8.9 | 10.4 | 26.2 | 8.0 |
| Rest of world | 0.8 | 0.2 | 2.1 | 2.6 | 2.1 |
Chart 1.5 illustrates Asia’s growing influence with a breakdown of total assets from the region, in nominal terms, across each of the five industry groups for the period 2009 to 2016. It highlights the sharp increase in Asia’s ownership of asset in resources and mining which begins in 2010 followed by a more gradual increase in ownership of assets in the financial services sector.

Data table for Chart 1.5
| Distributive trades | Financial resources | Manufacturing | Resources and mining | Other | |
|---|---|---|---|---|---|
| billions (CND) | |||||
| 2016 | 27,911,021 | 68,954,446 | 43,387,385 | 86,925,894 | 17,766,434 |
| 2015 | 23,202,262 | 78,488,133 | 43,993,861 | 89,096,201 | 14,612,004 |
| 2014 | 21,237,291 | 67,371,497 | 38,159,331 | 97,016,327 | 12,208,307 |
| 2013 | 19,898,691 | 58,910,821 | 34,215,635 | 92,062,450 | 11,096,039 |
| 2012 | 19,405,605 | 51,892,671 | 33,084,752 | 77,130,868 | 10,614,235 |
| 2011 | 18,017,430 | 41,652,571 | 31,258,897 | 69,259,135 | 17,125,785 |
| 2010 | 17,398,425 | 36,802,480 | 29,963,100 | 38,139,973 | 13,186,029 |
| 2009 | 15,629,269 | 35,088,009 | 29,395,898 | 34,602,717 | 12,485,531 |
To see how individual countries in Asia have contributed over time to the overall levels of foreign-controlled assets in Canada, see Chart 1.6 below.
Chart 1.6 illustrates Japan as the largest contributor to control from the region, followed by the residual category. It also shows how China’s relative significance has increased sharply in the time period. Asia’s share of foreign control in Canada grew from 7.6% to 12.3% over the ten years ending in 2016. Of this growth, China contributed 1.9%, Japan 1.2%, and the rest of Asia (which includes Hong Kong and Macau) the remaining 1.6%. Of Asia’s foreign controlled assets, China controls the second highest level followed by India and South Korea.

Data table for Chart 1.6
| China | India | South Korea | Japan | Other Asia | |
|---|---|---|---|---|---|
| CDN (in billions) | |||||
| 2007 | 737,418 | 6,359,571 | 1,552,158 | 52,760,634 | 44,338,246 |
| 2008 | 711,401 | 10,990,561 | 2,055,600 | 56,889,368 | 49,787,900 |
| 2009 | 1,095,786 | 9,805,622 | 6,815,208 | 58,495,240 | 50,989,568 |
| 2010 | 4,637,430 | 9,330,126 | 7,163,406 | 59,058,147 | 55,300,898 |
| 2011 | 23,623,916 | 10,179,212 | 9,836,785 | 62,831,326 | 70,842,579 |
| 2012 | 23,417,332 | 13,178,103 | 10,547,221 | 73,548,690 | 71,436,785 |
| 2013 | 37,106,668 | 13,256,016 | 11,002,594 | 78,554,116 | 76,264,242 |
| 2014 | 39,296,146 | 14,739,112 | 11,488,687 | 90,510,774 | 79,958,034 |
| 2015 | 36,152,375 | 18,565,040 | 9,741,873 | 103,709,287 | 81,223,886 |
| 2016 | 39,599,706 | 16,746,528 | 10,230,763 | 99,773,502 | 78,594,681 |
China’s growth in foreign control is most interesting given the country’s steep increase from a 0.1% share in 2007 up to 2.0% by 2016. To better illustrate this growth, Chart 1.7 shows the percentage change in year-over-year growth of China’s control in Canadian enterprises as measured by the level of total assets owned from 2008 to 2016.
The remainder of this paper will focus on Asia’s control in resources and mining in Canada, with an emphasis on China.

Data table for Chart 1.7
| Year over year change in China's total assets | |
|---|---|
| percent | |
| 2016 | 9.5 |
| 2015 | -8.0 |
| 2014 | 5.9 |
| 2013 | 58.5 |
| 2012 | -0.9 |
| 2011 | 409.4 |
| 2010 | 323.2 |
| 2009 | 54.0 |
| 2008 | -3.5 |
| 2007 | 0.0 |
Asia’s share of foreign ownership in Canada’s resources and mining sector
For the purpose of this paper, the resources and mining industry group is composed of the following NAICS 2017 industry classes: agriculture, forestry, fishing and hunting (NAICS 11); and mining, quarrying, and oil and gas extraction (NAICS 21).
Resources and mining as a share of Asia’s total foreign control
Asia’s share of foreign-controlled assets in resources and mining relative to its share of overall foreign control in Canada is shown below in Chart 2.1.

Data table for Chart 2.1
| Resources and mining | All industries | |
|---|---|---|
| percent | ||
| 2016 | 4.4 | 12.3 |
| 2015 | 4.5 | 12.7 |
| 2014 | 5.0 | 12.1 |
| 2013 | 5.0 | 11.7 |
| 2012 | 4.3 | 10.8 |
| 2011 | 4.1 | 10.5 |
| 2010 | 2.5 | 8.9 |
| 2009 | 2.4 | 8.8 |
Asia’s share of resources and mining as a proportion of total foreign control in the sector
In 2016, Asia controlled 26.2%, or $89.6 billion, of total assets under foreign-control in the resources and mining sector, an increase of 10.3% from 2009 to 2016. Chart 2.2 shows the distribution of shares of total foreign control within resources and mining in Canada by macro region. A data table breaking down each grouping’s relative contribution to Asia’s share of total foreign control in Canada is provided in Appendix C.

Data table for Chart 2.2
| Asia | Europe | Americas | Rest of world | |
|---|---|---|---|---|
| percent | ||||
| 2009 | 15.9 | 23.3 | 58.2 | 2.6 |
| 2016 | 26.2 | 29.1 | 42.1 | 2.6 |
Over the period of 2009 to 2016, Asia’s total asset level in the grouping grew to almost match the level held by Europe in 2016. In contrast, the Americas witnessed a decline of 16.1% in their share of the foreign control in Canada’s resources and mining sector. Asia’s rapid growth in resources and mining is discussed in greater detail below.
Resources and mining
The majority of assets controlled by the Asia region in the resources and mining grouping are made up of operations in oil and gas extraction as well as support activities involved in mining, and oil and gas extraction. Other sub-industries such as crop production, forestry and logging, and animal production all play a role in Asia’s ownership of assets in Canada, but are not key drivers of growth within the grouping. Chart 2.3 shows the share of total foreign control in resources and mining by country in Asia; only China and Japan are shown for 2011 to 2016 due to the confidentiality of data in detailing other countries and years.

Data table for Chart 2.3
| China | Japan | Rest of Asia | Total Asia | |
|---|---|---|---|---|
| percent | ||||
| 2016 | 8.7 | 1.2 | 16.3 | 26.2 |
| 2015 | 8.2 | 1.1 | 16.8 | 26.1 |
| 2014 | 9.6 | 1.0 | 19.8 | 30.4 |
| 2013 | 8.8 | 1.1 | 18.8 | 28.7 |
| 2012 | 5.8 | 1.2 | 19.7 | 26.7 |
| 2011 | 6.2 | 0.7 | 17.5 | 24.4 |
As shown previously, Japan dominates foreign control from Asia in Canada, but is less significant in the resources and mining grouping when compared to its regional peers. China is a strong contributor to total foreign control within the resources and mining grouping with its relative share increasing from 6.2% in 2011 to 8.7% in 2016 as compared to Japan’s 0.7% to 1.2%. The combined total assets from the rest of Asia, which includes the Special Administrative Regions of Hong Kong and Macau, represent the greatest proportion of total control from the region with 17.5% in 2011 down slightly to 16.3% in 2016. A data table detailing the shares by country and region, including the Americas and Europe, are given in Appendix D.
Between 2001 and 2013, the Canadian resources industry attracted important foreign investments. This investment position began to appear less attractive as oil prices began to slip in the beginning of 2014. From 2014, a decline in total assets in the resources and mining sector under Asia control is observed. The lower oil price environment appears to have dampened the growth in this sector and may have discouraged large scale acquisitions by Chinese state-owned enterprises.

Data table for Chart 2.4
| 2009 | 2010 | 2011 | 2012 | 2013 | 2014 | 2015 | 2016 | |
|---|---|---|---|---|---|---|---|---|
| Blended price of barrel ($US/bbl) | 57 | 72 | 87 | 84 | 85 | 83 | 42 | 36 |
| Total assets (Resources and mining) under foreign control from Asia (CDN in billions) | 34.6 | 38.1 | 69.3 | 77.1 | 92.1 | 97.0 | 89.1 | 86.9 |
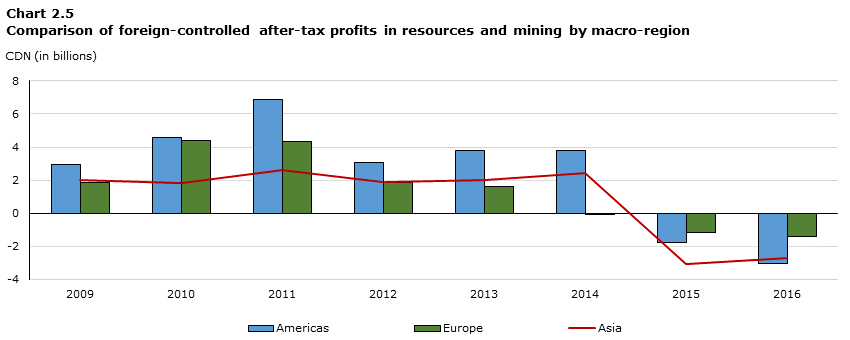
The decline in the price of crude oil led to a decline in revenues for the oil and gas extraction industry. Conversely, operating expenses increased resulting in marked profit losses for 2015 which carried through into 2016. The value of assets also weakened during that period and new investments stagnated.
Data table for Chart 2.5
| Americas | Europe | Asia | |
|---|---|---|---|
| CND (in billions) | |||
| 2016 | -3.0 | -1.4 | -2.7 |
| 2015 | -1.8 | -1.1 | -3.1 |
| 2014 | 3.8 | 0.0 | 2.4 |
| 2013 | 3.8 | 1.6 | 2.0 |
| 2012 | 3.1 | 1.8 | 1.9 |
| 2011 | 6.9 | 4.4 | 2.6 |
| 2010 | 4.5 | 4.4 | 1.8 |
| 2009 | 3.0 | 1.8 | 2.0 |
Conclusion
This paper explores the significance of Asia’s growth in foreign control of Canadian corporations from 2007 to 2016. Over the time period studied, the macro-region’s share of foreign control of Canadian corporations grew from 7.6% to 12.3%.
To better understand this trend, this paper provides new level of detail on the distribution and volume of corporate control activity across five new breakdowns. It finds that Asia’s position relative to the rest of the world has become more competitive in the resources and mining sector from 2009 to 2016 and less competitive in all others, as measured by shares of foreign control within each grouping.
Of the 12.3% foreign control from Asia in 2016, Japanese enterprises hold the majority share with 5.0% of control from the region. Chinese enterprises increased their contribution to 2.0% from a previously held 0.1% in 2007. This resulted in making China the leading contributor to the macro-region’s growth in foreign control in Canada over the time period studied. This is mostly due to China’s participation in Canada’s natural resources sector.
An in depth review of Asia’s participation in resources and mining shows that in 2016 Asia controlled 26.2%, or $89.6 billion, of total assets under foreign-control, an increase of 10.3% from 2009. China makes up 8.7% of the foreign control total within the sector in 2016 up from 6.2% in 2011. This compares to Japan’s 0.7% in 2011 to 1.2% in 2016. The combined total assets from the rest of Asia in Canada’s resources and mining, which includes the Special Administrative Regions of Hong Kong and Macau, represent the greatest proportion of total control from the region with 17.5% in 2011 down slightly to 16.3% in 2016.
The majority of total assets controlled by the Asia region in the resources and mining are made up of operations in oil and gas extraction, as well as support activities involved in mining, and oil and gas extraction.
References
Gill, P. K. (2018). New findings on who controls Canadian corporations and how this has changed over 10 years: 2007 - 2016. Statistics Canada, Industrial Organization and Finance Division. Ottawa: Statistics Canada.
Appendix Tables
Appendix A
List of countries in the Standard Classification of Countries and Areas of Interest (SCCAI 2016) structure for Asia
Afghanistan
United Arab Emirates
Armenia
Azerbaijan
Bangladesh
Bahrain
Brunei Darussalam
Bhutan
China
Cyprus
Georgia
Hong Kong Special Administrative Region
Indonesia
India
British Indian Ocean Territory
Iran
Iraq
Israel
Jordan
Japan
Kazakhstan
Kyrgyzstan
Cambodia
Korea, South
Kuwait
Laos
Lebanon
Sri Lanka
Macao Special Administrative Region
Maldives
Burma (Myanmar)
Mongolia
Malaysia
Nepal
Oman
Pakistan
Philippines
Korea, North
West Bank and Gaza Strip (Palestine)
Qatar
Saudi Arabia
Singapore
Syria
Thailand
Tajikistan
Turkmenistan
Timor-Leste
Turkey
Taiwan
Uzbekistan
Viet Nam
Yemen
Appendix B
| Manufacturing | Distributive trades | Financial services | Resources and mining | Other | |
|---|---|---|---|---|---|
| percent | |||||
| 2009 | |||||
| Americas | 56.7 | 63.1 | 45.6 | 58.2 | 58.4 |
| Europe | 36.0 | 25.9 | 46.9 | 23.3 | 30.9 |
| Asia | 7.0 | 10.7 | 6.9 | 15.9 | 8.4 |
| Rest of world | 0.4 | 0.3 | 0.6 | 2.6 | 2.3 |
| Total foreign | 100.0 | 100.0 | 100.0 | 100.0 | 100.0 |
| 2016 | |||||
| Americas | 57.1 | 69.3 | 48.4 | 42.1 | 61.3 |
| Europe | 32.7 | 21.5 | 39.1 | 29.1 | 28.6 |
| Asia | 9.4 | 8.9 | 10.4 | 26.2 | 8.0 |
| Rest of world | 0.8 | 0.2 | 2.1 | 2.6 | 2.1 |
| Total foreign | 100.0 | 100.0 | 100.0 | 100.0 | 100.0 |
Appendix C
| Year | Manufacturing | Distributive trades | Financial resources | Resources and mining | Other | Total Asia |
|---|---|---|---|---|---|---|
| percent | ||||||
| 2016 | 2.2 | 1.4 | 3.5 | 4.4 | 0.9 | 12.3 |
| 2015 | 2.2 | 1.2 | 4.0 | 4.5 | 0.7 | 12.7 |
| 2014 | 2.0 | 1.1 | 3.5 | 5.0 | 0.6 | 12.1 |
| 2013 | 1.8 | 1.1 | 3.2 | 5.0 | 0.6 | 11.7 |
| 2012 | 1.9 | 1.1 | 2.9 | 4.3 | 0.6 | 10.8 |
| 2011 | 1.8 | 1.1 | 2.5 | 4.1 | 1.0 | 10.5 |
| 2010 | 2.0 | 1.1 | 2.4 | 2.5 | 0.9 | 8.9 |
| 2009 | 2.0 | 1.1 | 2.4 | 2.4 | 0.9 | 8.8 |
Appendix D
| China | Japan | Rest of Asia | Asia | Europe | Americas | Rest of World | Total Foreign | |
|---|---|---|---|---|---|---|---|---|
| percent | ||||||||
| Manufacturing | ||||||||
| 2016 | 0.2 | 4.8 | 4.4 | 9.4 | 32.7 | 57.1 | 0.8 | 100.0 |
| 2015 | 0.2 | 4.8 | 4.8 | 9.8 | 33.5 | 55.8 | 0.9 | 100.0 |
| 2014 | 0.2 | 4.5 | 3.9 | 8.6 | 33.3 | 57.2 | 0.8 | 100.0 |
| 2013 | 0.2 | 4.0 | 3.9 | 8.0 | 33.4 | 57.8 | 0.8 | 100.0 |
| 2012 | x | 3.9 | 3.8 | 7.8 | 34.3 | 57.2 | 0.7 | 100.0 |
| 2011 | x | 3.8 | 3.6 | 7.5 | 34.7 | 57.3 | 0.6 | 100.0 |
| 2010 | x | 3.7 | 3.4 | 7.2 | 34.9 | 57.4 | 0.6 | 100.0 |
| 2009 | x | 3.7 | 3.2 | 7.0 | 36.0 | 56.7 | 0.4 | 100.0 |
| 2008 | x | 3.8 | 2.8 | 6.5 | 37.4 | 55.7 | 0.4 | 100.0 |
| 2007 | x | 4.0 | 2.1 | 6.1 | 29.7 | 63.9 | 0.3 | 100.0 |
| Distributive trades | ||||||||
| 2016 | 0.7 | 6.9 | 1.3 | 8.9 | 21.5 | 69.3 | 0.2 | 100.0 |
| 2015 | 0.7 | 6.3 | 1.3 | 8.3 | 20.8 | 70.7 | 0.2 | 100.0 |
| 2014 | 0.3 | 6.9 | 1.3 | 8.5 | 22.7 | 68.6 | 0.3 | 100.0 |
| 2013 | 0.2 | 7.5 | 1.5 | 9.2 | 22.6 | 67.8 | 0.5 | 100.0 |
| 2012 | 0.1 | 7.6 | 1.4 | 9.1 | 25.1 | 65.2 | 0.6 | 100.0 |
| 2011 | 0.2 | 8.2 | 1.3 | 9.6 | 23.1 | 66.6 | 0.6 | 100.0 |
| 2010 | 0.1 | 9.0 | 1.5 | 10.6 | 25.6 | 63.5 | 0.3 | 100.0 |
| 2009 | 0.1 | 9.0 | 1.6 | 10.7 | 25.9 | 63.1 | 0.3 | 100.0 |
| 2008 | x | 8.3 | 1.6 | 9.9 | 23.6 | 66.1 | 0.3 | 100.0 |
| 2007 | 0.1 | 8.8 | 1.2 | 10.1 | 26.3 | 63.3 | 0.3 | 100.0 |
| Financial services | ||||||||
| 2016 | 0.9 | 6.8 | 2.7 | 10.4 | 39.1 | 48.4 | 2.1 | 100.0 |
| 2015 | 0.8 | 8.4 | 2.8 | 12.0 | 39.5 | 47.3 | 1.1 | 100.0 |
| 2014 | 0.9 | 6.3 | 2.2 | 9.4 | 47.3 | 42.2 | 1.1 | 100.0 |
| 2013 | 1.1 | 5.5 | 2.1 | 8.6 | 48.9 | 41.0 | 1.5 | 100.0 |
| 2012 | 0.9 | 5.2 | 1.9 | 8.0 | 48.3 | 42.0 | 1.7 | 100.0 |
| 2011 | 0.8 | 4.1 | 1.7 | 6.7 | 52.6 | 39.5 | 1.2 | 100.0 |
| 2010 | 0.7 | 4.4 | 1.7 | 6.9 | 47.8 | 44.4 | 0.9 | 100.0 |
| 2009 | Note x: suppressed to meet the confidentiality requirements of the Statistics Act | Note x: suppressed to meet the confidentiality requirements of the Statistics Act | Note x: suppressed to meet the confidentiality requirements of the Statistics Act | 6.9 | 46.9 | 45.6 | 0.6 | 100.0 |
| 2008 | Note x: suppressed to meet the confidentiality requirements of the Statistics Act | Note x: suppressed to meet the confidentiality requirements of the Statistics Act | Note x: suppressed to meet the confidentiality requirements of the Statistics Act | 6.6 | 44.7 | 48.5 | 0.3 | 100.0 |
| 2007 | Note x: suppressed to meet the confidentiality requirements of the Statistics Act | Note x: suppressed to meet the confidentiality requirements of the Statistics Act | Note x: suppressed to meet the confidentiality requirements of the Statistics Act | 5.8 | 45.1 | 49.0 | 0.1 | 100.0 |
| Resources and mining | ||||||||
| 2016 | 8.7 | 1.2 | 16.3 | 26.2 | 29.1 | 42.1 | 2.6 | 100.0 |
| 2015 | 8.2 | 1.1 | 16.8 | 26.1 | 28.0 | 43.5 | 2.4 | 100.0 |
| 2014 | 9.6 | 1.0 | 19.8 | 30.4 | 17.9 | 49.0 | 2.7 | 100.0 |
| 2013 | 8.8 | 1.1 | 18.8 | 28.7 | 20.0 | 48.7 | 2.6 | 100.0 |
| 2012 | 5.8 | 1.2 | 19.7 | 26.7 | 22.6 | 48.1 | 2.6 | 100.0 |
| 2011 | 6.2 | 0.7 | 17.5 | 24.4 | 21.4 | 51.6 | 2.6 | 100.0 |
| 2010 | Note x: suppressed to meet the confidentiality requirements of the Statistics Act | Note x: suppressed to meet the confidentiality requirements of the Statistics Act | Note x: suppressed to meet the confidentiality requirements of the Statistics Act | 16.3 | 22.0 | 59.3 | 2.4 | 100.0 |
| 2009 | Note x: suppressed to meet the confidentiality requirements of the Statistics Act | Note x: suppressed to meet the confidentiality requirements of the Statistics Act | Note x: suppressed to meet the confidentiality requirements of the Statistics Act | 15.9 | 23.3 | 58.2 | 2.6 | 100.0 |
| 2008 | Note x: suppressed to meet the confidentiality requirements of the Statistics Act | Note x: suppressed to meet the confidentiality requirements of the Statistics Act | Note x: suppressed to meet the confidentiality requirements of the Statistics Act | Note x: suppressed to meet the confidentiality requirements of the Statistics Act | Note x: suppressed to meet the confidentiality requirements of the Statistics Act | Note x: suppressed to meet the confidentiality requirements of the Statistics Act | Note x: suppressed to meet the confidentiality requirements of the Statistics Act | Note x: suppressed to meet the confidentiality requirements of the Statistics Act |
| 2007 | Note x: suppressed to meet the confidentiality requirements of the Statistics Act | Note x: suppressed to meet the confidentiality requirements of the Statistics Act | Note x: suppressed to meet the confidentiality requirements of the Statistics Act | Note x: suppressed to meet the confidentiality requirements of the Statistics Act | Note x: suppressed to meet the confidentiality requirements of the Statistics Act | Note x: suppressed to meet the confidentiality requirements of the Statistics Act | Note x: suppressed to meet the confidentiality requirements of the Statistics Act | Note x: suppressed to meet the confidentiality requirements of the Statistics Act |
| x suppressed to meet the confidentiality requirements of the Statistics Act | ||||||||
- Date modified: