
Agriculture

Archived Content
Information identified as archived is provided for reference, research or recordkeeping purposes. It is not subject to the Government of Canada Web Standards and has not been altered or updated since it was archived. Please "contact us" to request a format other than those available.
Related information
Farming is still mainly a family business in Canada. Some farmers work huge mechanized farms while others supplement their farm incomes with work off the farm. Add in producer support programs, capital cost allowances, the vagaries of weather and changing market prices and it is not surprising that farm incomes can vary dramatically.
In 2008, the average income for farm families was $100,031, up from $72,792 in 2003. Both off-farm income and net farm operating income increased. Farm families in Alberta reported the highest incomes at $122,845 and those in New Brunswick reported the lowest incomes at $75,071.
The goods and services produced by agriculture and food industries together accounted for about 8% of Canada's gross domestic product (GDP).
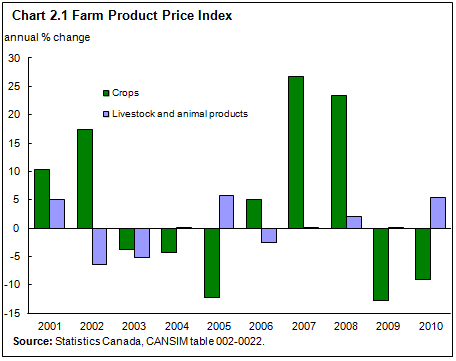
Fewer workers, larger farms
Many Canadians are a generation or two removed from the farm. In 1921, agriculture was the single most common occupation, employing 1 million Canadians and accounting for one-third of all jobs. By 2008, about 327,000 people were primarily employed in agriculture, accounting for 1.8% of the labour force. The food manufacturing industry directly employed 226,252 people and the beverage and tobacco products manufacturing industry employed another 26,695 people. This total of 252,947 workers accounted for 15.1% of the total employment in manufacturing.
Over time, farms have become more specialized and the average farm size has increased. However, from 1986 to 2006, the total farm area in Canada decreased slightly, from 67.8 million hectares to 67.6 million hectares and the number of farms in operation decreased from 293,089 to 229,373. During this period, the area dedicated to crop production increased from 33.2 million hectares to 35.9 million hectares.
Shifting production
Crops have shifted as well. Wheat remains an important crop, with 8.6 million hectares planted in 2010. But farmers also planted 6.8 million hectares in canola, a crop that has steadily expanded to meet growing demand for canola oil and for use in the biofuel industry. Farm receipts for canola totalled $5.6 billion in 2010, exceeding the receipts for wheat.
In 2010, farmers cultivated 1.5 million hectares in soybeans, a nearly tenfold increase since 1976, when farmers began planting soybean varieties that could grow well in Canada's shorter growing season.
Labour-intensive fruit crops, including apples, have declined, while crops that grow on low bushes and can be machine-harvested, like blueberries or sour cherries, have increased. Berries containing antioxidants, particularly blueberries, have seen higher consumer demand. Farmers cultivated 66,767 hectares of blueberries in 2010, up from 50,159 hectares in 2002. Over the same years, apple production fell to 18,377 hectares from 24,522 hectares.
Greenhouse production has also expanded, making crops like tomatoes, cucumbers and green peppers more available year round. In 1986, there were 7.2 million square metres under glass. By 2006, greenhouse area had tripled to 21.9 million square metres.
Among livestock producers, pork producers have faced a volatile market with fluctuating costs for feed and for prices paid at market. Livestock receipts totalled $18.9 billion in 2010, up from $18.1 billion in 2009. Receipts for pigs rose to $3.4 billion from $2.9 billion in 2009. Over the same period, cattle and calf receipts increased 5.0%, from $5.9 billion to $6.2 billion.
Turkeys and turkey farms are getting larger. From 2001 to 2006, the number of farms declined 19% and there were also 5% fewer birds. However, farmers produced 188.7 million kilograms of turkey in 2005, up 6% from 2000. Larger farms are producing fewer, heavier birds.
In addition to crop and animal production, commercial fisheries are an important source of food. In 2005, more than 16,500 marine vessels in Canada landed more than 1 million tonnes of seafood, which was worth more than $2 billion.
Food exports
As one of the world's leading agri-food trading nations, Canada continued to export more agri-food products than it imported in 2009, even though exports decreased 7.6% to $29.8 billion and imports increased 3.7% to $27.8 billion. Canada's trade surplus in agricultural and fish products was $2.0 billion in 2009.
OECD projections for 2007 to 2016 suggest that much of the increase in agricultural production will come from Australia, Canada, Mexico, New Zealand, Turkey and the United States—countries that showed a rapid growth in production over the 1990s.
- Date modified: