Geography
Archived Content
Information identified as archived is provided for reference, research or recordkeeping purposes. It is not subject to the Government of Canada Web Standards and has not been altered or updated since it was archived. Please "contact us" to request a format other than those available.
Related information
Sometimes, the easiest way to understand and visualize statistical data is by looking at a map.
Geographers use data from the census and from surveys to map phenomena such as the richest neighbourhoods in Toronto, the population density in Alberta or heart disease by health region.
Statistics Canada produces three different types of maps:
- Reference maps show the boundaries, names and codes of standard geographic areas, as well as the major visible features such as roads, railroads, coastlines, lakes and rivers.
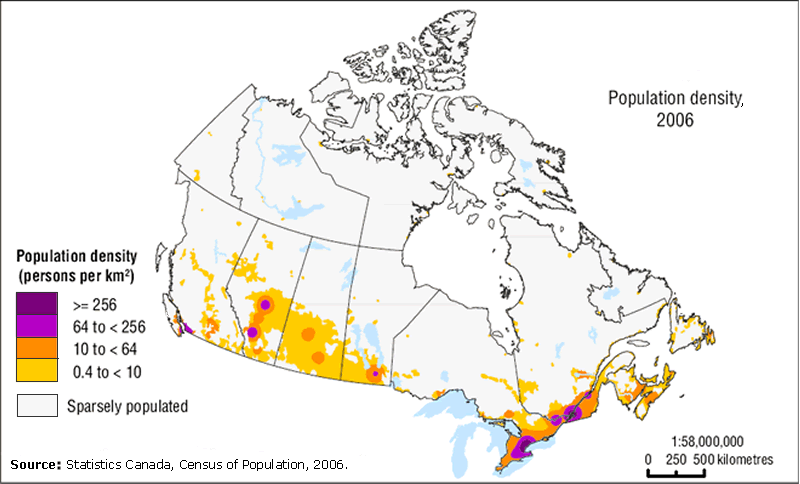
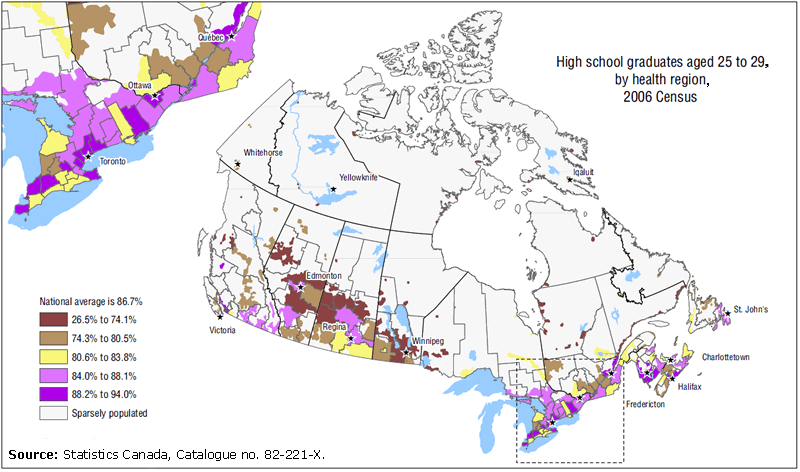
- Thematic maps show the spatial distribution of a specific theme, such as population density or average annual income, for a selected geographic area.
- Interactive maps enable users to use Web-based mapping applications. Statistics Canada maintains several data products with mapping applications, such as the Aboriginal Population Profile, Agricultural Community Profiles, Community Profiles, the Federal Electoral District Profile and Crop Condition Assessment Program. A mapping tool called GeoSearch makes it easy to find places in Canada. The tool displays the appropriate map showing boundaries and other features, the population and dwelling count for these places, as well as what kind of census geographic area it is and its relationship to other census geographic areas.
Visit Maps and geography at /mgeo/index-eng.htm to see how data can be better visualized and understood with maps.
- Date modified:


