Energy
Archived Content
Information identified as archived is provided for reference, research or recordkeeping purposes. It is not subject to the Government of Canada Web Standards and has not been altered or updated since it was archived. Please "contact us" to request a format other than those available.
Related information
The energy sector is vital to the nation's economy, accounting for 6.8% of gross domestic product (GDP) in 2008 and directly employing 363,000 people, or about 2% of the labour force.
Canada's energy consumption declined 2.1% in 2008 from 2007, the result of lower consumption in the industrial and transportation sectors following the recession that began in the fourth quarter of 2008.
Energy use derived from the three main fossil fuels (natural gas, refined petroleum products and coal) fell 3.6%, attributable to lower demand from iron and steel producers and the transportation sector. The manufacturing sector's demand for coal dropped 10.7%.
Canada's largest user of energy, representing about 31% of final demand, is the transportation sector; its energy consumption fell 3.5% from 2007 to 2008. The industrial sector, the second largest user of energy, consumed 5.9% less than in 2008. This decrease occurred primarily in three industries: pulp and paper, iron and steel, and cement.
Total domestic demand for all refined petroleum products, including fuel oils and motor gasoline, dropped 0.2% in 2008. Sales of gasoline amounted to 41.8 billion litres, down 1.0%.
Crude oil and natural gas production decrease
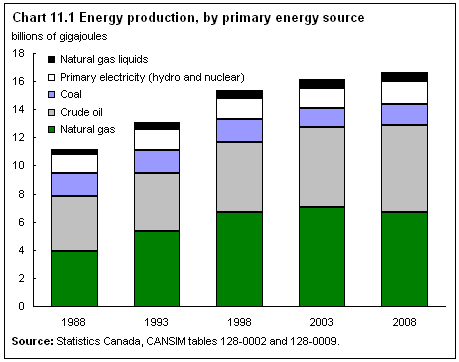
Canadian companies produced 158.9 million cubic metres of crude oil (and its hydrocarbon equivalents) in 2008, down 0.9% from 2007.
Marketable natural gas production totalled 157.9 billion cubic metres in 2008, down 5.4% from 2007, as natural gas drilling dropped 15.9%.
Alberta's oil sands accounted for 44% of total domestic crude oil production in 2008, up from 43% in 2007 and well above the 28% share in 2000. The oil sands produced 191,700 cubic metres of oil a day in 2008.
Exports of crude oil, primarily to the United States, increased from 2007 to 2008 by 1.7%. These exports accounted for 68% of Canadian oil production. Canada remains the leading oil exporter to the United States. Canadian crude oil represented about 20% of U.S. import demand in 2008.
Of Canada's marketable natural gas production in 2008, 65% is exported (mostly to the United States).

View data source for chart 11.1
Marginal increase in electricity production
Electricity production from primary sources (hydro, nuclear, wind and tidal) increased 2.7% in 2008, as demand rose 2.9%. Hydro generation—the largest source—accounted for 60% of electric power in 2008; nuclear energy provided 15%. In Ontario, nuclear power supplied 53% of the electricity generated. Coal production was down 2.3% in 2008 primarily because of lower demand from electric utilities (as well as lower demand from the manufacturing sector).
Although electricity generation from wind, solar and tidal sources is rising, these sources still represent less than 0.5% of total generation. In 2008, wind generation rose 26.3% to 2,369 megawatts (this capacity was 137 megawatts in 2000). As a result, Canada ranked 10th in the world in terms of new wind energy capacity at the end of 2008.
- Date modified:

