|
Ontario’s economy remained buoyant, adding a total of 453,000 jobs from January 2003 to December 2007, despite the losses in manufacturing. A similar change occurred in Quebec, as the economy added 263,000 jobs despite cuts in agriculture, forestry and manufacturing. In both provinces, growth came from increases in services and construction. Overall, the unemployment rate declined from 6.9% to 6.5% in Ontario and from 8.4% to 7.0% in Quebec.
The pattern of wages and salary increases across industries are remarkably similar to the changes in employment. Gains have tended to be largest in mining and lowest in manufacturing. Growth across service industries was fairly uniform.
Provincial terms of trade support real income growth
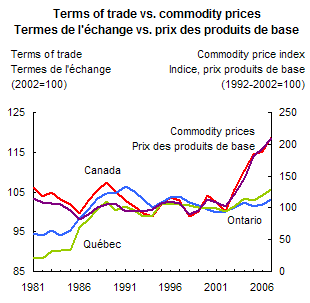
Despite the increase in energy prices, the terms of trade improved in both Quebec and Ontario between 2002 and 2007 (Figure 4). The terms of trade is the ratio of export prices to import prices, and represents the rate at which exports are traded for imports. An improvement in the terms of trade allows an economy to spend more than its domestic production alone would suggest, by increasing purchasing power on world markets.
Figure 4
The effect of terms-of-trade changes on real income can be measured using real gross domestic income (GDI). Real GDI is GDP deflated by the price of domestic spending. Rather than focusing only on production, it accounts for changes in purchasing power. It is therefore an income concept that reflects the goods and services an economy can use for consumption and investment instead of the goods and services an economy produces.
At the national level, the rising terms of trade were an important source of real income growth between 2002 and 2007. Canadian real GDI growth averaged 3.9%, 1.1 percentage points more than real GDP, as the terms-of-trade improvement allowed consumption (3.8%) and investment (6.7%) to increase faster than real output. In Ontario, consumption rose an average of 3.4% as real GDI (2.4%) growth outpaced real GDP (2.2%). In Quebec, consumption growth averaged 3.3% as real GDI (2.6%) rose faster than real GDP (2.0%).
Although the terms of trade increased after 2002 in both Quebec and Ontario, the sources of the improvements were noticeably different. For Quebec, the effect of Asia integrating into world markets contributed to higher export prices (notably metals) and lower import prices, despite the rise in energy prices (Figure 5). The combination of lower manufactured prices and the appreciation of the dollar translated into a sufficiently large drop in non-energy import prices to overcome the rising price of energy imports. The net result of lower import prices and rising export prices increased Quebec’s terms of trade by an average of 1.1% per year.
Figure 5

Ontario’s terms of trade also improved, but the gain came from import prices declining faster than the drop in export prices. The pattern of price movements suggests that as Asia integrated into world markets and the dollar appreciated, downward pressure on the price of manufactured goods led manufacturers in Ontario to lower their prices. But, overall export prices did not decline as quickly as import prices, and the terms of trade rose. Still, the increase in Ontario’s terms of trade was only half that of Quebec, and markedly less than for all of Canada.
Consumer and investment prices adjust
Prices for consumer goods and services and investment products have also shifted in Quebec and Ontario. Prices for items like furniture, appliances, clothes and shoes have declined since the late 1990s. Asia’s low-cost labour gave consumers in Canada access to cheaper products. As Asia increasingly became the source of those products, prices for durable and semi-durable goods fell.
The declines in durables and semi-durables prices were the first in the history of the provincial consumer price indexes for these products (Figure 6). In Quebec and Ontario, durable goods prices levelled off in the late 1990s, and began declining thereafter. Semi-durables followed a similar pattern.
Figure 6

Between 2002 and 2007, durables prices fell an average of 1.2% per year in both Quebec and Ontario (Table 1), while semi-durables declined by 0.7% in Quebec and 1.3% in Ontario. Non-durables prices (notably energy and food) rose quickly over the same period, averaging 3.4% per year in both provinces.
Prices for investment goods also adjusted as the resource boom led to a higher exchange rate. Prices for machinery, which is primarily imported, fell at an annual average rate of 4.8% in Quebec and 4.7% in Ontario. These declines were offset by strong demand from the resource sector and housing driving up the price of structures, and this raised the cost of capital goods slightly in both provinces.
Table 1 Average annual price changes, 2002 to 2007
| |
Canada |
Quebec |
Ontario |
| |
% |
| Consumer prices |
2.2 |
2.1 |
2.0 |
Durables
|
-1.1 |
-1.2 |
-1.2 |
Semi-durables
|
-0.8 |
-0.7 |
-1.3 |
Non-durables
|
3.4 |
3.4 |
3.4 |
Services
|
2.8 |
2.4 |
2.7 |
| |
|
|
|
| Investment prices |
1.8 |
0.8 |
0.8 |
Structures
|
5.1 |
4.5 |
5.1 |
Machinery
|
-4.6 |
-4.8 |
-4.7 |
|
China syndrome, Dutch disease and central Canada
Between 2002 and 2007, Quebec and Ontario began adjusting to the emergence of China as an economic powerhouse. Their manufacturing sectors shed jobs, shifting towards more durable goods production in Quebec while retrenching in Ontario. Despite the loss of factory jobs, construction and service sector employment more than made up the difference, leading to overall job growth and falling unemployment rates. Mining industries in both provinces benefited from rising prices, leading to higher employment and wages.
In both provinces, the rising terms of trade contributed to real income growth. However, the relative changes in import and export prices were quite different. In Ontario, export prices did not fall as fast as import prices: in Quebec, import prices declined while export prices increased.
In response to Asia’s integration into the world economy, and the transition underway in Canada, consumer prices and investment prices have adjusted in both provinces. Prices for outputs have declined while prices for inputs and non-traded goods and services have increased.
References
Amano, R. and S. van Norden. 1993. A Forecasting Equation for the Canada-U.S. Dollar Exchange Rate. In The Exchange Rate and the Economy. Proceedings of a conference held at the Bank of Canada. June 1992.
Bailliu, J. and M. R. King. 2005. What Drives Movements in Exchange Rate? Bank of Canada Review. Autumn 2005. Pp. 27-39.
Economist. 2005. How China Runs the World Economy. July 28th 2005 Print Edition.
Francis, Micheal. 2007. The Effect of China on Global Prices. Bank of Canada Review. Autumn 2007: 13:25.
Hutchinson, M. 1994. Manufacturing Sector Resiliency to Energy Booms: Empirical Evidence from Norway, the Netherlands, and the United Kingdom. Oxford Economic Papers New Series. Volume 46. (2). Pp. 311-329.
Macdonald, R. 2007a. The Terms of Trade and Domestic Expenditures. Statistics Canada. Catalogue Number 11-624-MIE2008018.
Macdonald, R. 2007b. Not Dutch Disease, Its China Syndrome. Statistics Canada Catalogue Number 11-624-MIE2007017.
Macdonald, R. 2007c. Real GDP and the Purchasing Power of Provincial Output. Statistics Canada.Catalogue Number 11F0027MIE.
Macdonald, R. 2008. The Resource Boom: Impacts on Provincial Purchasing Power. Statistics Canada. Catalogue Number 11-6242008021.
Recent feature articles
Notes
| * |
Micro-economic Analysis Division (613-951-5687). |
| 1 |
Resources include agriculture; forestry and support activities; fishing, hunting, and trapping; and, mining, oil and gas extraction. |
| 2 |
See Macdonald (2007b). |
| 3 |
Some manufacturing industries have been quite resilient in the face of rapid changes in their competitive environment. Hutchinson (1994) examines the response of the manufacturing industries in Norway, the Netherlands and the U.K. He concludes (p. 326) that: “For the economy of the Netherlands, where the term ‘Dutch disease’ was originally applied, very little systematic and long-term net adverse consequences of natural gas development on the manufacturing sector were found.” |
|


